
Azure Container Registry - Observability
Gain visibility into your Azure Container Registry usage and consumption. This dashboard surfaces key metrics for data transfer, transactions, storage, and throttling, with breakdowns by API operation and region to help you analyze usage trends, identify optimization opportunities, and monitor registry health.
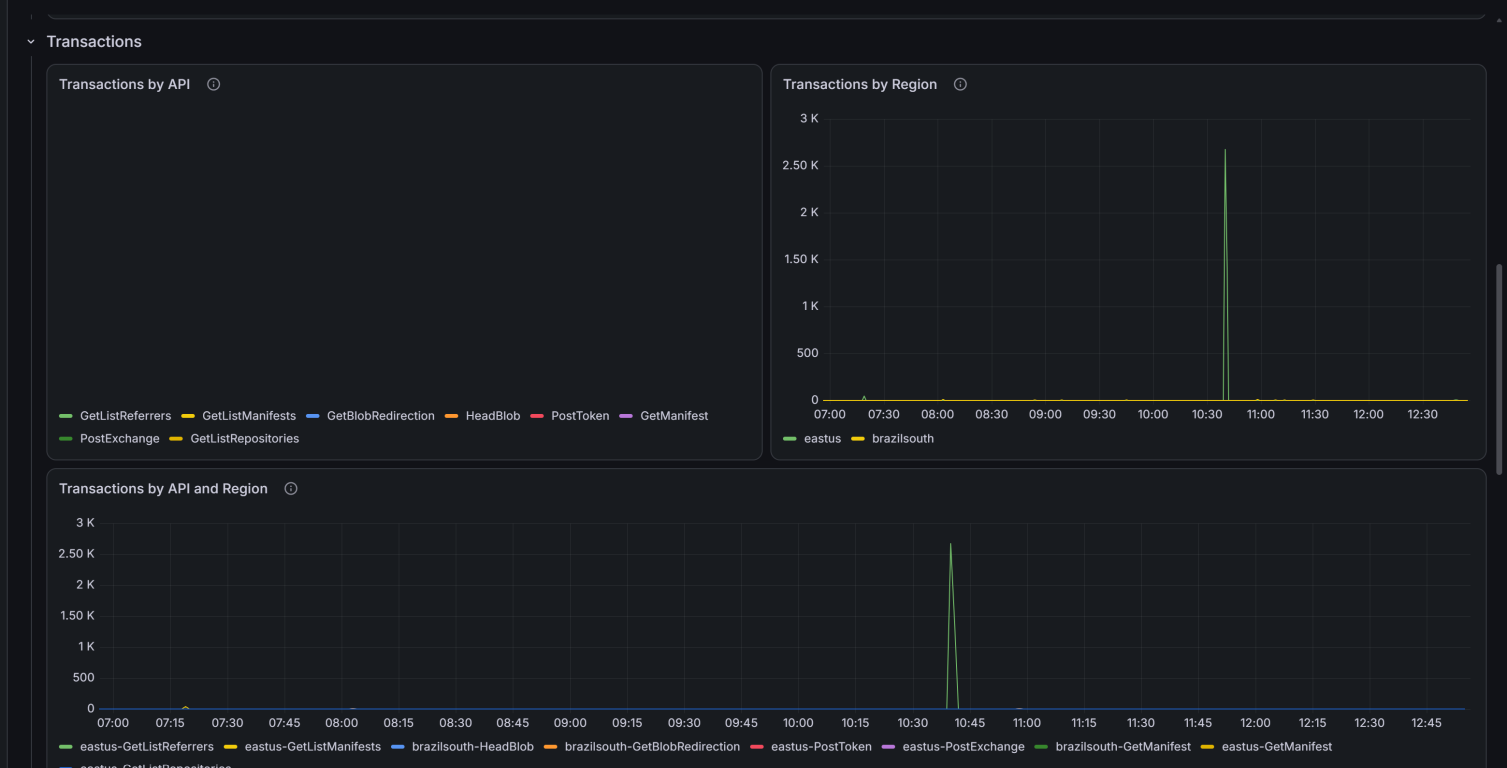
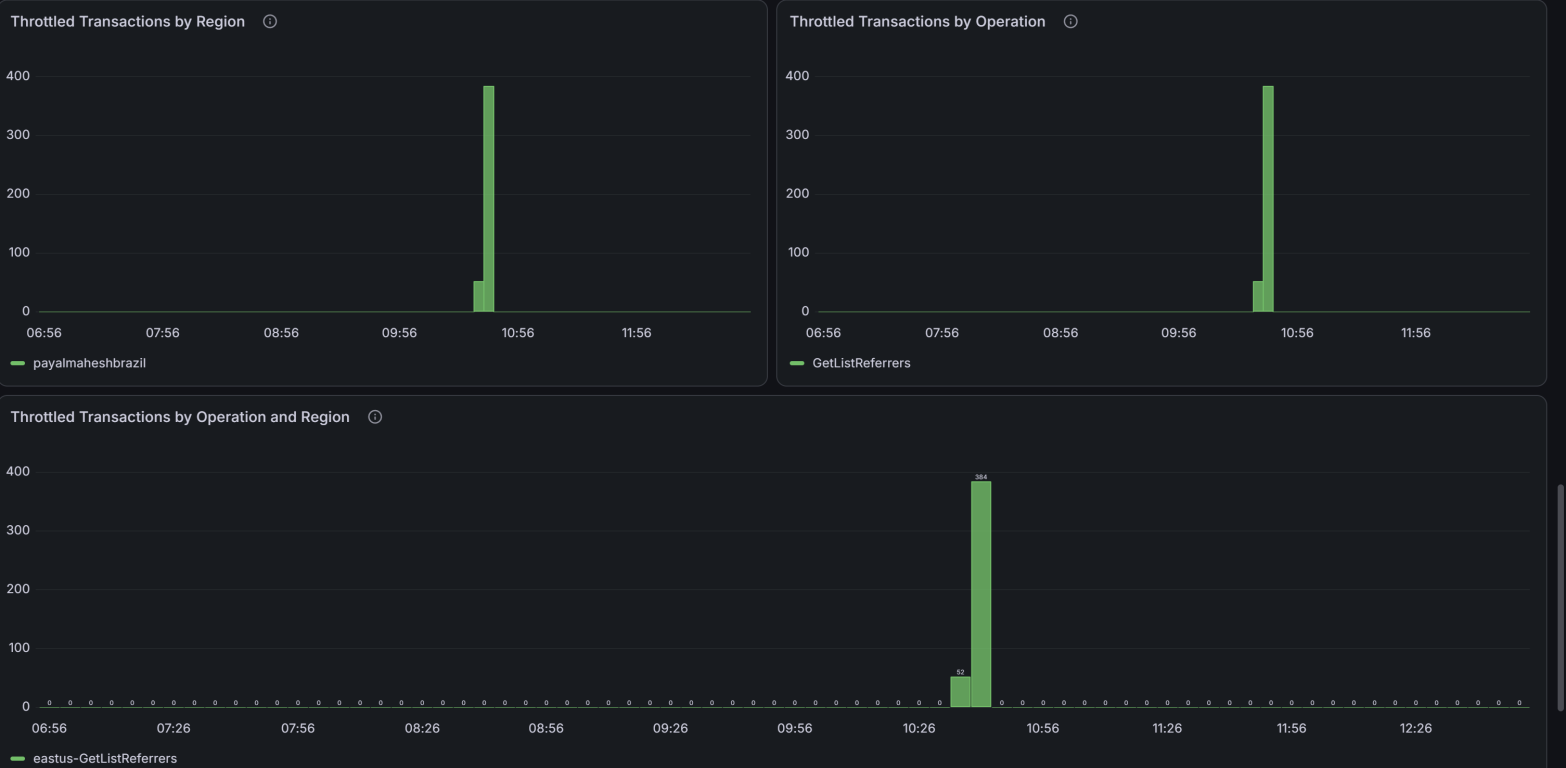
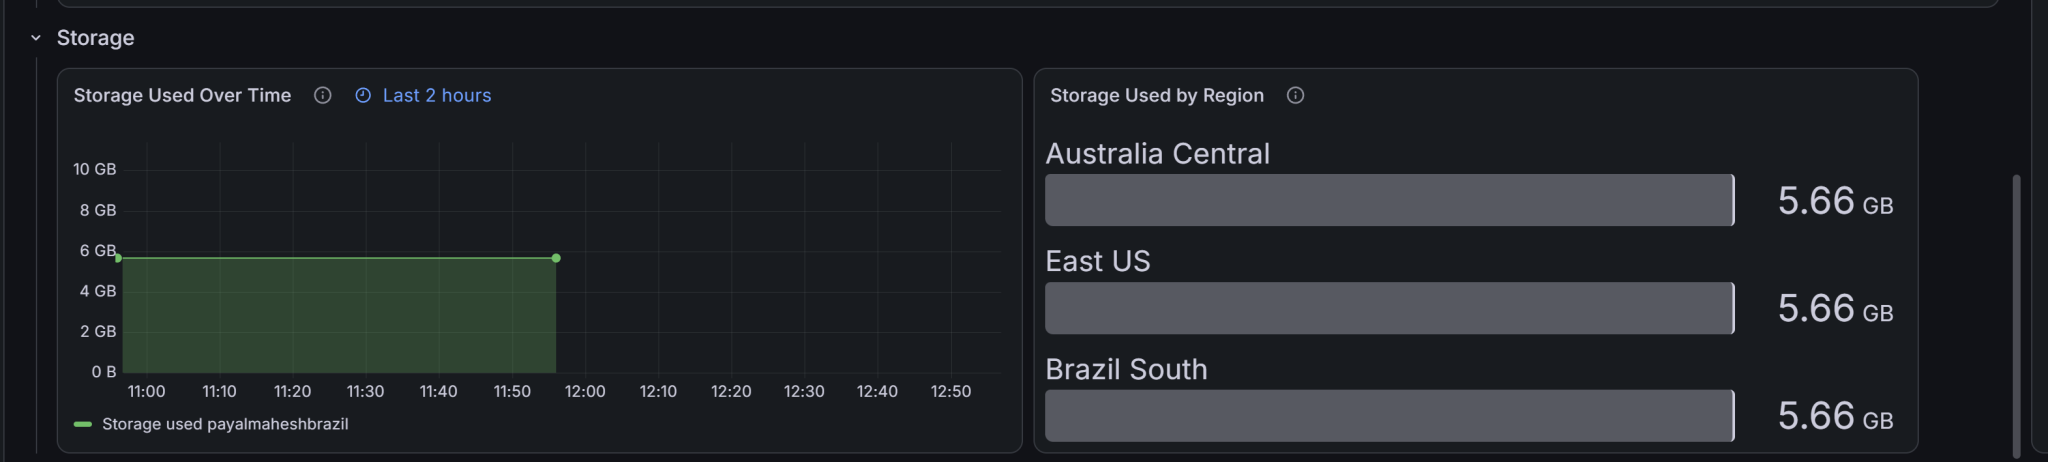
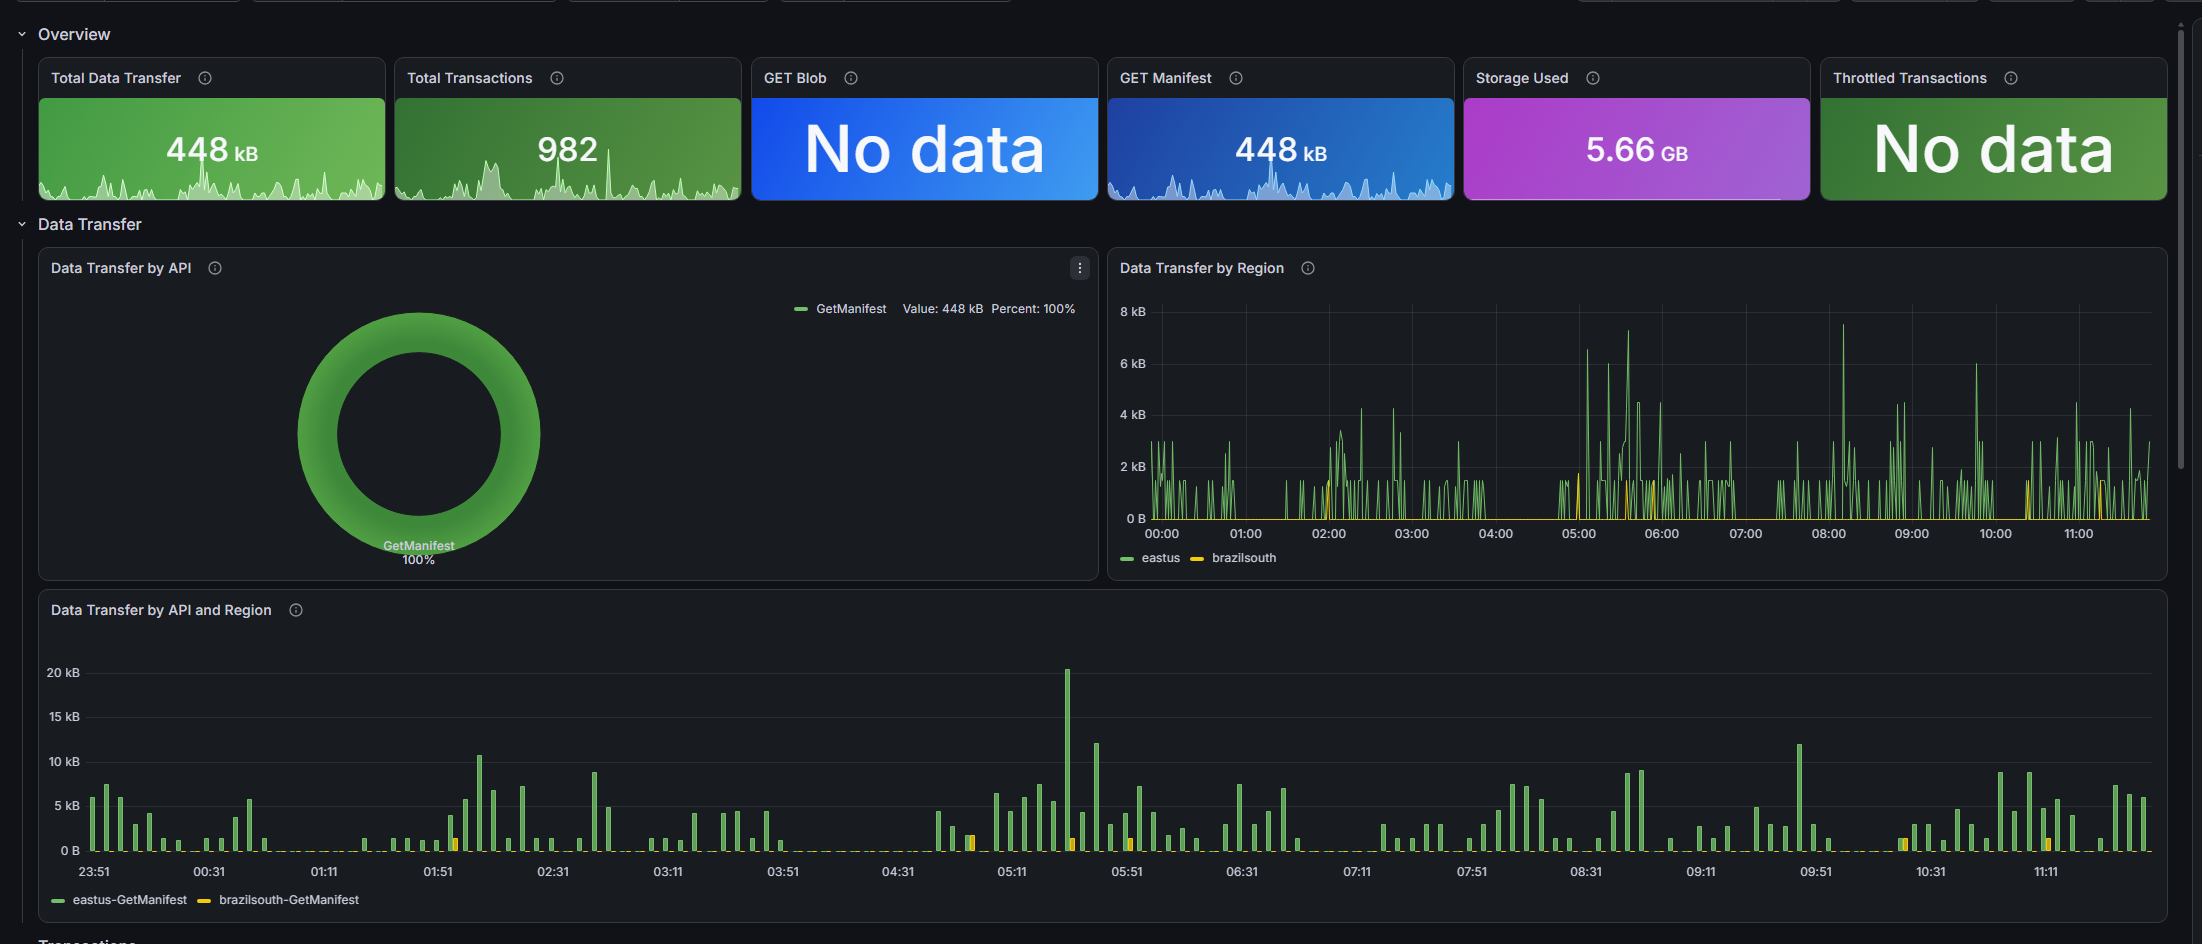
The Azure Container Registry - Observability dashboard uses the grafana-azure-monitor-datasource data source to create a Grafana dashboard with the barchart, bargauge, piechart, stat and timeseries panels.
Data source config
Collector type:
Collector plugins:
Collector config:
Revisions
Upload an updated version of an exported dashboard.json file from Grafana
| Revision | Description | Created | |
|---|---|---|---|
| Download |

Azure Cosmos DB

With the Grafana plugin for Azure Cosmos DB, you can quickly visualize and query your Azure Cosmos DB data from within Grafana.
Learn more