
Workflow Overview
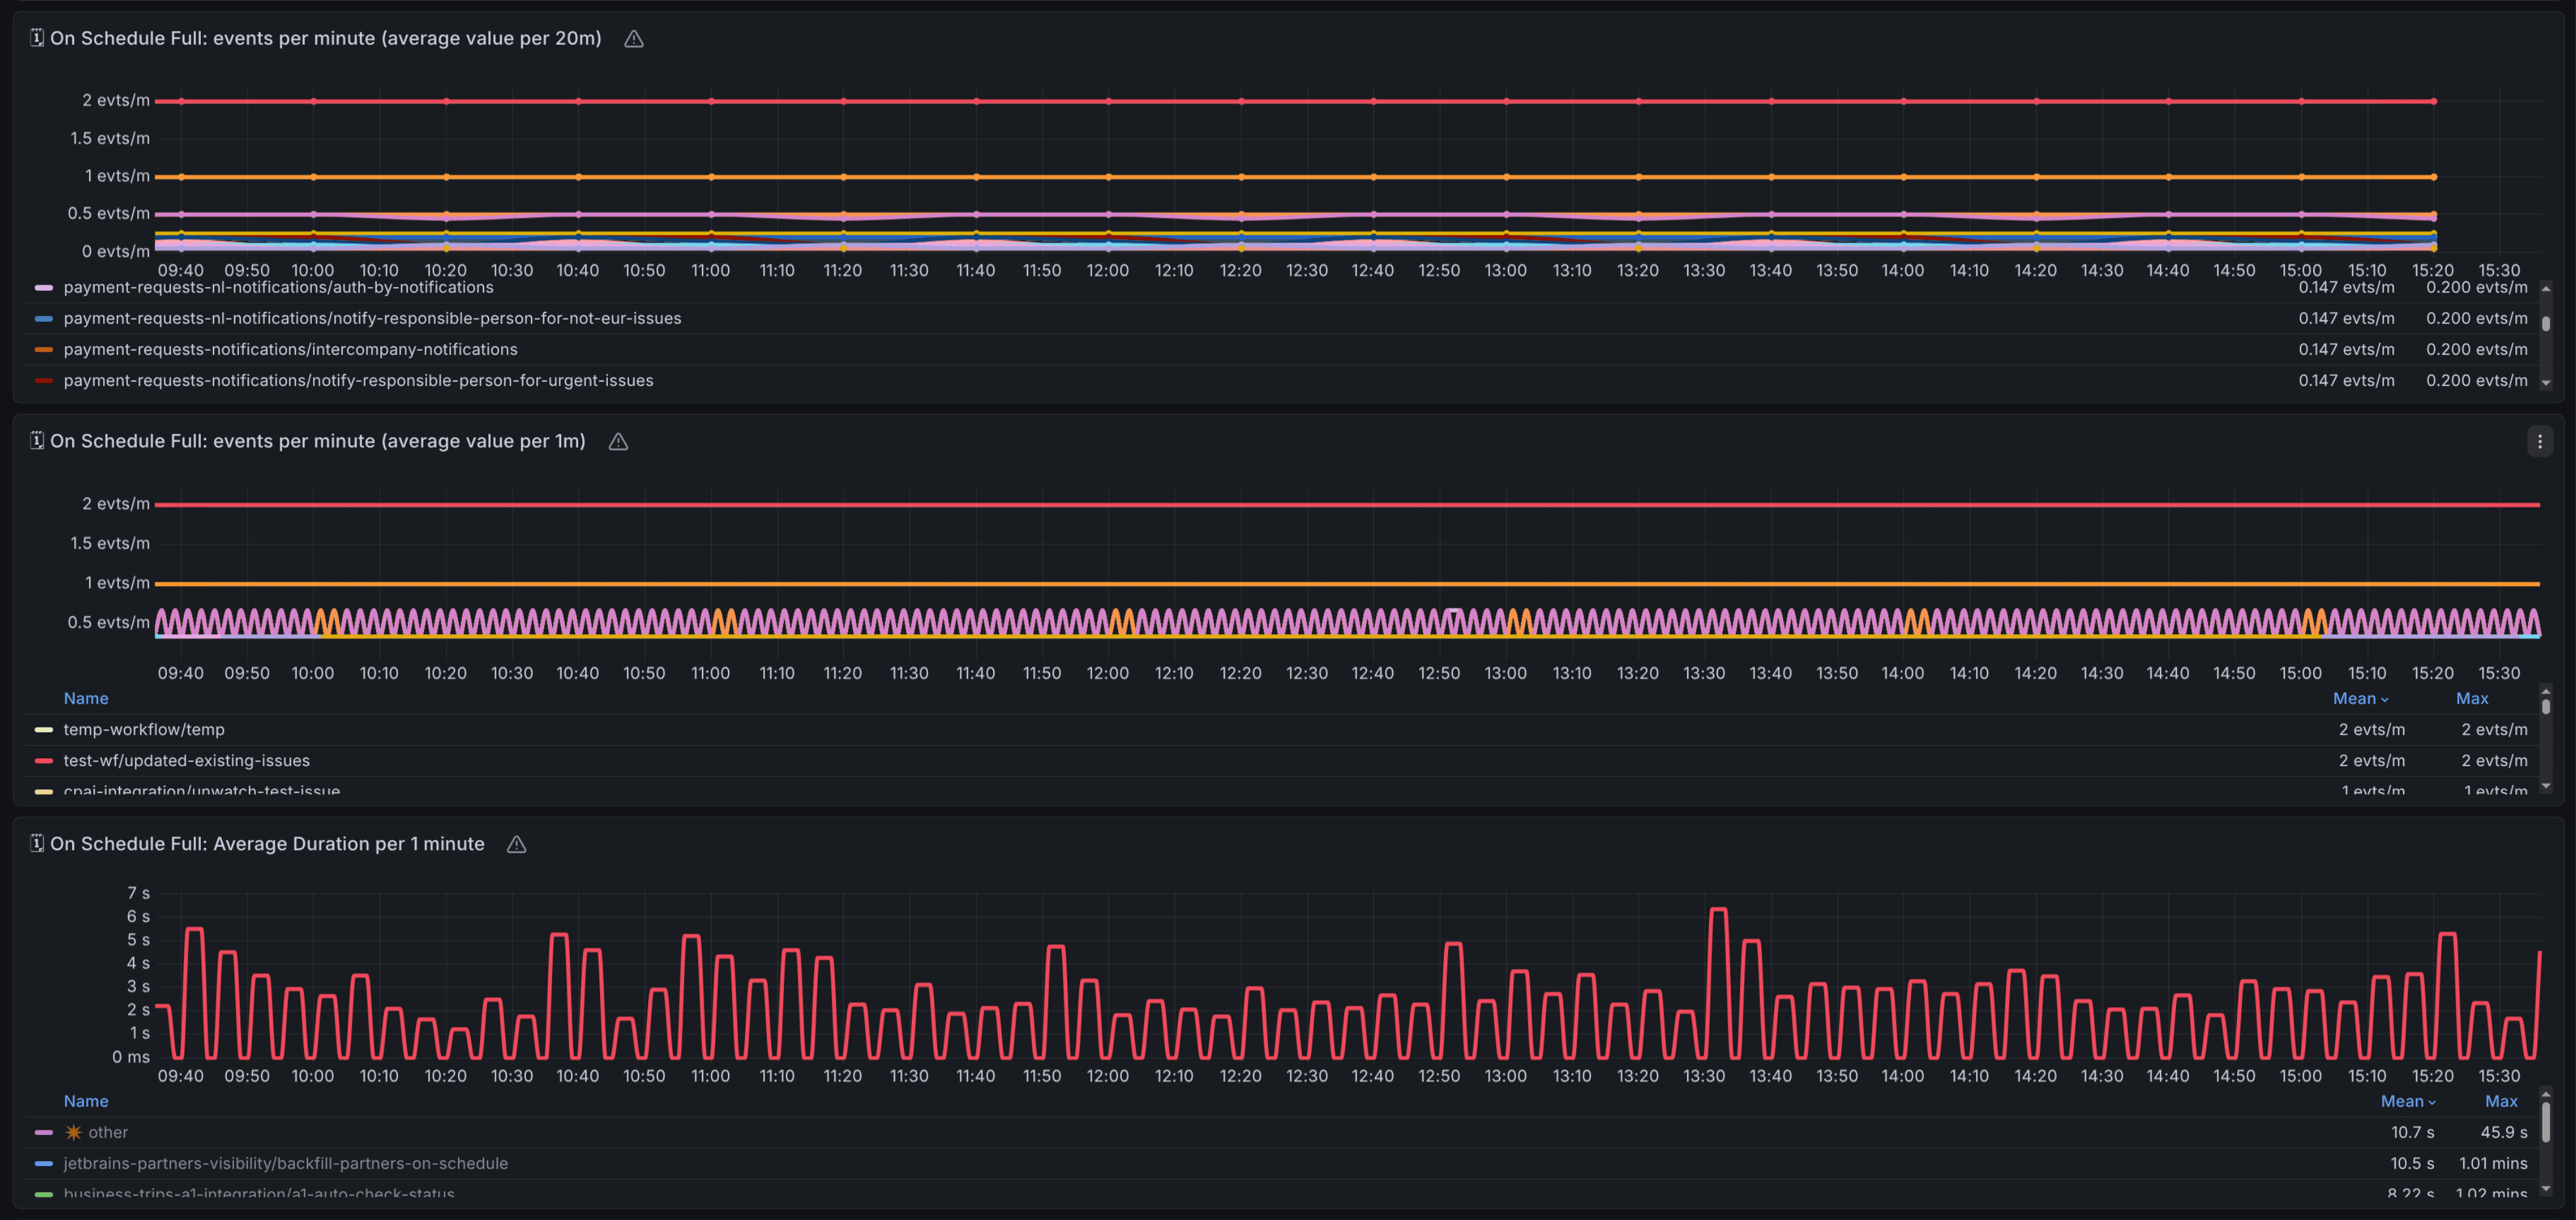
It takes top 20 app/workflow scripts by total duration. For on-schedule rules, it measures whole rule execution: search + script execution for each found issue.
Workflow Overview
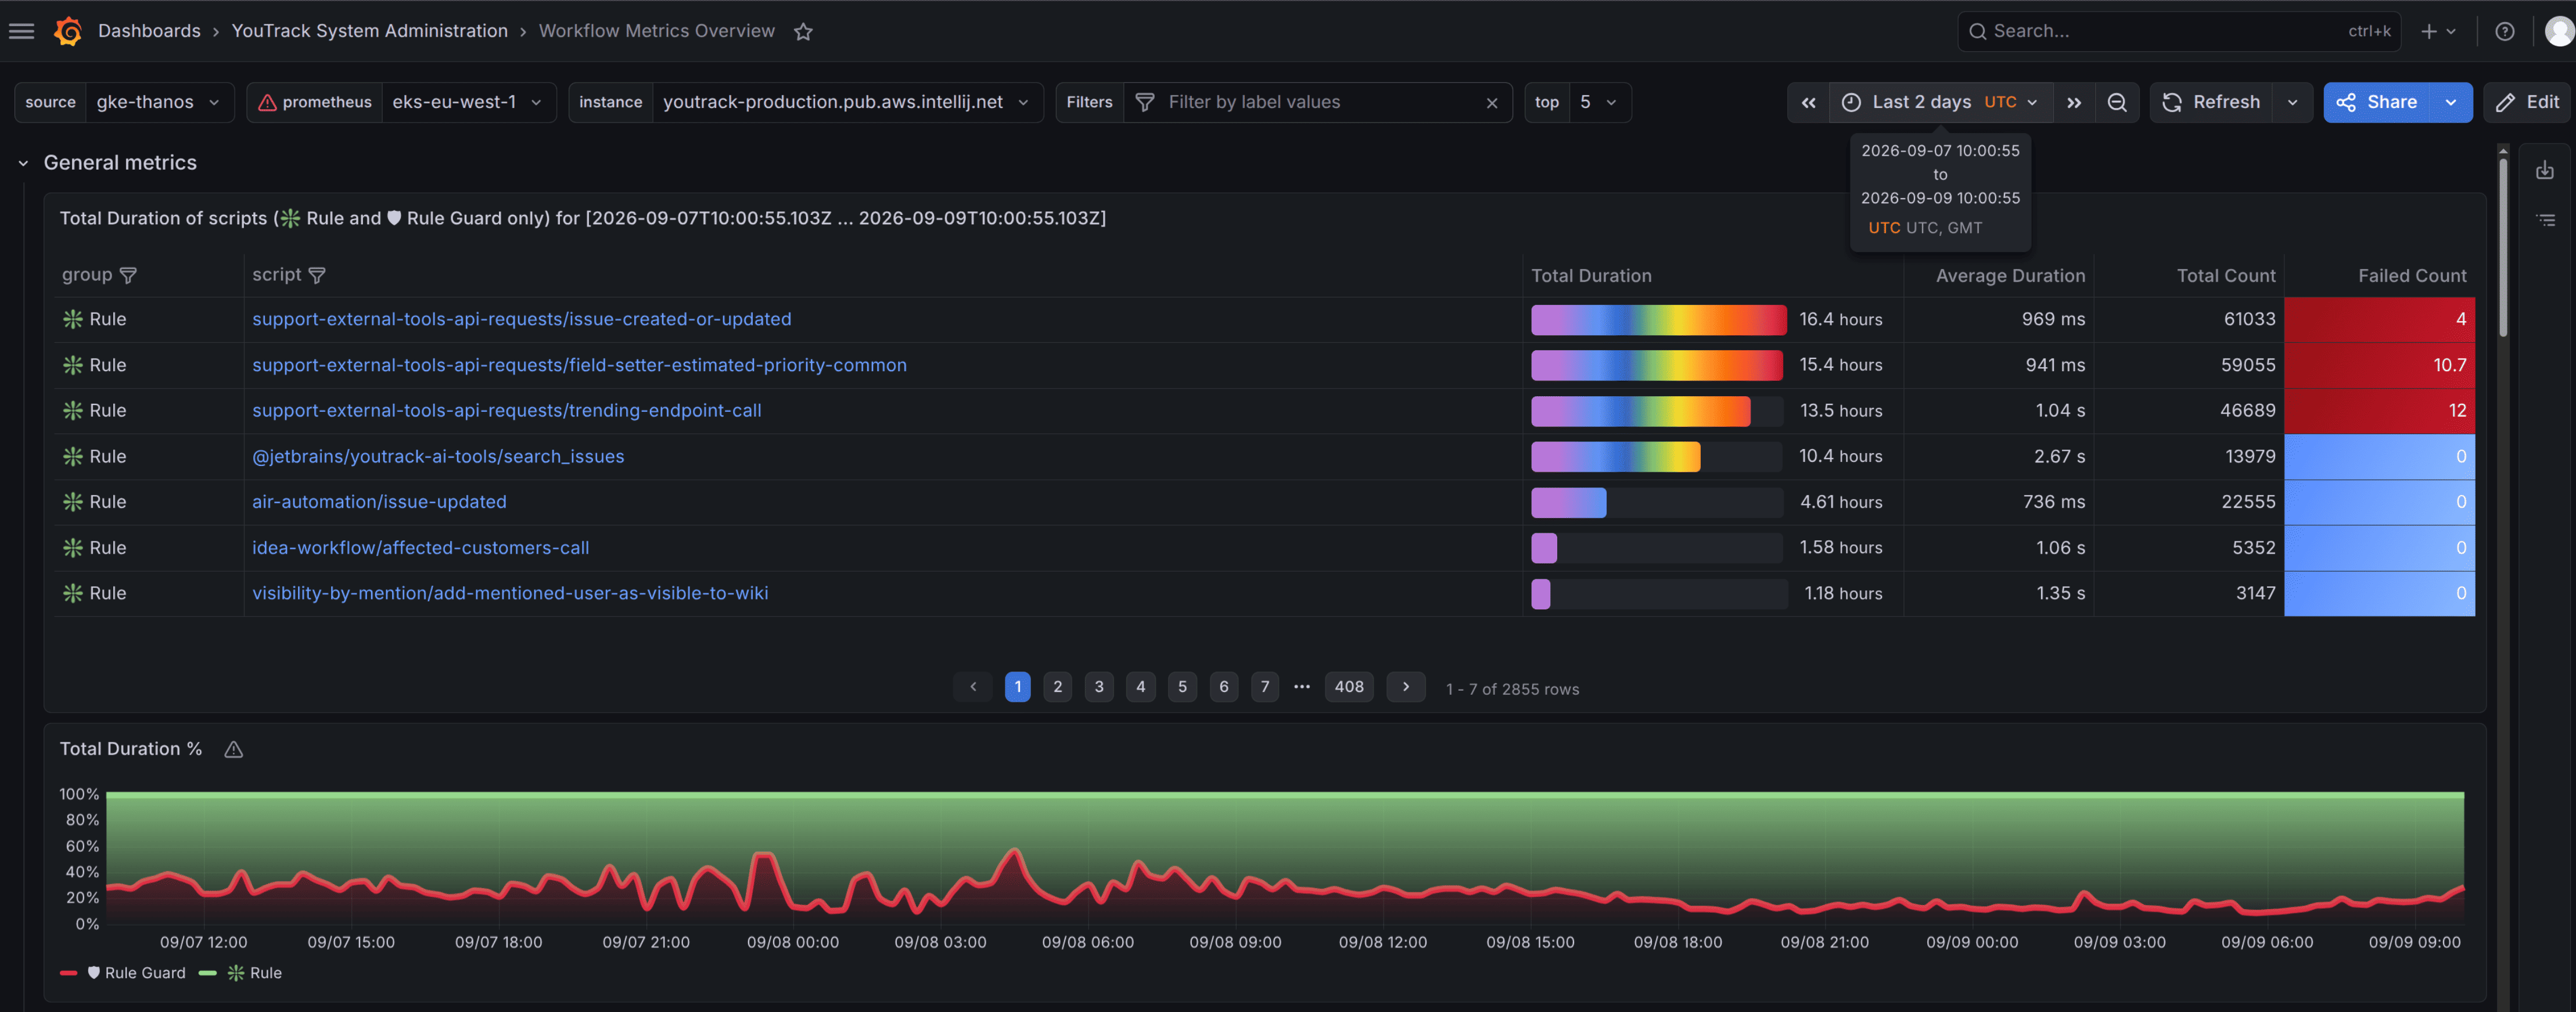
Per-script performance and reliability metrics for JetBrains YouTrack workflows. The dashboard answers three questions: which workflow scripts cost the most execution time, which ones fail, and how their duration and throughput change over time — for each of YouTrack's three workflow script types.
Metrics
The dashboard reads six workflow counters, in three script-type families:
| Metric | Meaning |
|---|---|
| youtrack_Workflow_Rule_TotalDuration | cumulative ms spent in ❇️ Rule scripts |
| youtrack_Workflow_Rule_TotalCount | cumulative ❇️ Rule executions |
| youtrack_Workflow_Rule_FailedCount | cumulative ❇️ Rule failures |
| youtrack_Workflow_RuleGuard_* | same three, for 🛡 Rule Guard scripts |
| youtrack_Workflow_OnScheduleFull_* | same three, for 🗓 On Schedule Full scripts |
Rows
| Row | Contents |
|---|---|
| General metrics | Two cross-type ranking tables (duration, count, average duration, failures per script) and a stacked Total Duration % chart comparing the three script types |
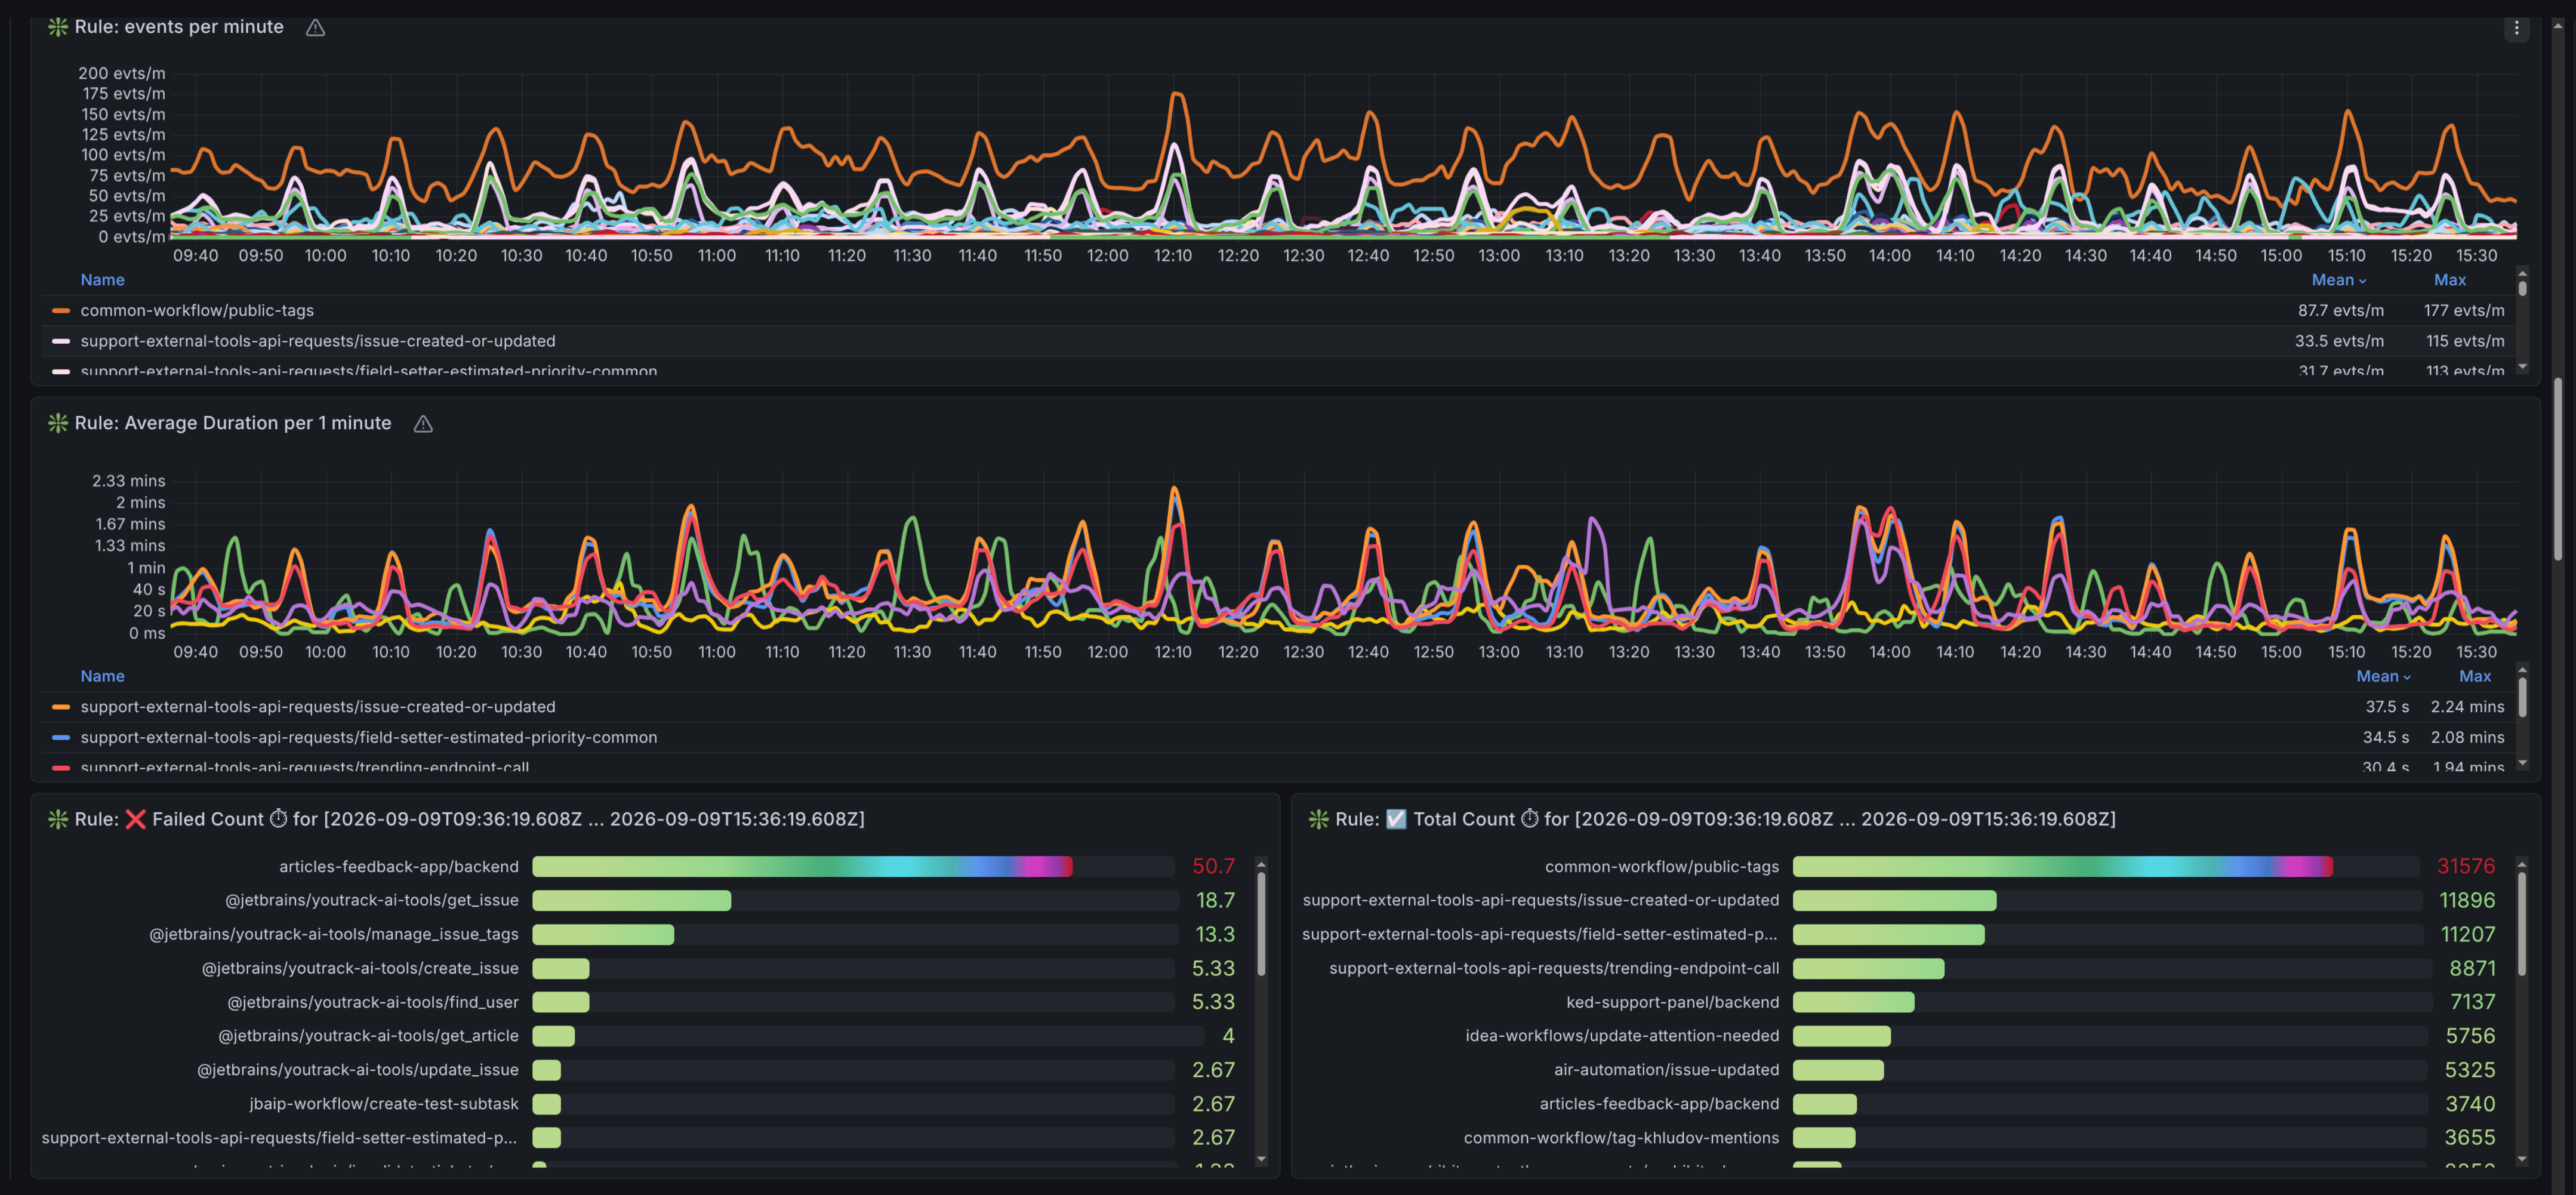
| ❇️ Rule | Ranking table, failure count, events per minute, average duration, plus range-total bar gauges for failed and total counts |
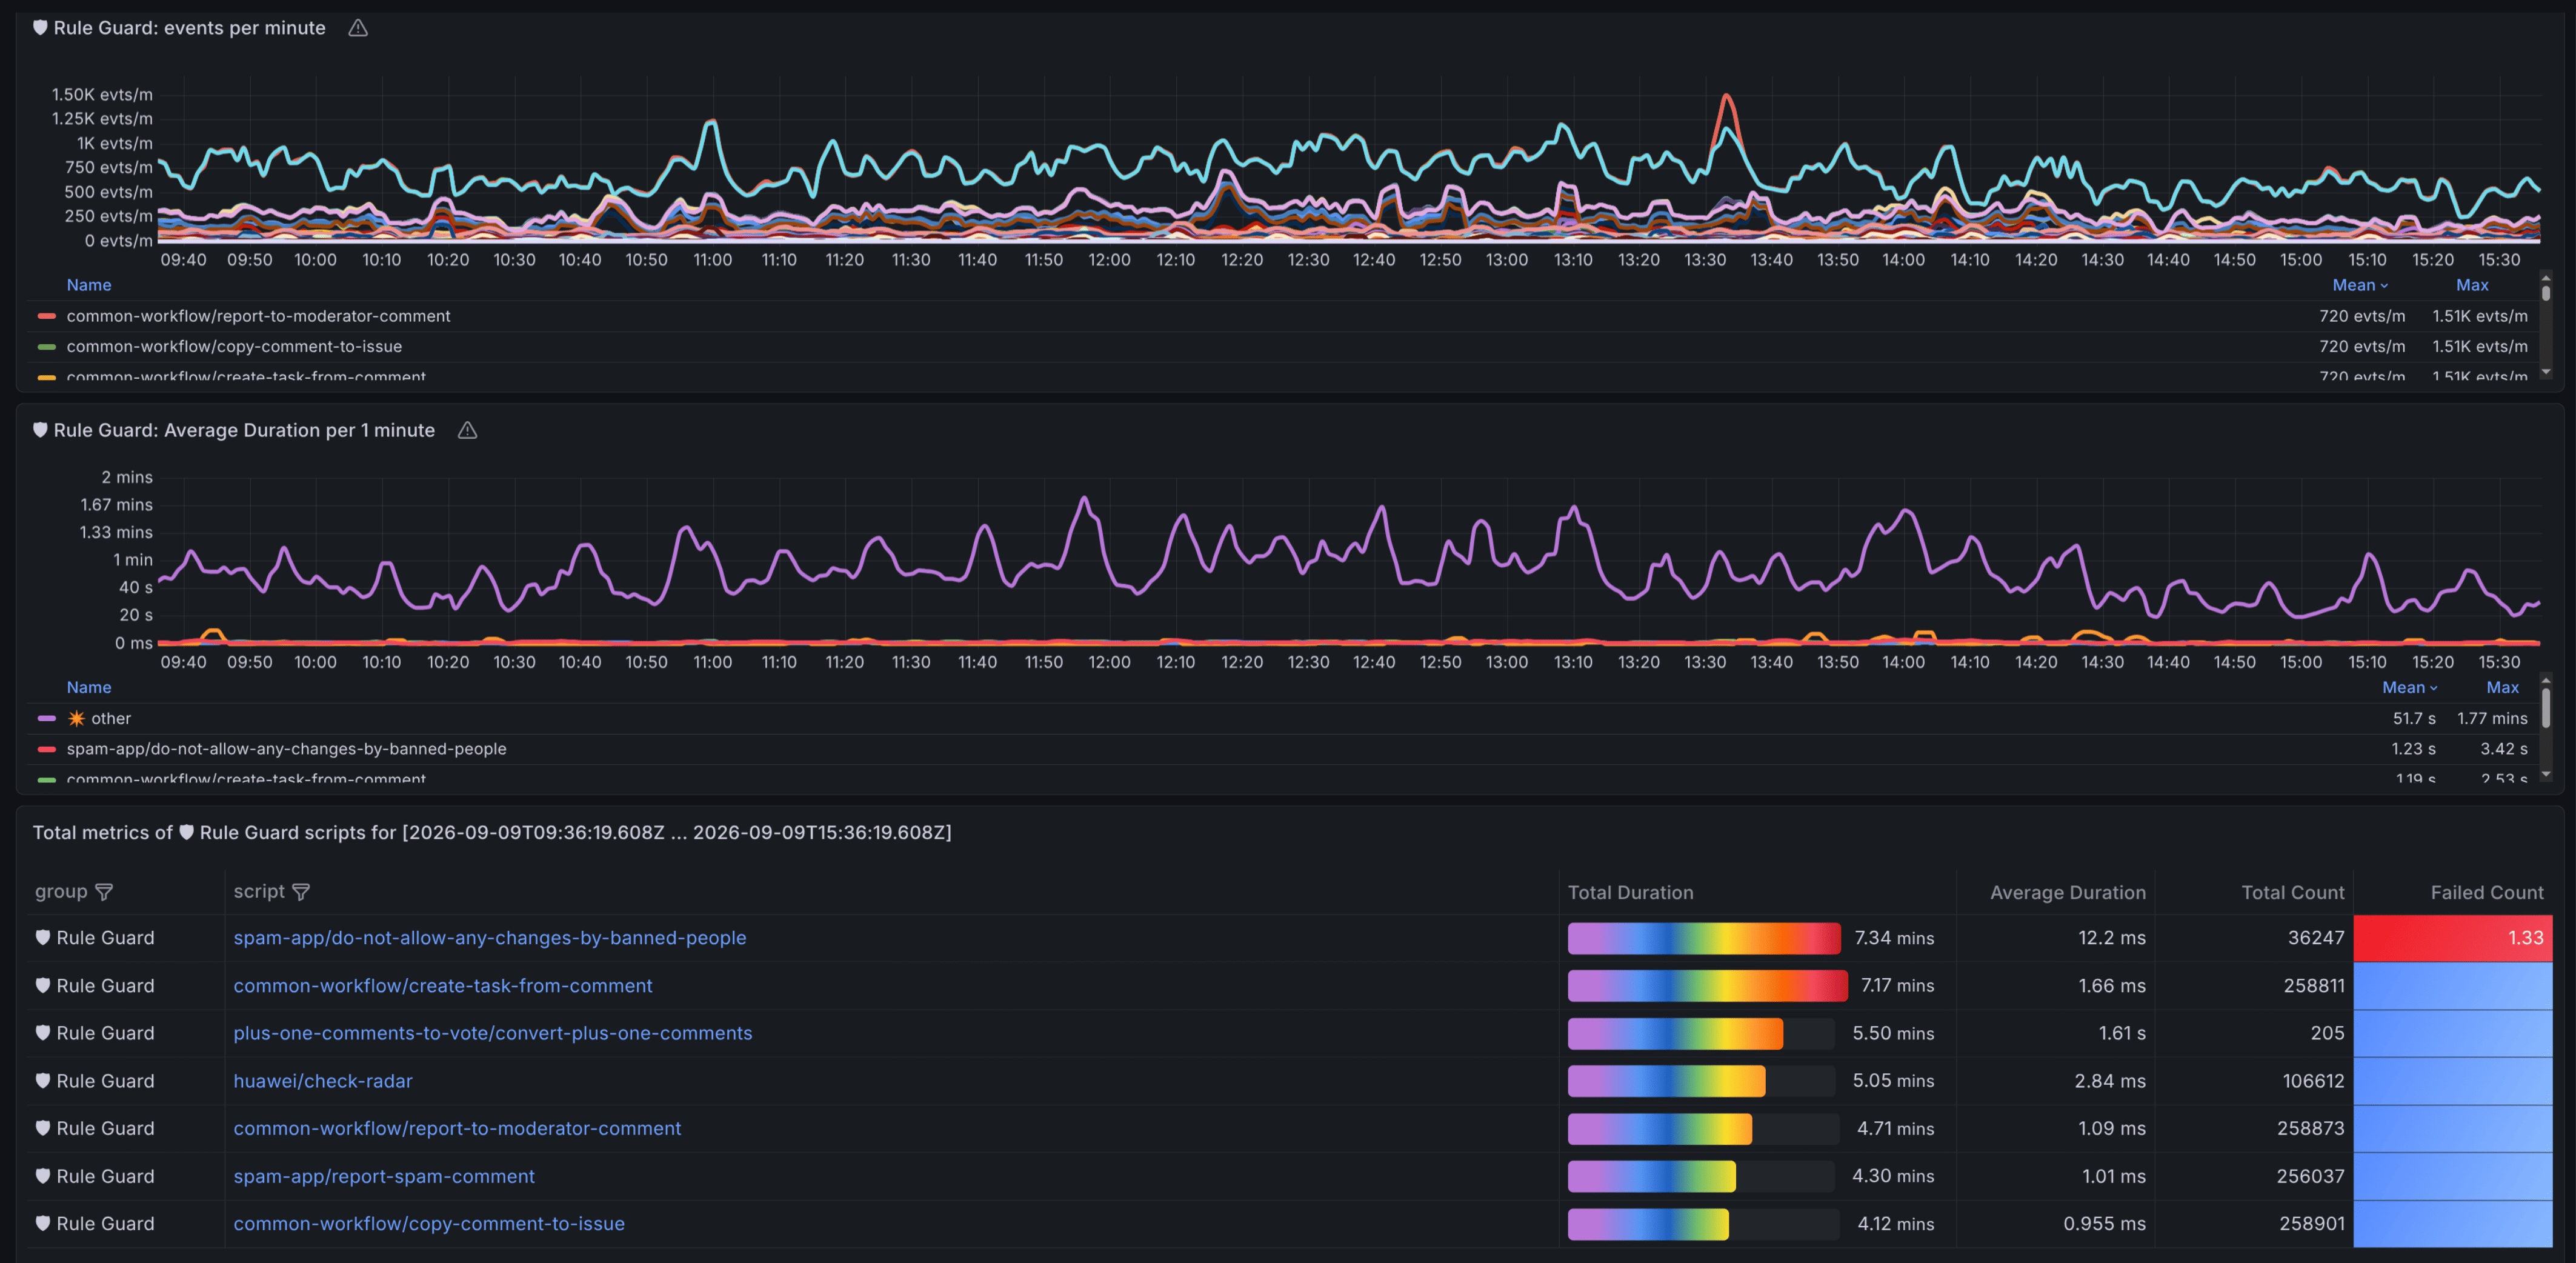
| 🛡 Rule Guard | Same six views for guard scripts |
| 🗓 On Schedule Full | Same views; for on-schedule rules the duration covers the whole rule execution — the issue search plus the script run for every issue found |
| App/Workflow Scripts | Raw cumulative Rule duration per script since application start |
| Workflow Guards | Raw cumulative RuleGuard duration per script since application start |
| On-Schedule Rules | Raw cumulative OnScheduleFull duration and count per script |
Data source config
Collector type:
Collector plugins:
Collector config:
Revisions
Upload an updated version of an exported dashboard.json file from Grafana
| Revision | Description | Created | |
|---|---|---|---|
| Download |