
Cerbos PDP
Visualise your Cerbos Policy Decision Points performance.
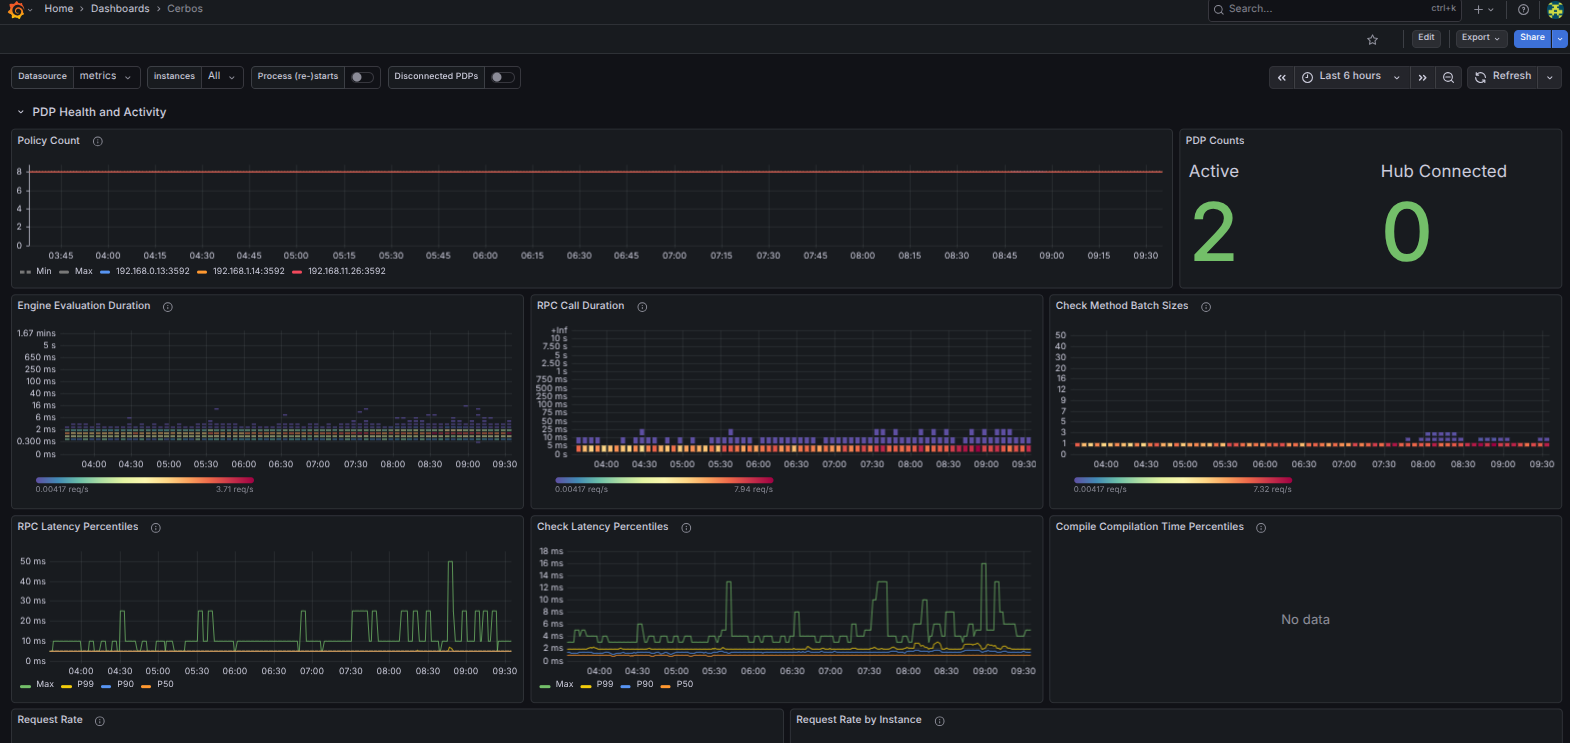
This dashboard visualises useful operational performance
metrics for the Cerbos PDP. It assumes you are collecting
the metrics with a per-instance instance label, and a
job=cerbos label. The data shown includes:
- Cerbos PDP health status and Cerbos Hub connectivity
- The loaded Cerbos Policy count in each instance
- Request, response and error rates, with histograms and percentiles
- A subset of Go useful runtime metrics
- CPU and Memory usage (including internal cache details
- Annotations to overlay instance restarts and Cerbos Hub disconnections
Data source config
Collector type:
Collector plugins:
Collector config:
Revisions
Upload an updated version of an exported dashboard.json file from Grafana
| Revision | Description | Created | |
|---|---|---|---|
| Download |