
Etcd Cluster Overview
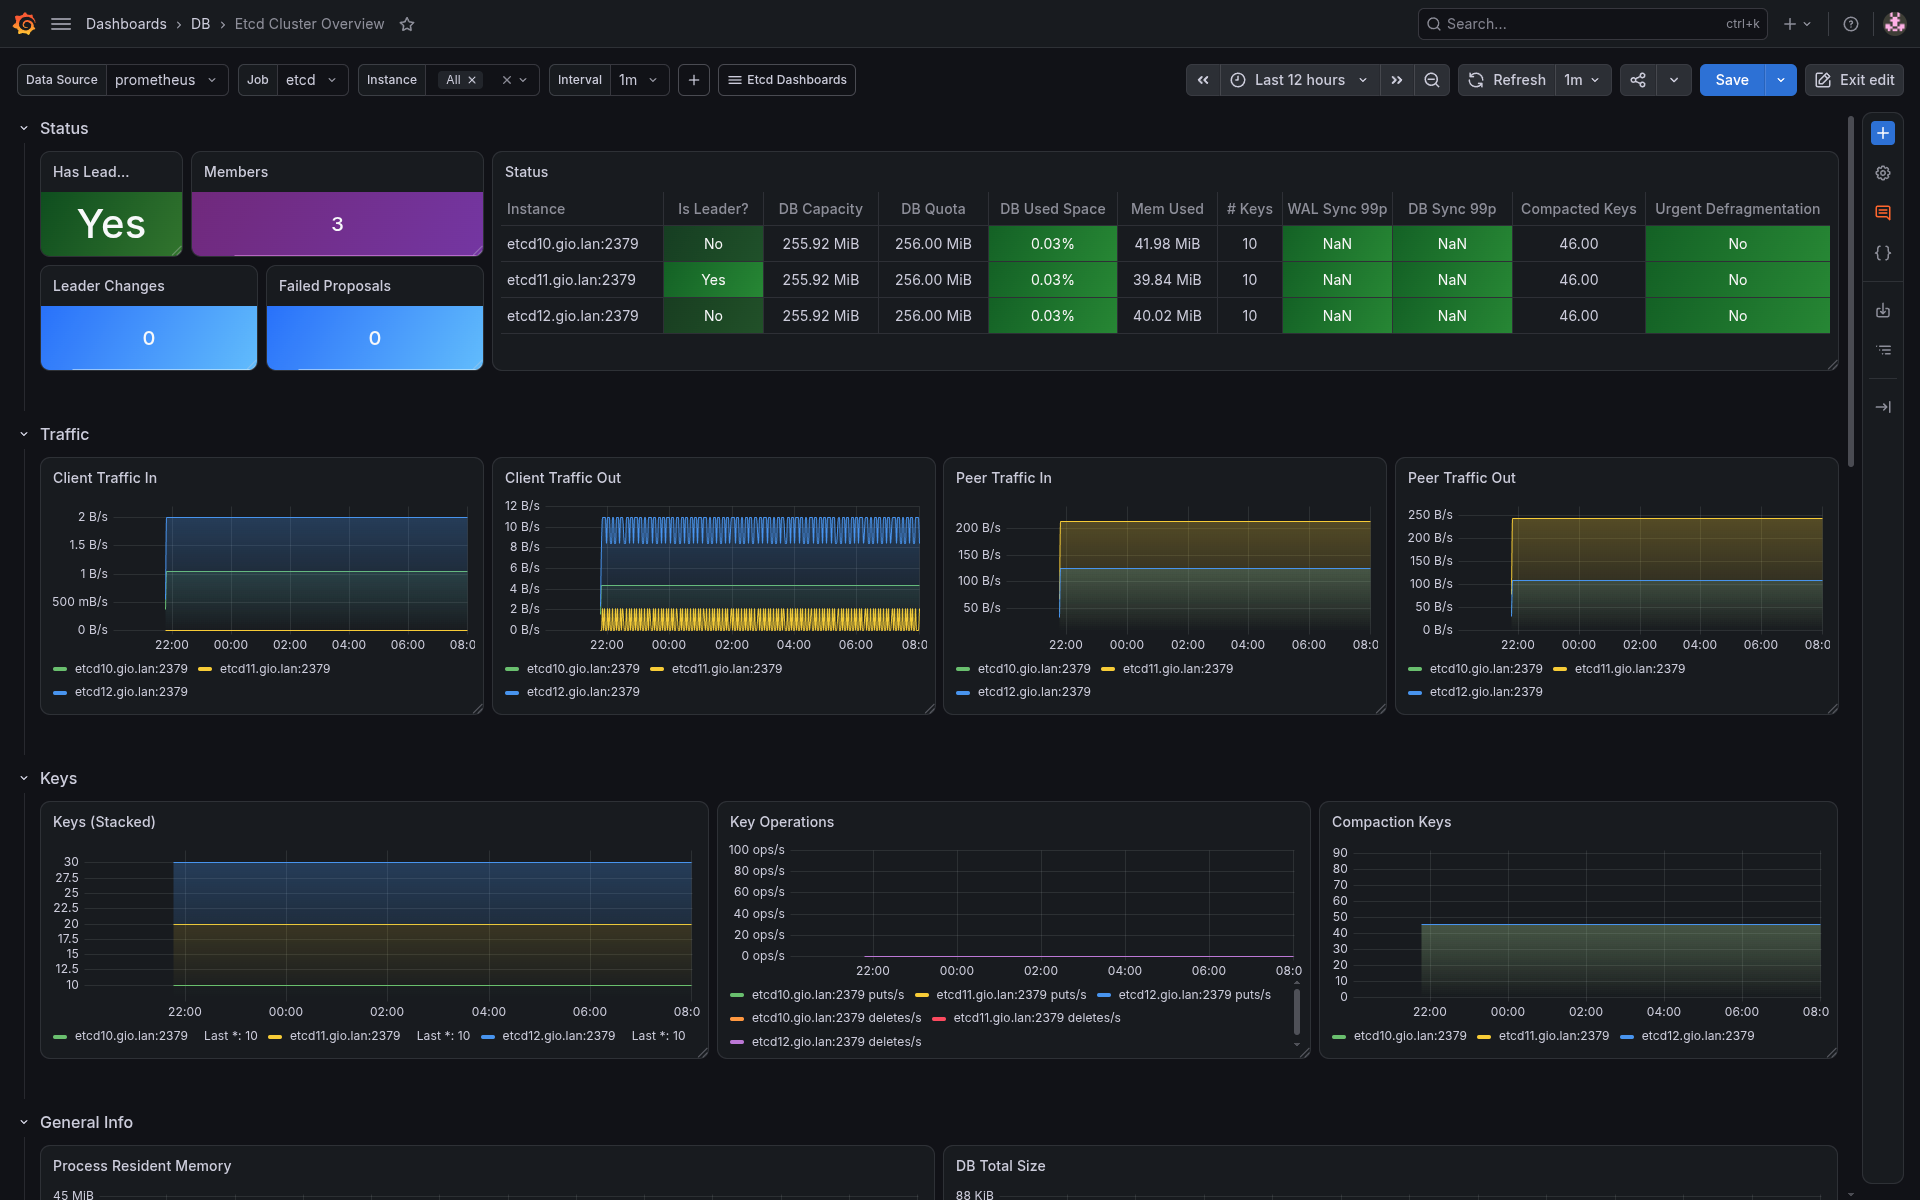
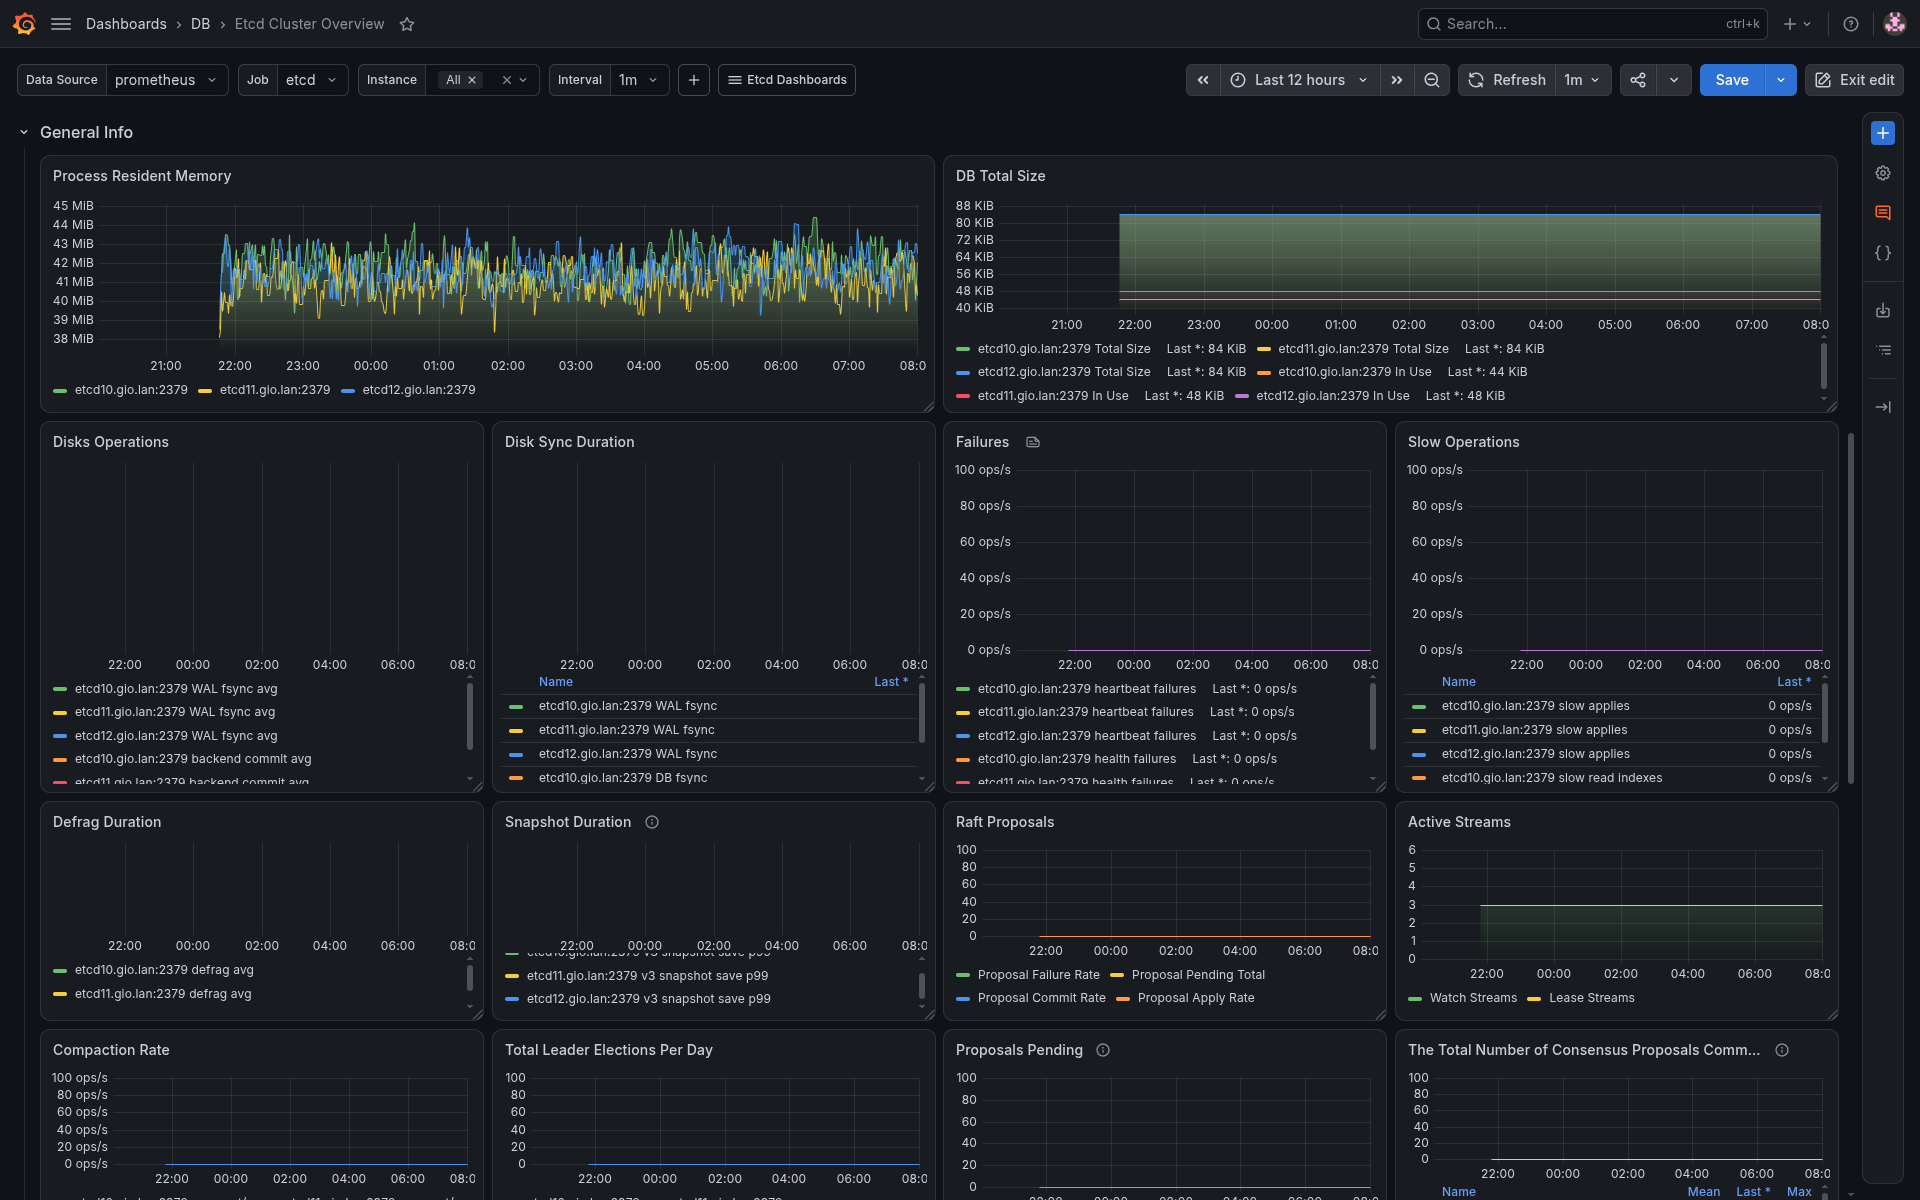
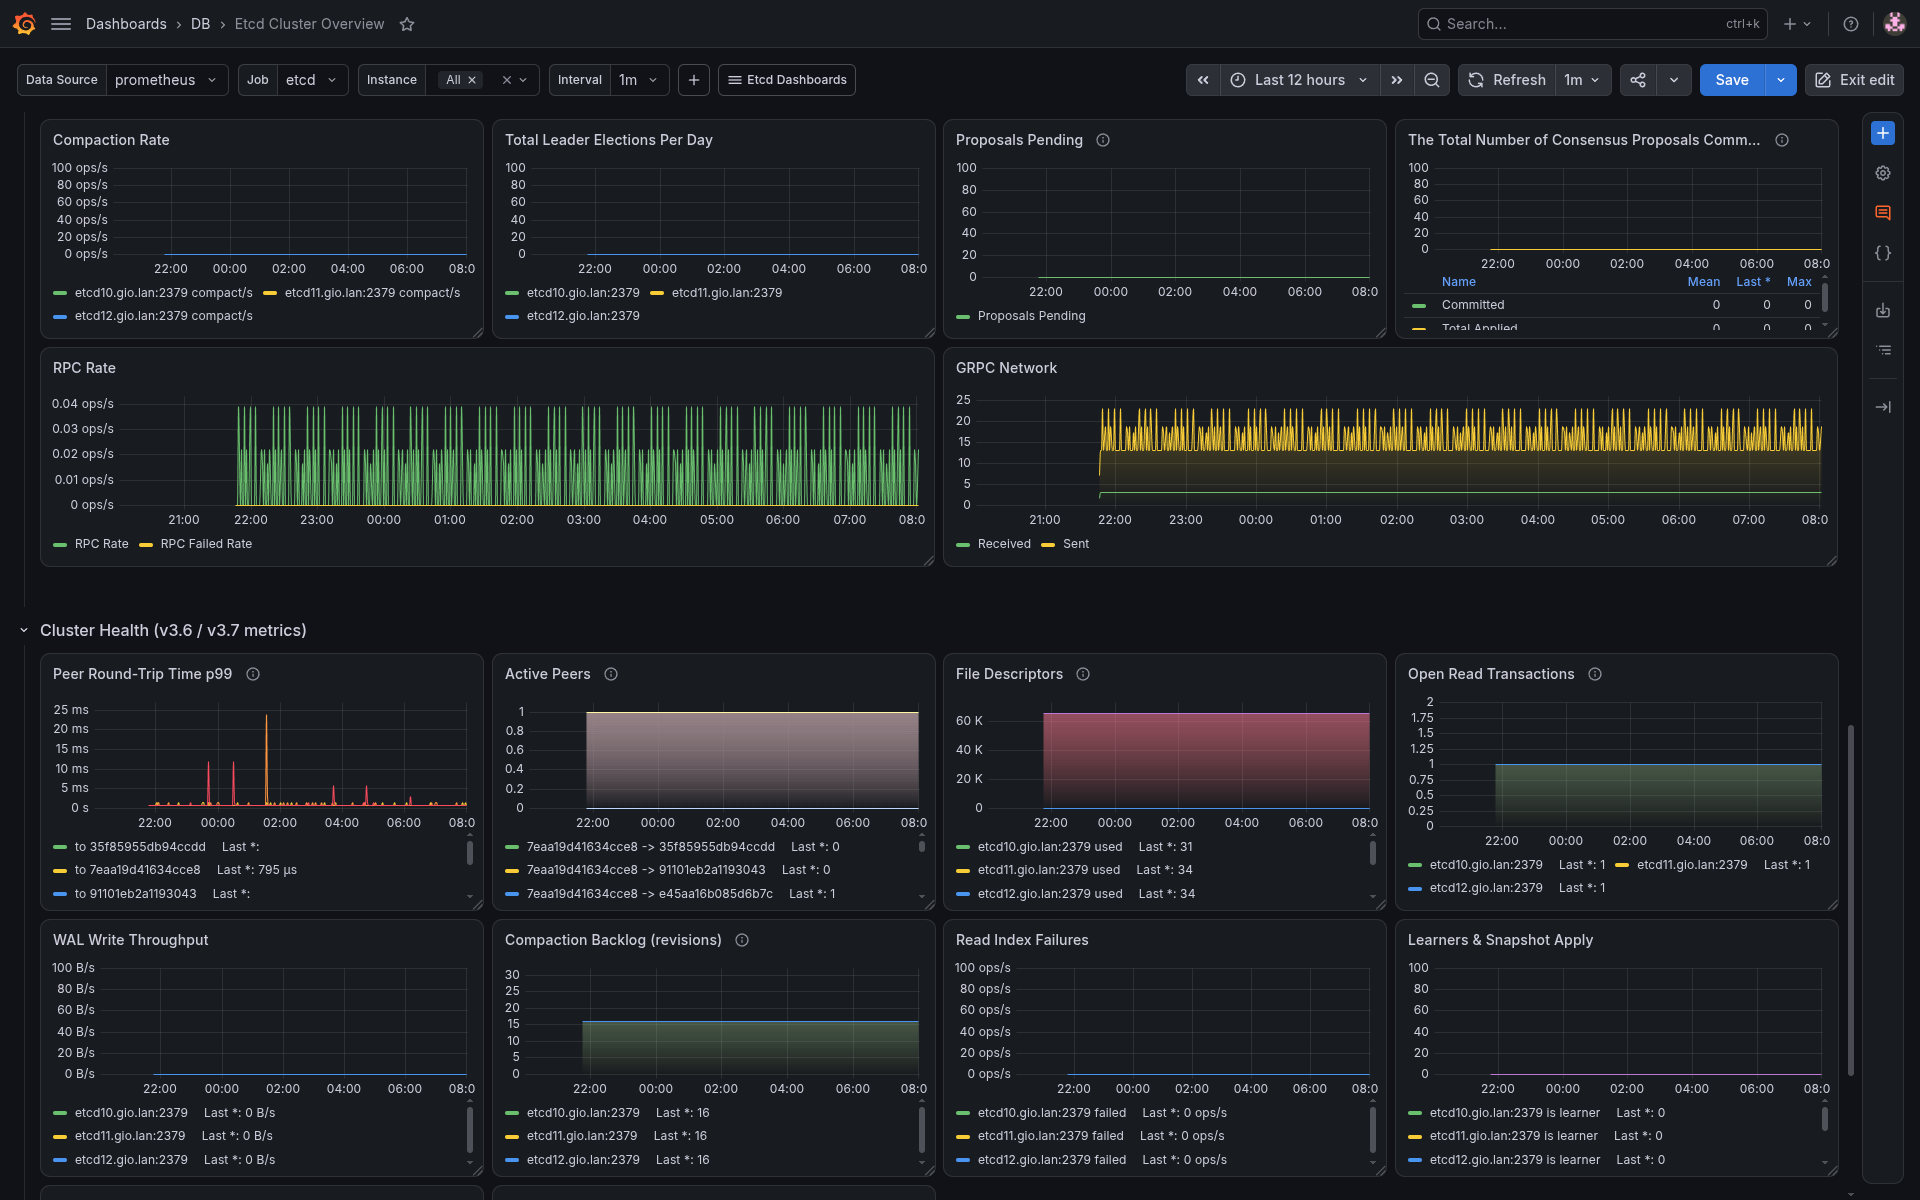
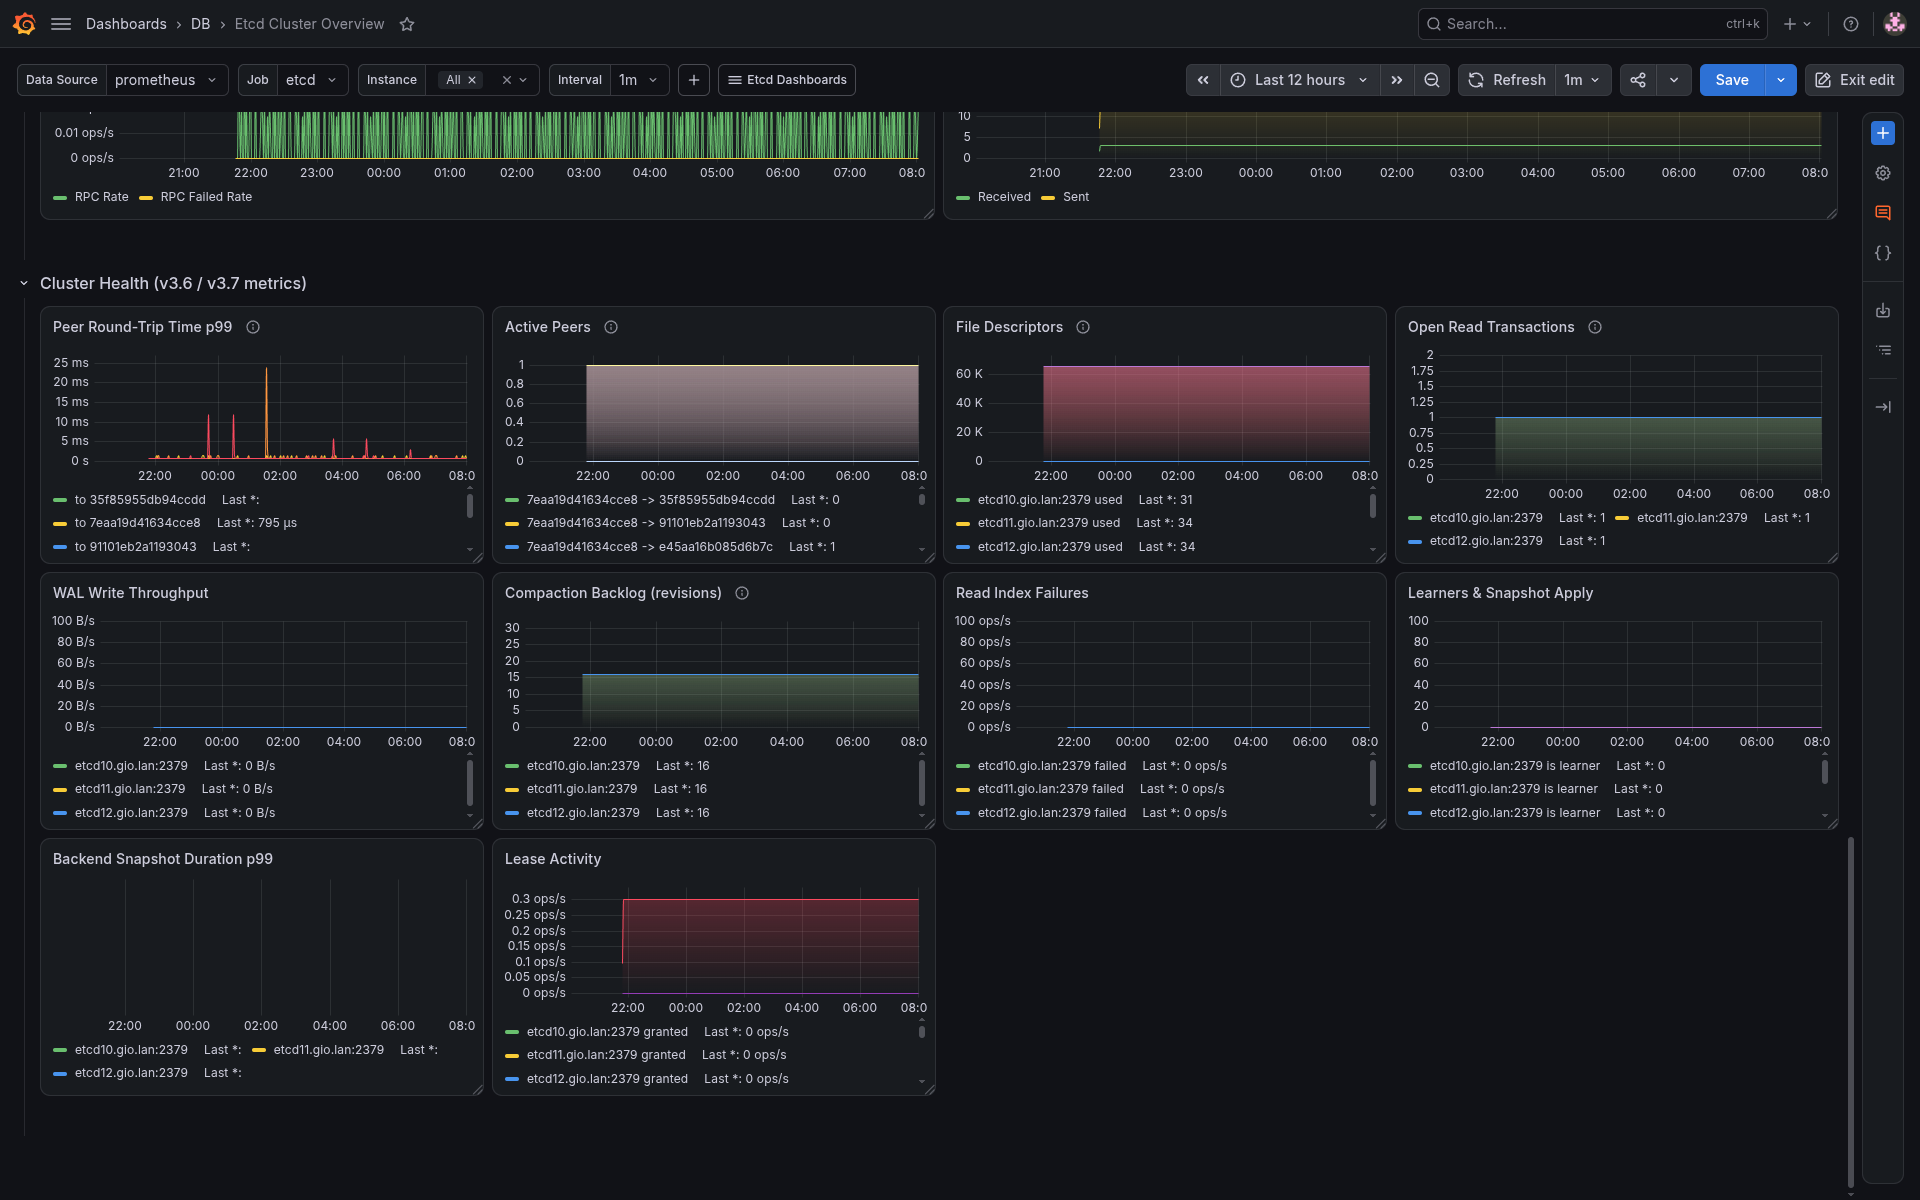
Etcd Cluster Overview showing details scraped from the etcd Prometheus metrics endpoint. Validated against etcd v3.7 metrics.
Where we starting from
This work starts from this dashboard https://grafana.com/grafana/dashboards/15308-etcd-cluster-overview/ we update it for etcd v3.7 with Opus 5.
Prometheus config
  - job_name: "etcd"
    scrape_interval: 15s
    metrics_path: /metrics
    static_configs:
      - targets: ['etcd10.gio.lan:2379', 'etcd11.gio.lan:2379', 'etcd12.gio.lan:2379']
Fix
Opus found the following erros from original dashboard:
Bugs
| # | Panel | Problem | Fix |
|---|---|---|---|
| 1 | 92 — Failed Proposals | Queries etcd_server_leader_changes_seen_total. Copy/paste from panel 91, so the panel shows a completely different metric than its title. | sum(etcd_server_proposals_failed_total{...}) |
| 2 | 90 — Has Leader | max(etcd_server_has_leader) stays green as long as one member sees a leader, hiding a member that has lost quorum contact. | min(etcd_server_has_leader{...}) |
| 3 | 74 — Status | Query J used format: "time_series" inside a table merge, producing the hardcoded column etcd_server_quota_backend_bytes{instance="poller01.tylephony.com:2379", job="etcd"} in the organize transform. The DB Quota column breaks on any other instance. | format: "table", rename Value #J → DB Quota |
| 4 | 74 — Status | Each instance rendered twice. merge joins frames on their shared fields. B/H/I return {instance, job}, C/D/E/F/G return {instance}, A/J return {instance, job, __name__}. Mismatched label sets cannot be joined, so merge emits a second row group. excludeByName runs after merge and only hides the columns. | Wrap all 10 queries in sum by (instance) (...) so every frame is {instance} + Value |
| 5 | 74 — WAL Sync 99p / DB Sync 99p | Thresholds set to 200 / 400 on a field whose unit is s. They would need 200 seconds of fsync latency to fire. | 0.2 / 0.4 |
| 6 | 74 — WAL Sync 99p / DB Sync 99p | NaN on a low-traffic cluster: no WAL fsync occurs inside a short rate window, and histogram_quantile over an all-zero rate is NaN. Correct behavior, bad UX for an instant status table. | Use [$__range] so the panel spans the dashboard time window |
| 7 | 19 — Total Leader Elections Per Day | changes() counts value transitions, not magnitude. Undercounts when a counter jumps by more than 1 and misreads restarts. | increase(...[1d]) |
| 8 | 7, 56, 9 | rate(x_sum[1m]) is seconds-of-work per second — a dimensionless ratio — but the panel unit is s. | rate(_sum[...]) / rate(_count[...]) for a mean duration, or histogram_quantile on _bucket |
| 9 | 9 — Snapshot Duration | etcd_debugging_snap_save_total_duration_seconds is the v2 store snapshot path. v2store was removed in etcd 3.6, so this panel is empty on 3.6+. | etcd_snap_db_save_total_duration_seconds (v3 snapshot save) |
| 10 | 60, 62 | Raw counters plotted directly render as flat monotonic lines. Useless for spotting new failures or slow applies. | rate(...[$__rate_interval]), unit ops |
| 11 | 52 — Key Operations | etcd_debugging_mvcc_put_total / _delete_total still work but were promoted to stable names. | etcd_mvcc_put_total / etcd_mvcc_delete_total |
| 12 | all | Rate windows hardcoded to [5m] / [1m] while an $interval variable exists. Breaks at long time ranges and at scrape intervals above 1m. | [$__rate_interval] (leave the intentional [1d] in panel 19) |
| 13 | 93 — Members | sum(etcd_server_id) happens to give the right answer only because the gauge value is always 1. Fragile and unclear. | count(etcd_server_id{...}) |
| 14 | all | Legacy Grafana 6/7 query keys (metric, step, intervalFactor) carry no meaning in schema v2. | Strip |
Non-blocking observations
- Panels 2 and 40 both plot proposal commit/apply rates. Redundant.
- Panel 74 queries B and H are byte-identical; both are kept only because
they drive different field overrides (
DB Used SpacevsUrgent Defragmentation). - Panels 58, 48, 54, 74 depend on
etcd_debugging_mvcc_keys_totalandetcd_debugging_mvcc_db_compaction_keys_total. No stable equivalent exists, so they must stay on theetcd_debugging_prefix — which upstream explicitly documents as volatile and removable without notice.
Metrics available in v3.7 but not on the original dashboard
| Metric | Why it matters |
|---|---|
etcd_network_peer_round_trip_time_seconds | Best early warning for leader elections. Highest-value omission. |
etcd_network_active_peers | Should equal members - 1 per node; drops indicate a partition. |
os_fd_used / os_fd_limit | etcd panics when it cannot create new WAL files. |
etcd_mvcc_db_open_read_transactions | Long-lived read txns block defragmentation and grow the freelist. |
etcd_disk_wal_write_bytes_total | WAL write throughput. |
etcd_debugging_mvcc_current_revision − etcd_debugging_mvcc_compact_revision | Compaction backlog; steady growth means compaction is falling behind. |
etcd_server_read_indexes_failed_total | Linearizable read failures. |
etcd_server_is_learner | Learner members are invisible on the current dashboard. |
etcd_server_snapshot_apply_in_progress_total | Explains latency spikes during member catch-up. |
etcd_disk_backend_snapshot_duration_seconds | v3 backend snapshot latency. |
etcd_debugging_lease_{granted,renewed,revoked}_total, etcd_debugging_server_lease_expired_total | Lease churn, common source of load in Kubernetes clusters. |
More info
GitHub repository of this dashboard with more informations at https://github.com/Axiumine/Grafana-Etcd-Cluster-Overview
Data source config
Collector type:
Collector plugins:
Collector config:
Revisions
Upload an updated version of an exported dashboard.json file from Grafana
| Revision | Description | Created | |
|---|---|---|---|
| Download |

etcd

Easily monitor etcd, a distributed key-value store, ewith Grafana Cloud's out-of-the-box monitoring solution.
Learn more