
RustFS Overview (OTLP via OpenTelemetry Collector)
Cluster overview for RustFS object storage. RustFS has no native /metrics endpoint — metrics are pushed via OTLP to an OpenTelemetry Collector and scraped from there. Built and verified against RustFS 1.0.0-beta.12 with 276 exposed metrics. Read the README before importing: the metric prefix is configurable and panels will show No data if yours differs.
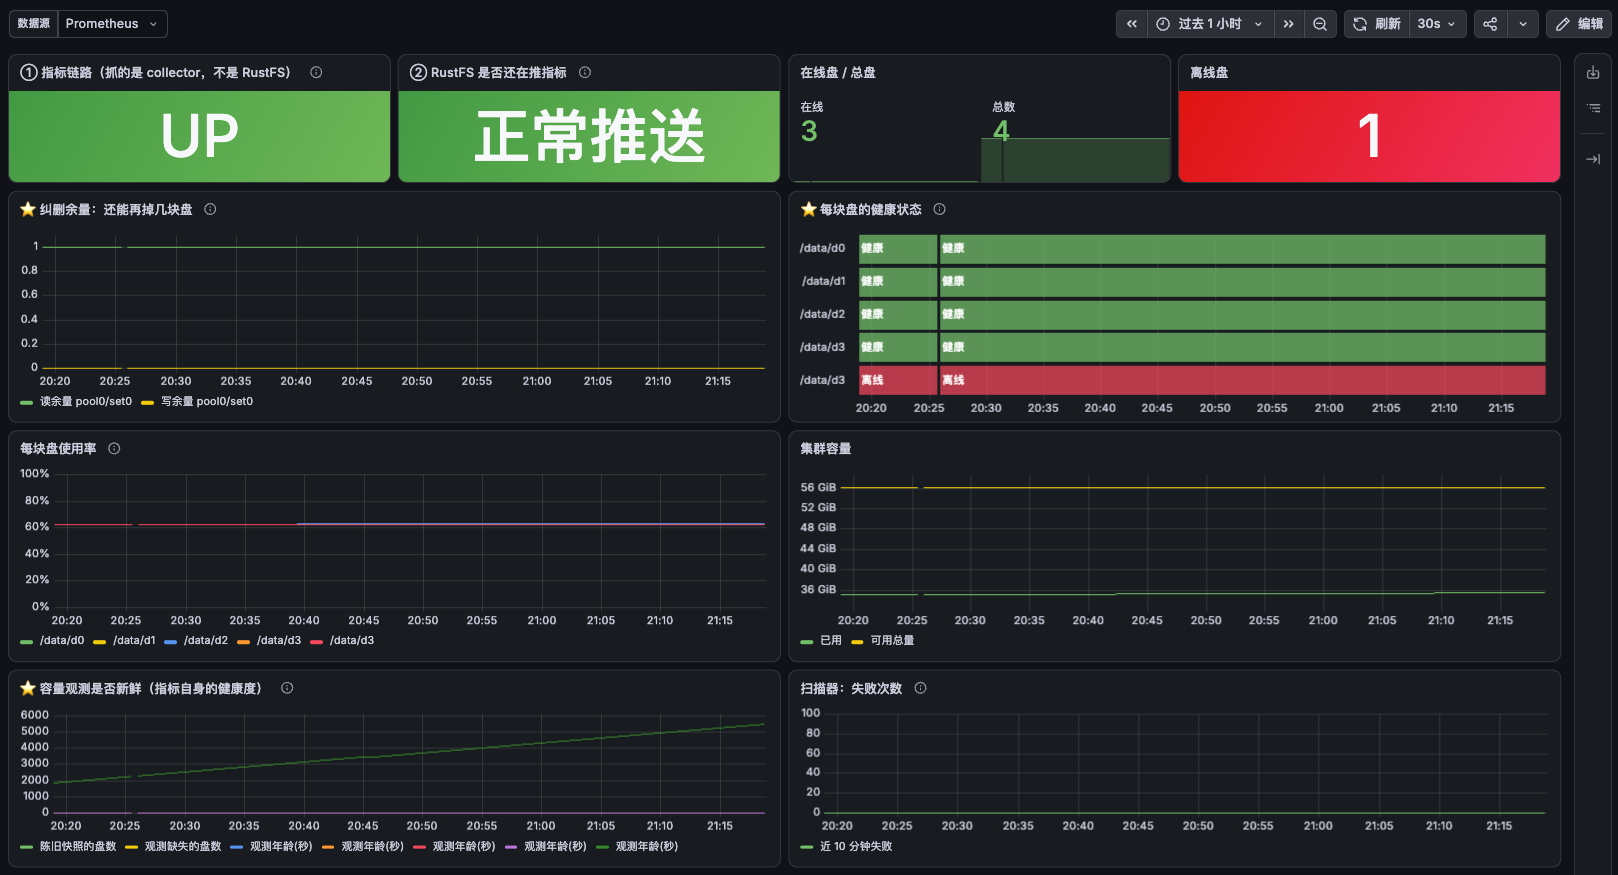
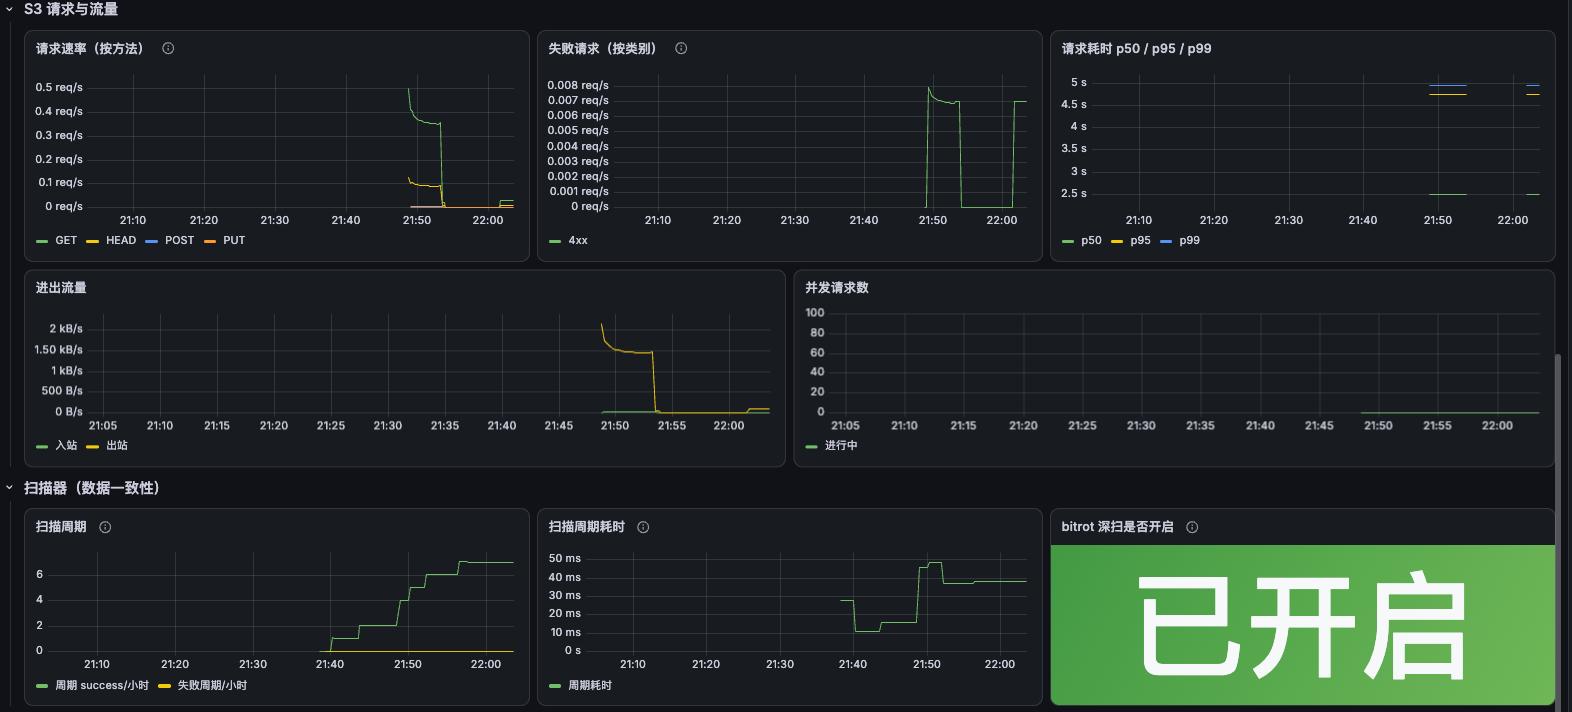
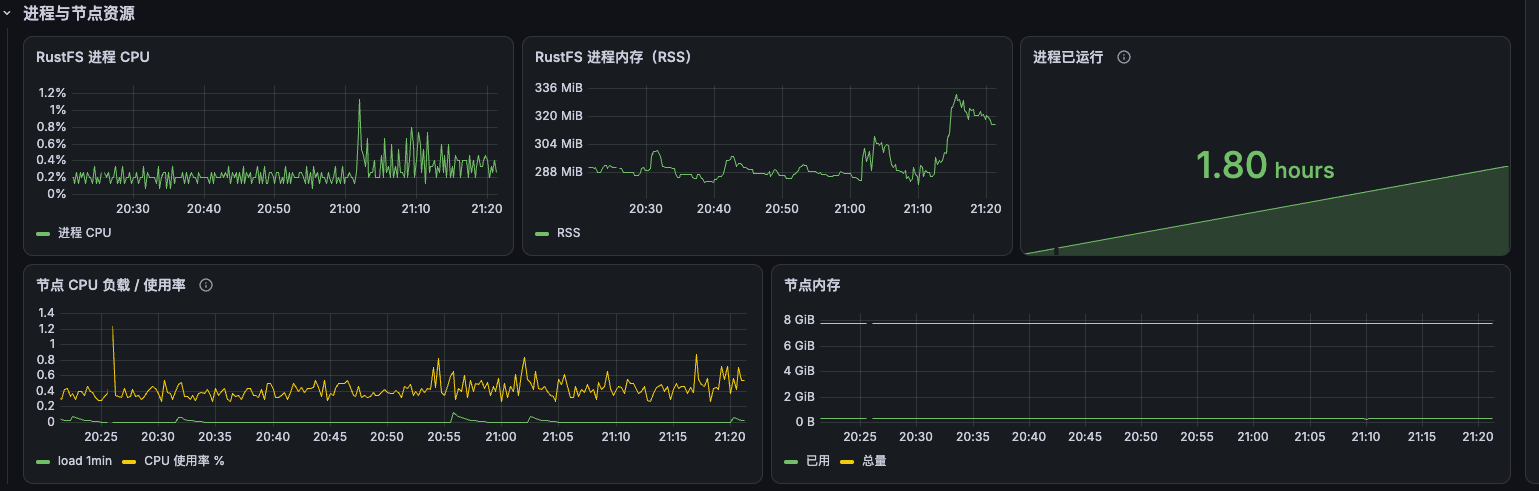
⚠️ Before you import
RustFS does not expose a native Prometheus /metrics endpoint, and this is intentional — a PR adding one (rustfs/rustfs#3082) was closed in favour of OpenTelemetry. Metrics reach Prometheus through an extra hop:
MinIO   :  Prometheus ──scrape──▶ MinIO /minio/v2/metrics/*        (1 hop)
RustFS  :  RustFS ──OTLP push──▶ otel-collector ──:8889──▶ Prometheus   (2 hops)
🔴 The metric prefix is configurable — check yours first
This is the #1 reason panels show No data. RustFS lets you change the metric name prefix, so the names in this dashboard may not match your deployment. Verify before importing:
count({__name__=~"rustfs.*"}) by (__name__)
If your metrics use a different prefix, either align the prefix in RustFS config or do a find-and-replace in the dashboard JSON.
Setup
1) RustFS — enable OTLP export
environment:
  RUSTFS_OBS_ENDPOINT: http://otel-collector:4318   # OTLP/HTTP
2) OpenTelemetry Collector — expose a Prometheus endpoint
receivers:
  otlp:
    protocols:
      http:
        endpoint: 0.0.0.0:4318
exporters:
  prometheus:
    endpoint: 0.0.0.0:8889
service:
  pipelines:
    metrics:
      receivers: [otlp]
      exporters: [prometheus]
3) Prometheus — scrape the collector, not RustFS
scrape_configs:
  - job_name: rustfs
    static_configs:
      - targets: ['otel-collector:8889']
Known pitfalls (learned the hard way)
Three metrics do not mean what their names suggest. If you build alerts on them without checking, you get rules that never fire:
| Metric | What it is not | What it actually is |
|---|---|---|
rustfs_cluster_capacity_missing_drives | Not "drives that went offline" | Drives with missing capacity observations (HELP: "Count of drives with missing capacity observations"). It is about observability freshness, not disk failure |
rustfs_cluster_capacity_stale_drives | Not "stale data on disk" | Drives whose capacity metrics are served from stale snapshots. When either of these is > 0, your capacity alerts are judging on old input |
rustfs_system_drive_health | Does not detect a node going down, and does not reflect data loss | Reports per-drive path health. Verified in a 4-node drill: after stopping one node, the three surviving nodes still reported its drive as 1 — not a single 0. Deleting data underneath also leaves it untouched |
rustfs_cluster_erasure_set_write_tolerance | Not remaining headroom | A static value derived from the EC config. Verified: it stayed at 1 while online_drives_count fell 4 → 3. An alert watching it will never fire |
⭐ The only metric that reacted to a node going down was rustfs_cluster_erasure_set_online_drives_count (4 → 3). Compute headroom yourself instead of trusting a *_tolerance metric:
# write headroom = online - write quorum
rustfs_cluster_erasure_set_online_drives_count
  - (rustfs_cluster_erasure_set_size - rustfs_cluster_erasure_set_parity + 1)
Also worth knowing:
- 🔴 Series amplification in clusters: every node reports every drive, so the series carry both
exported_job(who is reporting) andserver(whose drive it is). Measured on a 4-node cluster: 16 series for 4 physical drives. De-duplicate or one failed drive fans out into four alerts:
For the same reason, joins likemin by (server, drive) (rustfs_system_drive_health) == 0and on(pool_id, set_id)will match across nodes (every node reportspool_id="0",set_id="0") — addexported_jobto theon()clause. - Metric convergence is slower than the failure. Measured:
online_drives_counttook ~40s to reflect 4 → 3, but close to 2 minutes for 3 → 2. Afor: 5malert stayed in pending for an entire 4-minute outage and never fired. Replay what actually fired with the built-inALERTSseries:ALERTS - The extra hop is a blind spot: if the collector dies, Prometheus still scrapes it happily — you get absent metrics rather than a down target. Alert on collector liveness separately (
absent()/up). - Panel-level check before you trust it:
rustfs_http_server_requests_totalcarries only amethodlabel (nostatus). Grouping by a label that does not exist silently degrades to a single series namedValueinstead of erroring.
Tested with
| RustFS | 1.0.0-beta.12 (image latest at the time; 276 metrics exposed) |
| Topologies | Single node / 4 drives and 4-node cluster / 1 drive each (size=4, parity=2) |
| Drills | Drive pull, data deletion, node stop/restart, full recovery |
| Pipeline | OTLP/HTTP → OpenTelemetry Collector (:8889) → Prometheus |
| Grafana | 11.6.0 |
⚠️ RustFS marks distributed mode as still under testing upstream — single-node is the supported path today. The cluster panels here work, but do not read this dashboard as an endorsement of running RustFS clusters in production.
Metric names and semantics may change — RustFS is pre-1.0. Verify against your own version before relying on the alert thresholds.
Data source config
Collector config:
Upload an updated version of an exported dashboard.json file from Grafana
| Revision | Description | Created | |
|---|---|---|---|
| Download |