
VictoriaLogs - Explorer for Kubernetes logs
Explorer for Kubernetes logs via VictoriaLogs datasource.
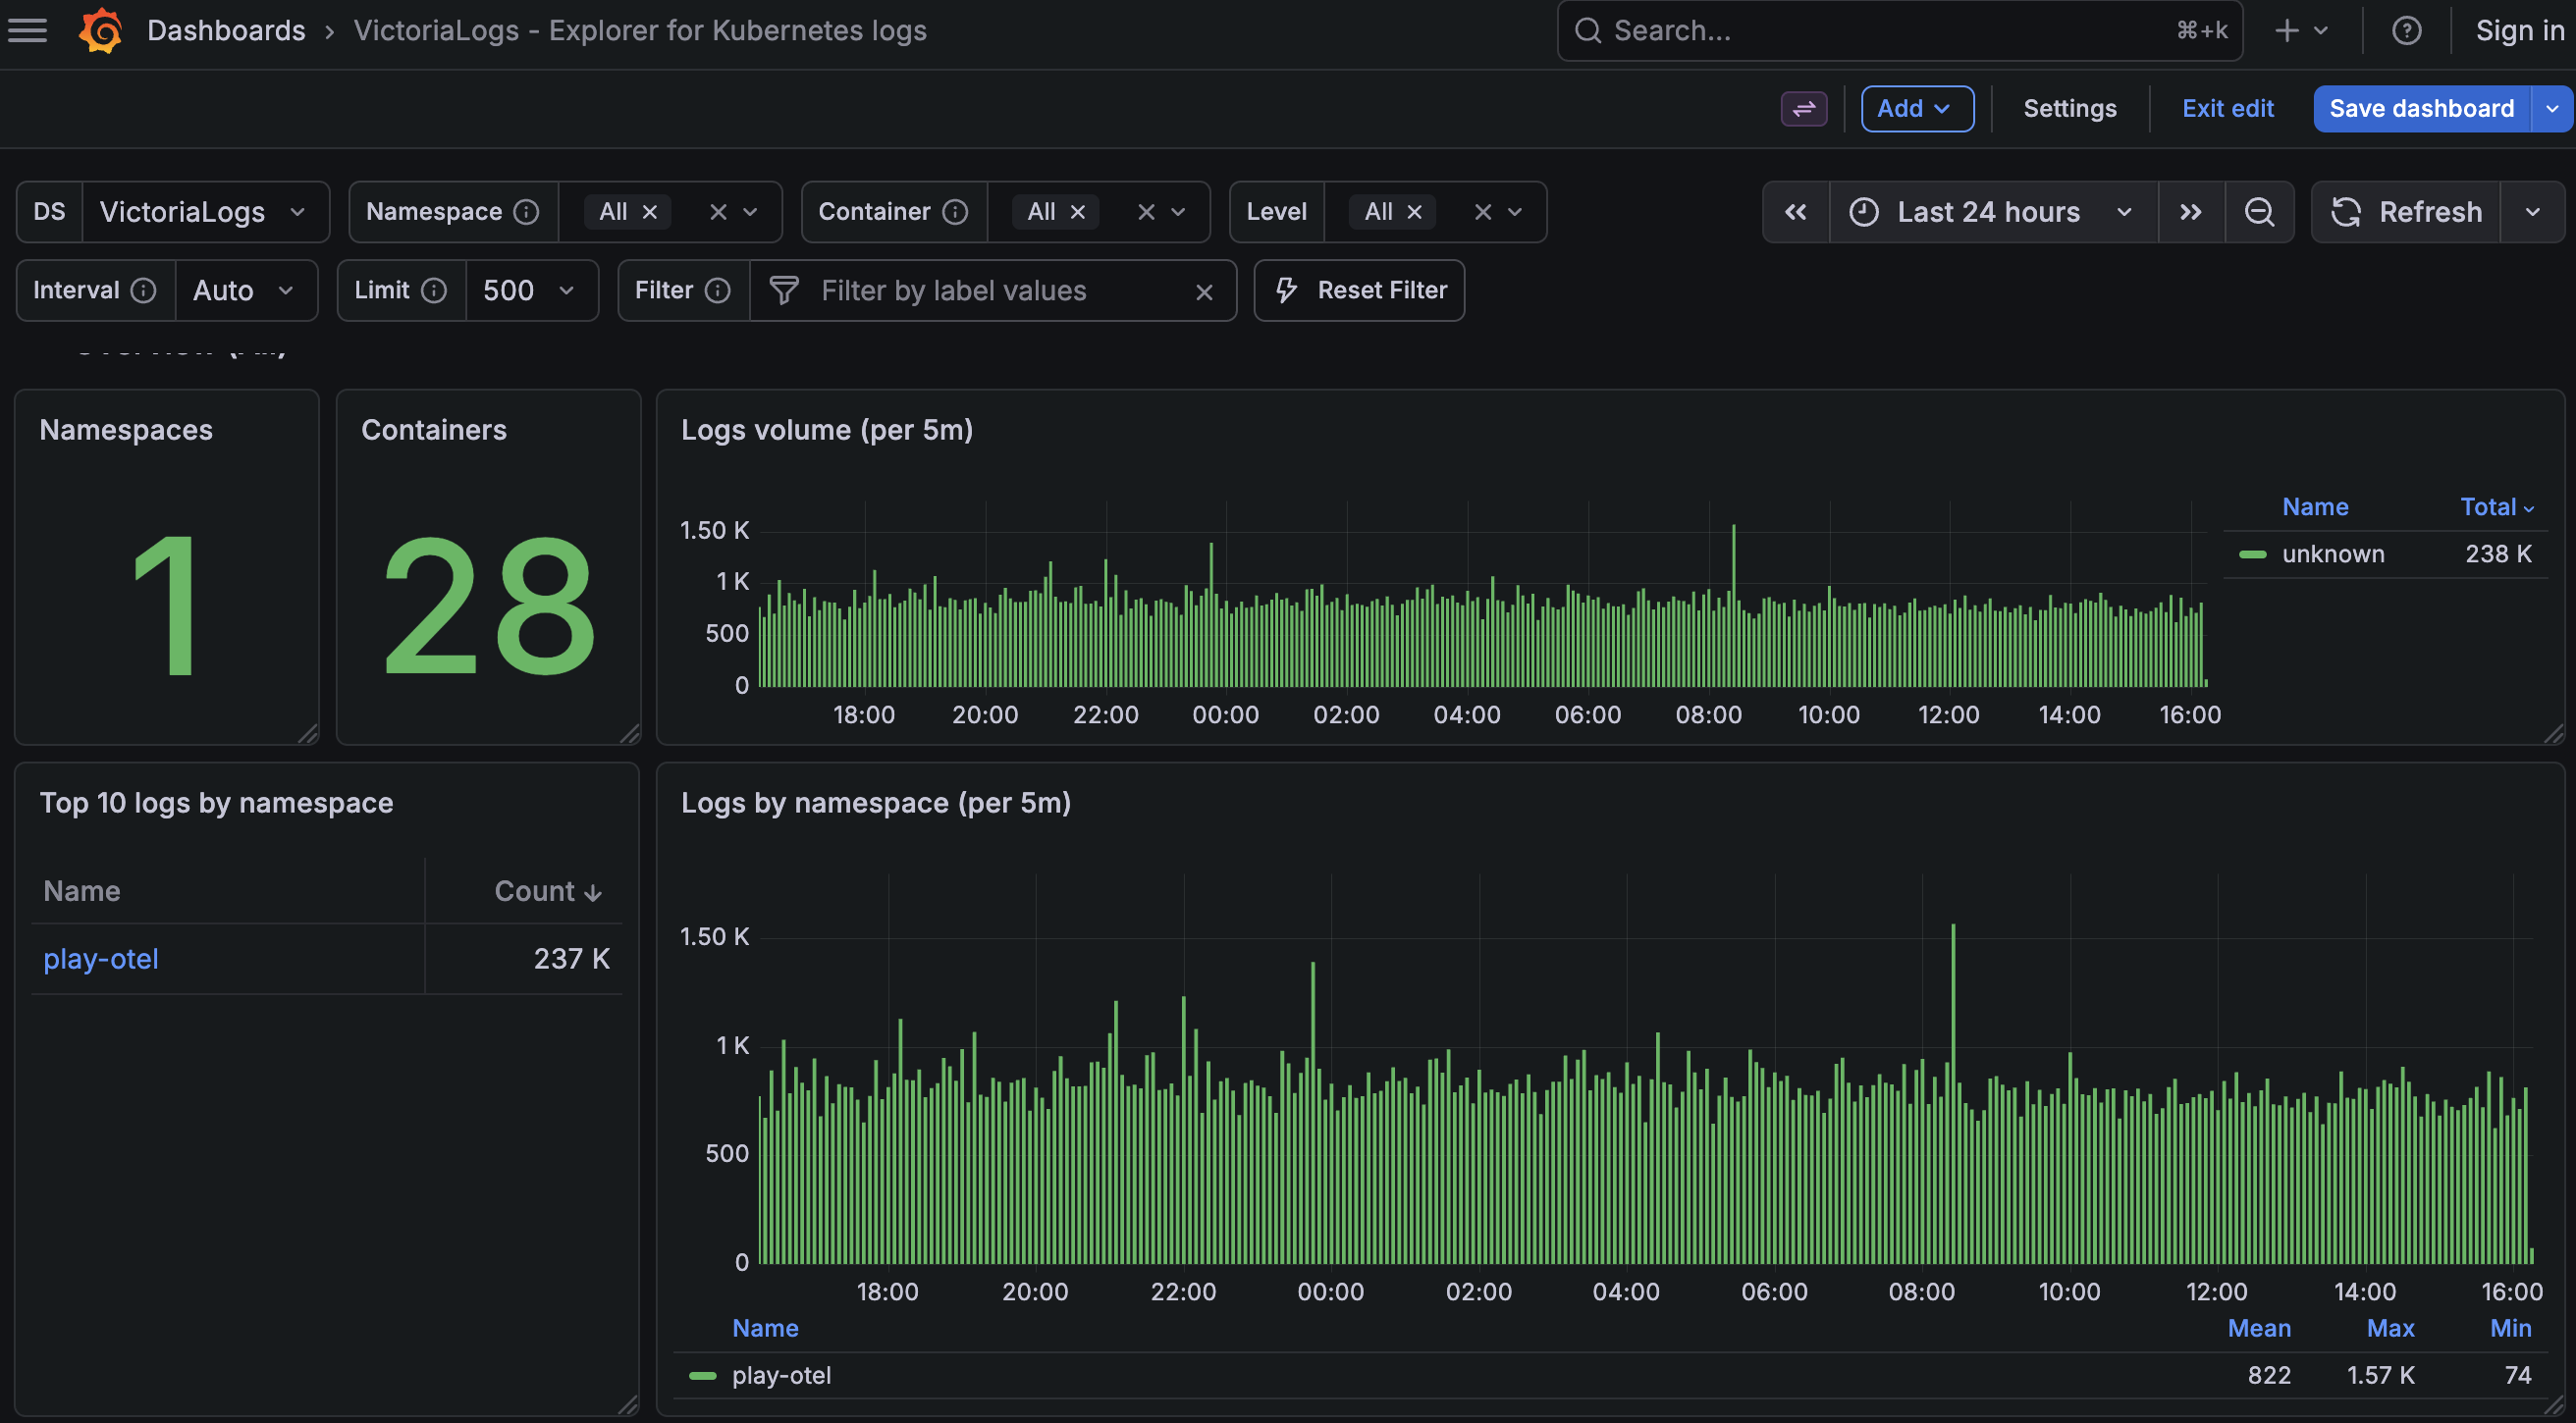
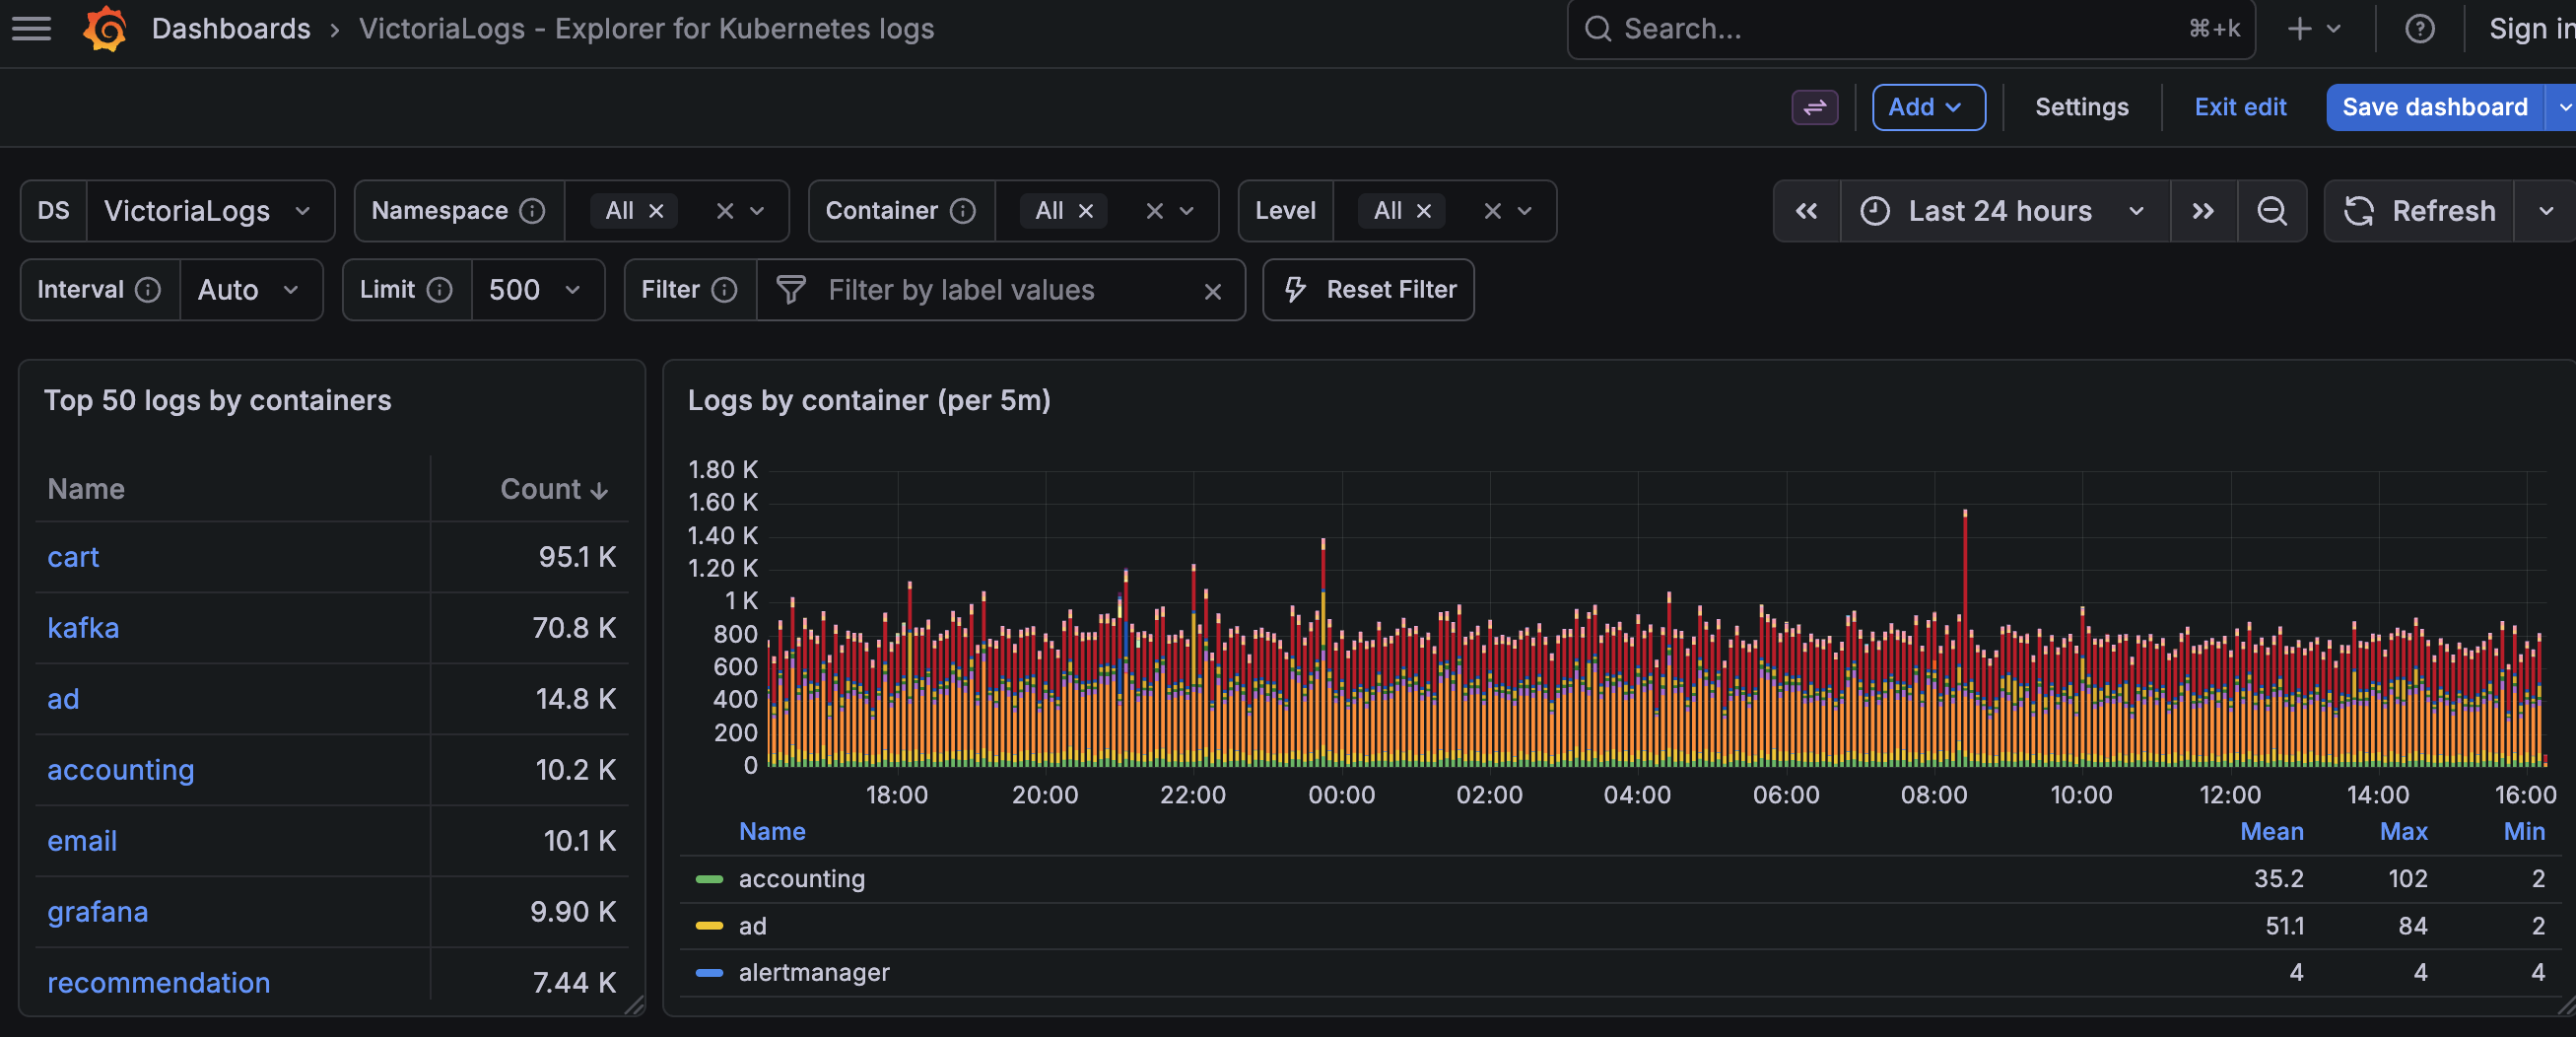
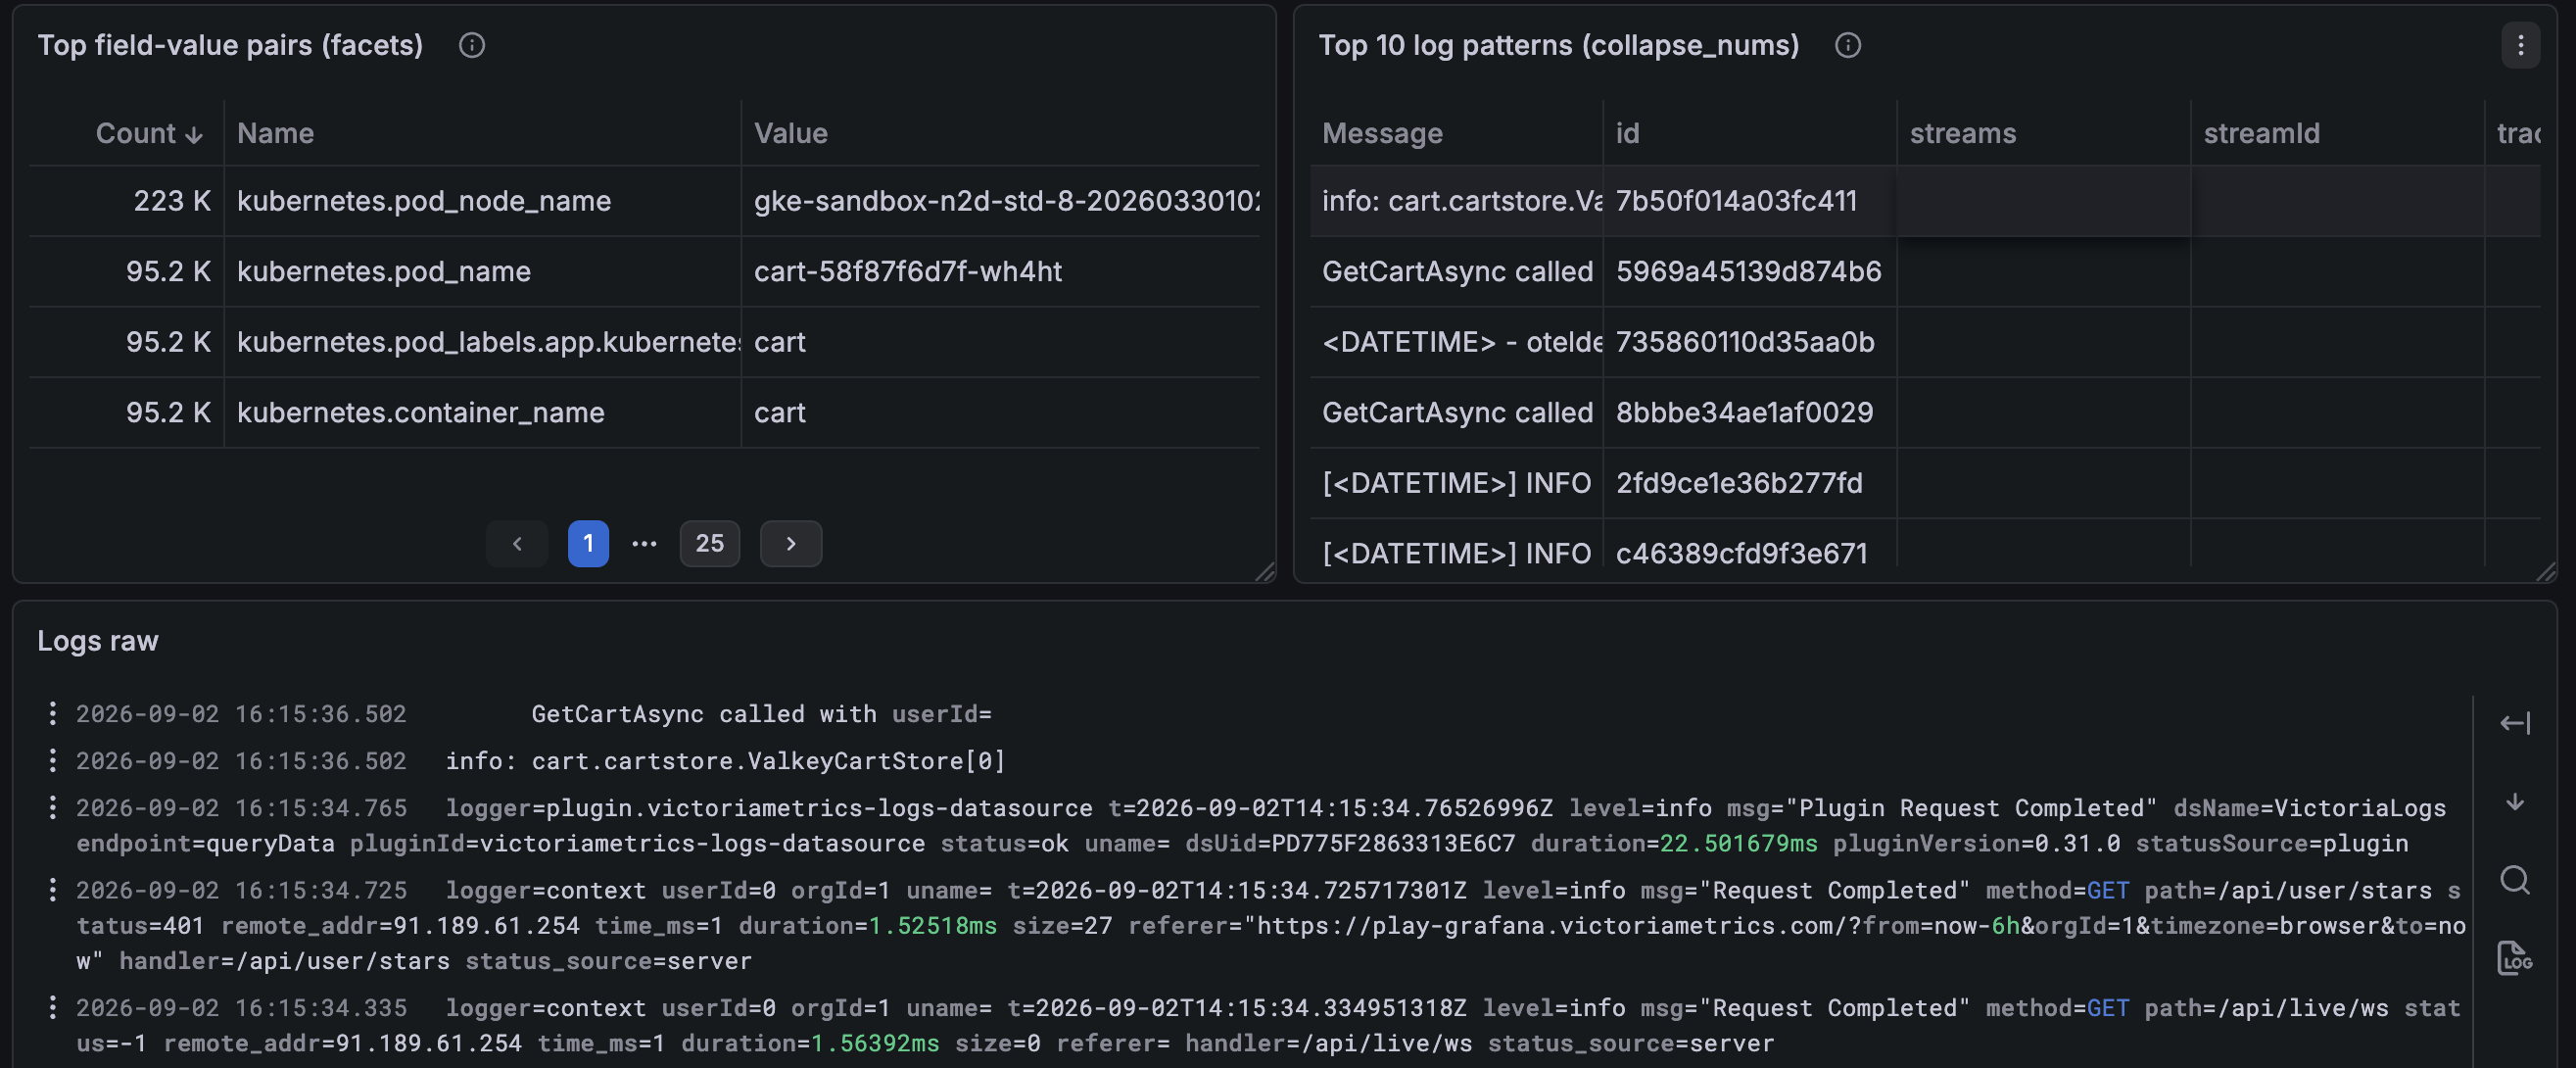
This is an example of a dashboard for exploring K8s logs via VictoriaLogs datasource. It includes variables, filtering, typical panels, various queries for re-shaping the logs output.
- The dashboard filters data by
container name. The data may not be displayed correctly if several containers have the same name - There is a
limitof options for some variables. For example, if there are more applications in your cluster than thelimitparam - some apps may not be displayed. In this case adjust the limit according to your preference.
The demo version of dashboard is available at playground: https://play-grafana.victoriametrics.com/d/lajgcmm/victorialogs-explorer-for-kubernetes-logs
See how to collect logs from k8s applications here.
Data source config
Collector type:
Collector plugins:
Collector config:
Revisions
Upload an updated version of an exported dashboard.json file from Grafana
| Revision | Description | Created | |
|---|---|---|---|
| Download |

Kubernetes

Monitor your Kubernetes deployment with prebuilt visualizations that allow you to drill down from a high-level cluster overview to pod-specific details in minutes.
Learn more