
Harbor Overview - use Core Stat
Overview dashboard for the open-source Harbor container registry, driven by the harbor-exporter Prometheus metrics. Uses only core Stat and Time series panels, so it imports cleanly on Azure Managed Grafana, Grafana Cloud, and self-hosted Grafana without any extra panel plugins.
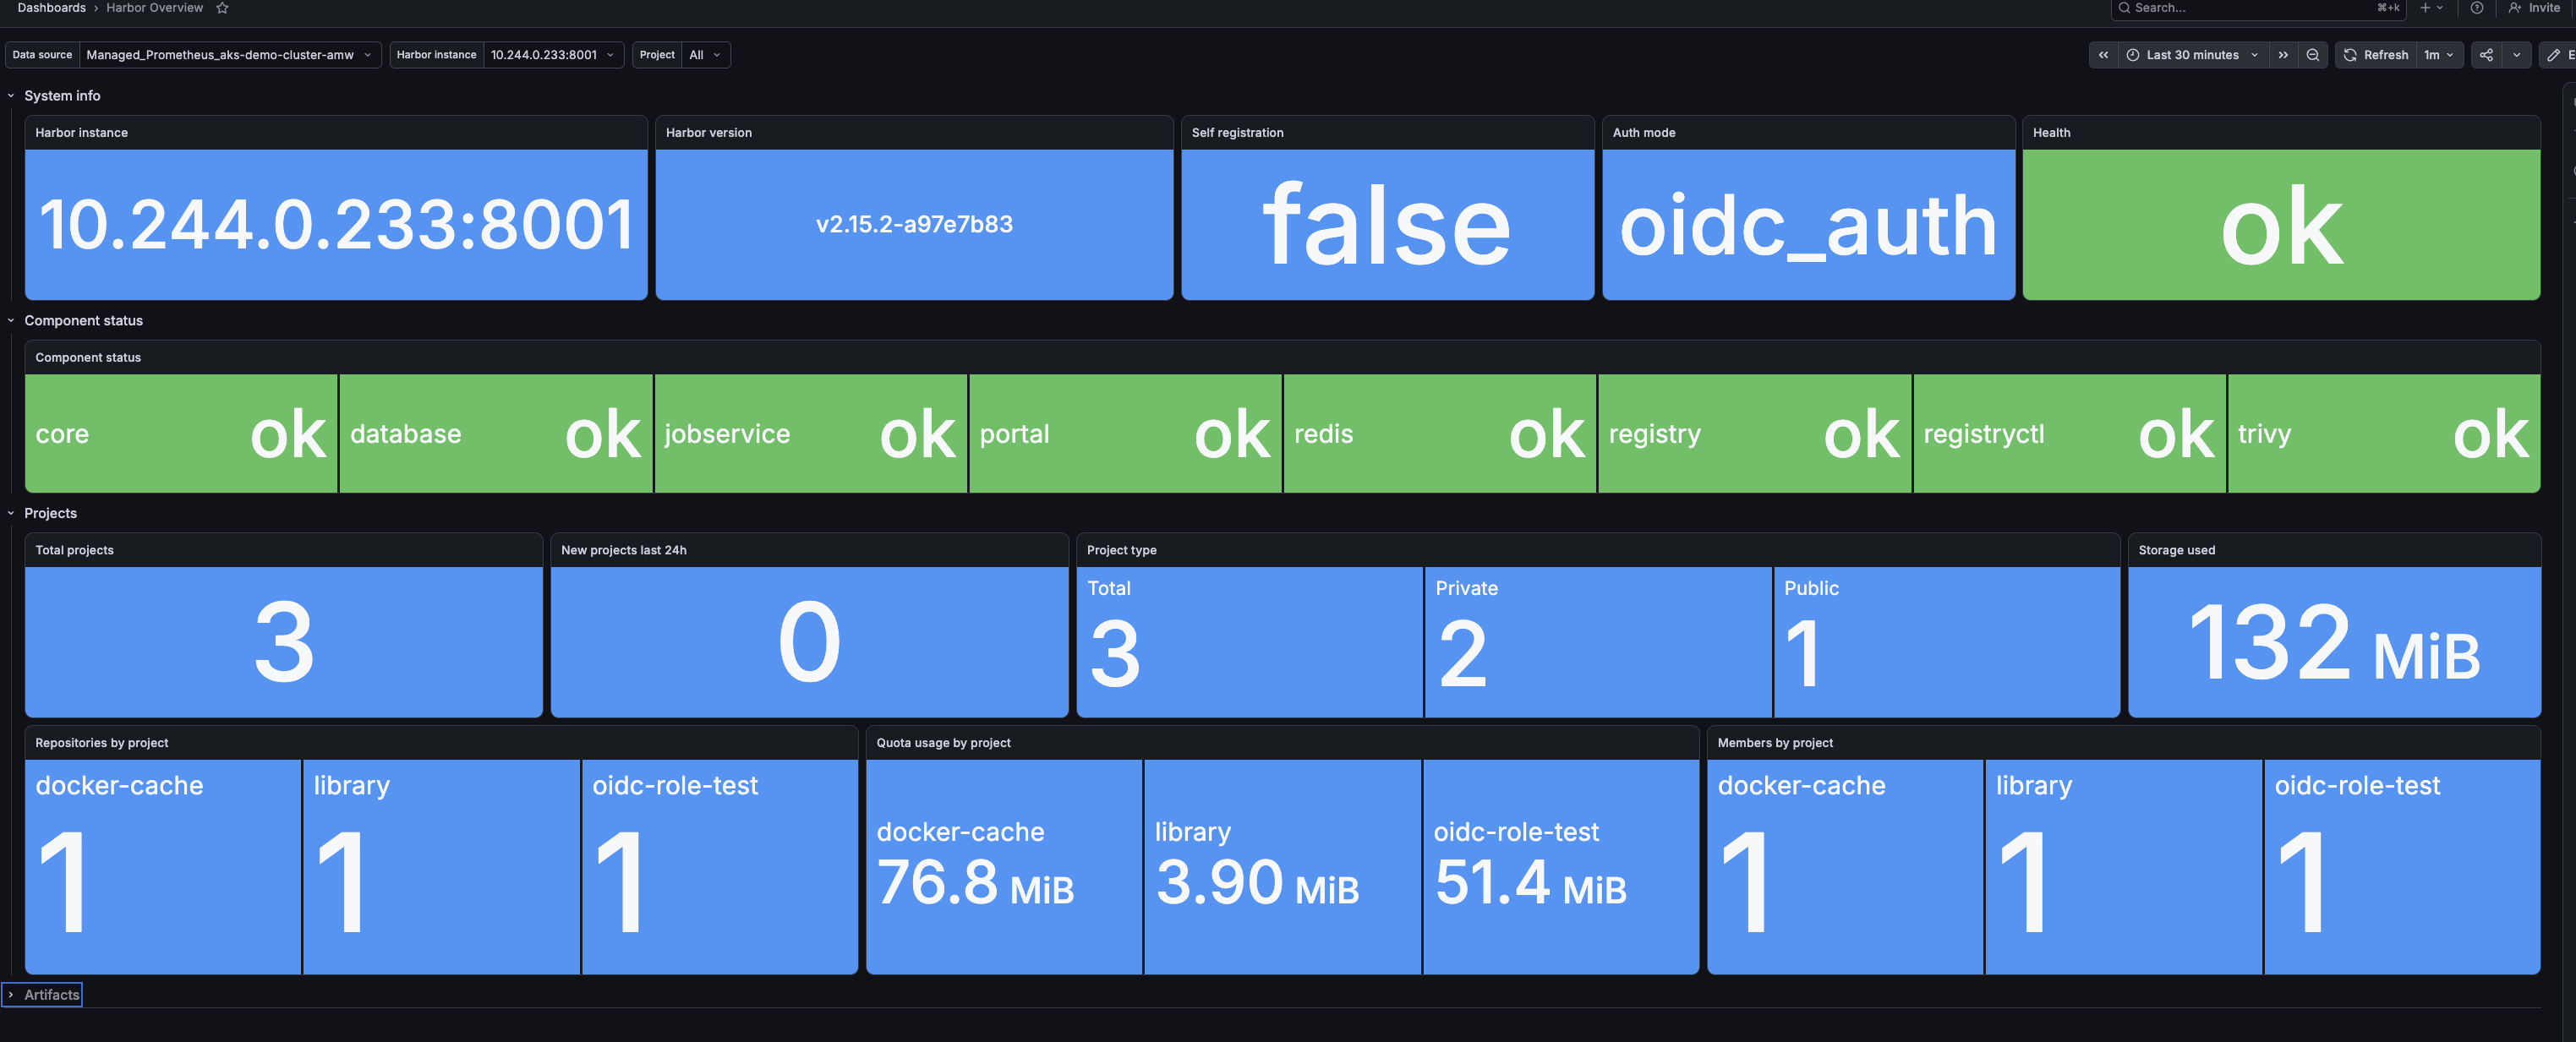
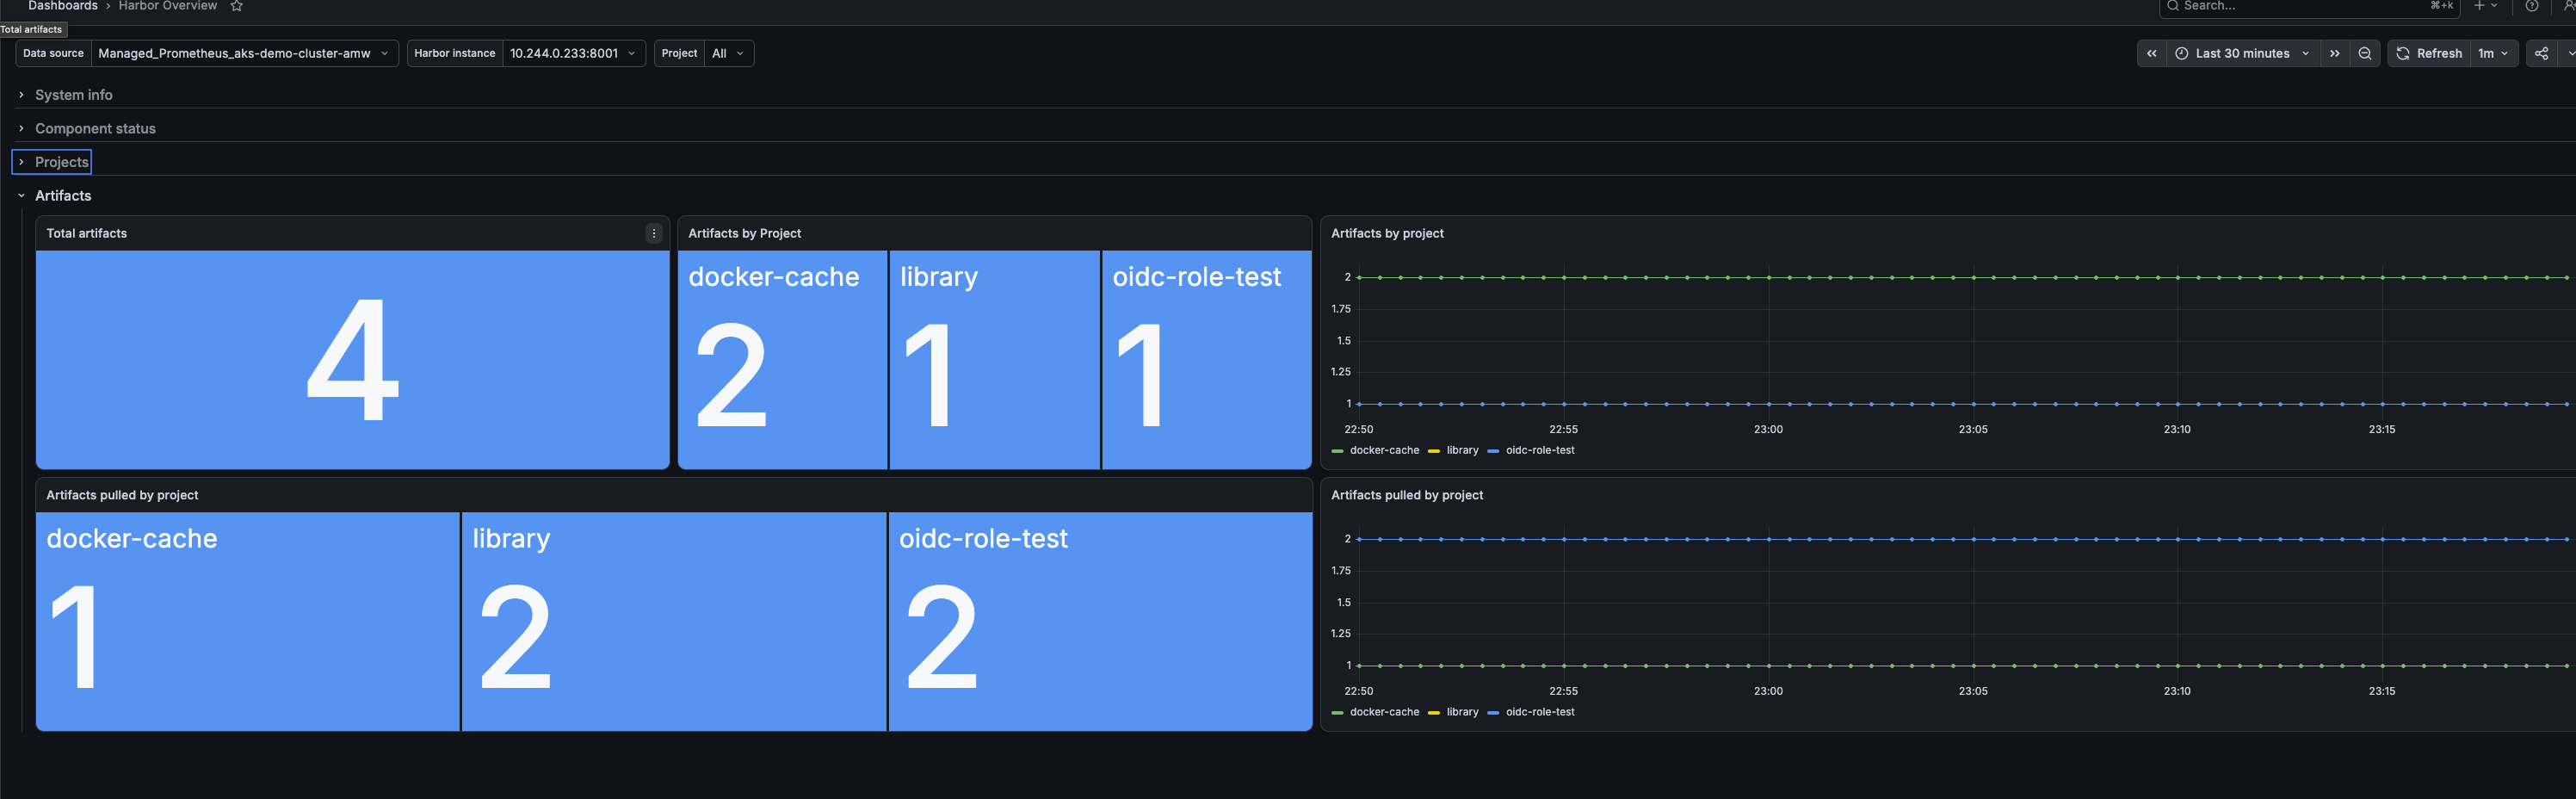
Works on managed Grafana
This dashboard deliberately uses only core Stat and Time series panels — no Pie chart,
Bar gauge, or third-party panel plugins.
That matters on hosted Grafana offerings such as Azure Managed Grafana, where lazily-loaded panel plugins can fail with:
Error loading: piechart Check the server startup logs for more information. If this plugin was loaded from Git, then make sure it was compiled.
Dashboards built around pie charts or bar gauges break in that situation. This one renders everywhere: Azure Managed Grafana, Grafana Cloud, and self-hosted Grafana 11+.
Compatibility
| Platform | Status |
|---|---|
| Azure Managed Grafana | Tested |
| Grafana Cloud | Compatible |
| Self-hosted Grafana 11+ | Compatible |
Schema version 41, exported for external sharing — the Prometheus data source is selected during import.
Data source config
Collector config:
Upload an updated version of an exported dashboard.json file from Grafana
| Revision | Description | Created | |
|---|---|---|---|
| Download |