
CloudFront Metrics Extreme
Display CloudFront Metrics for Each Accounts
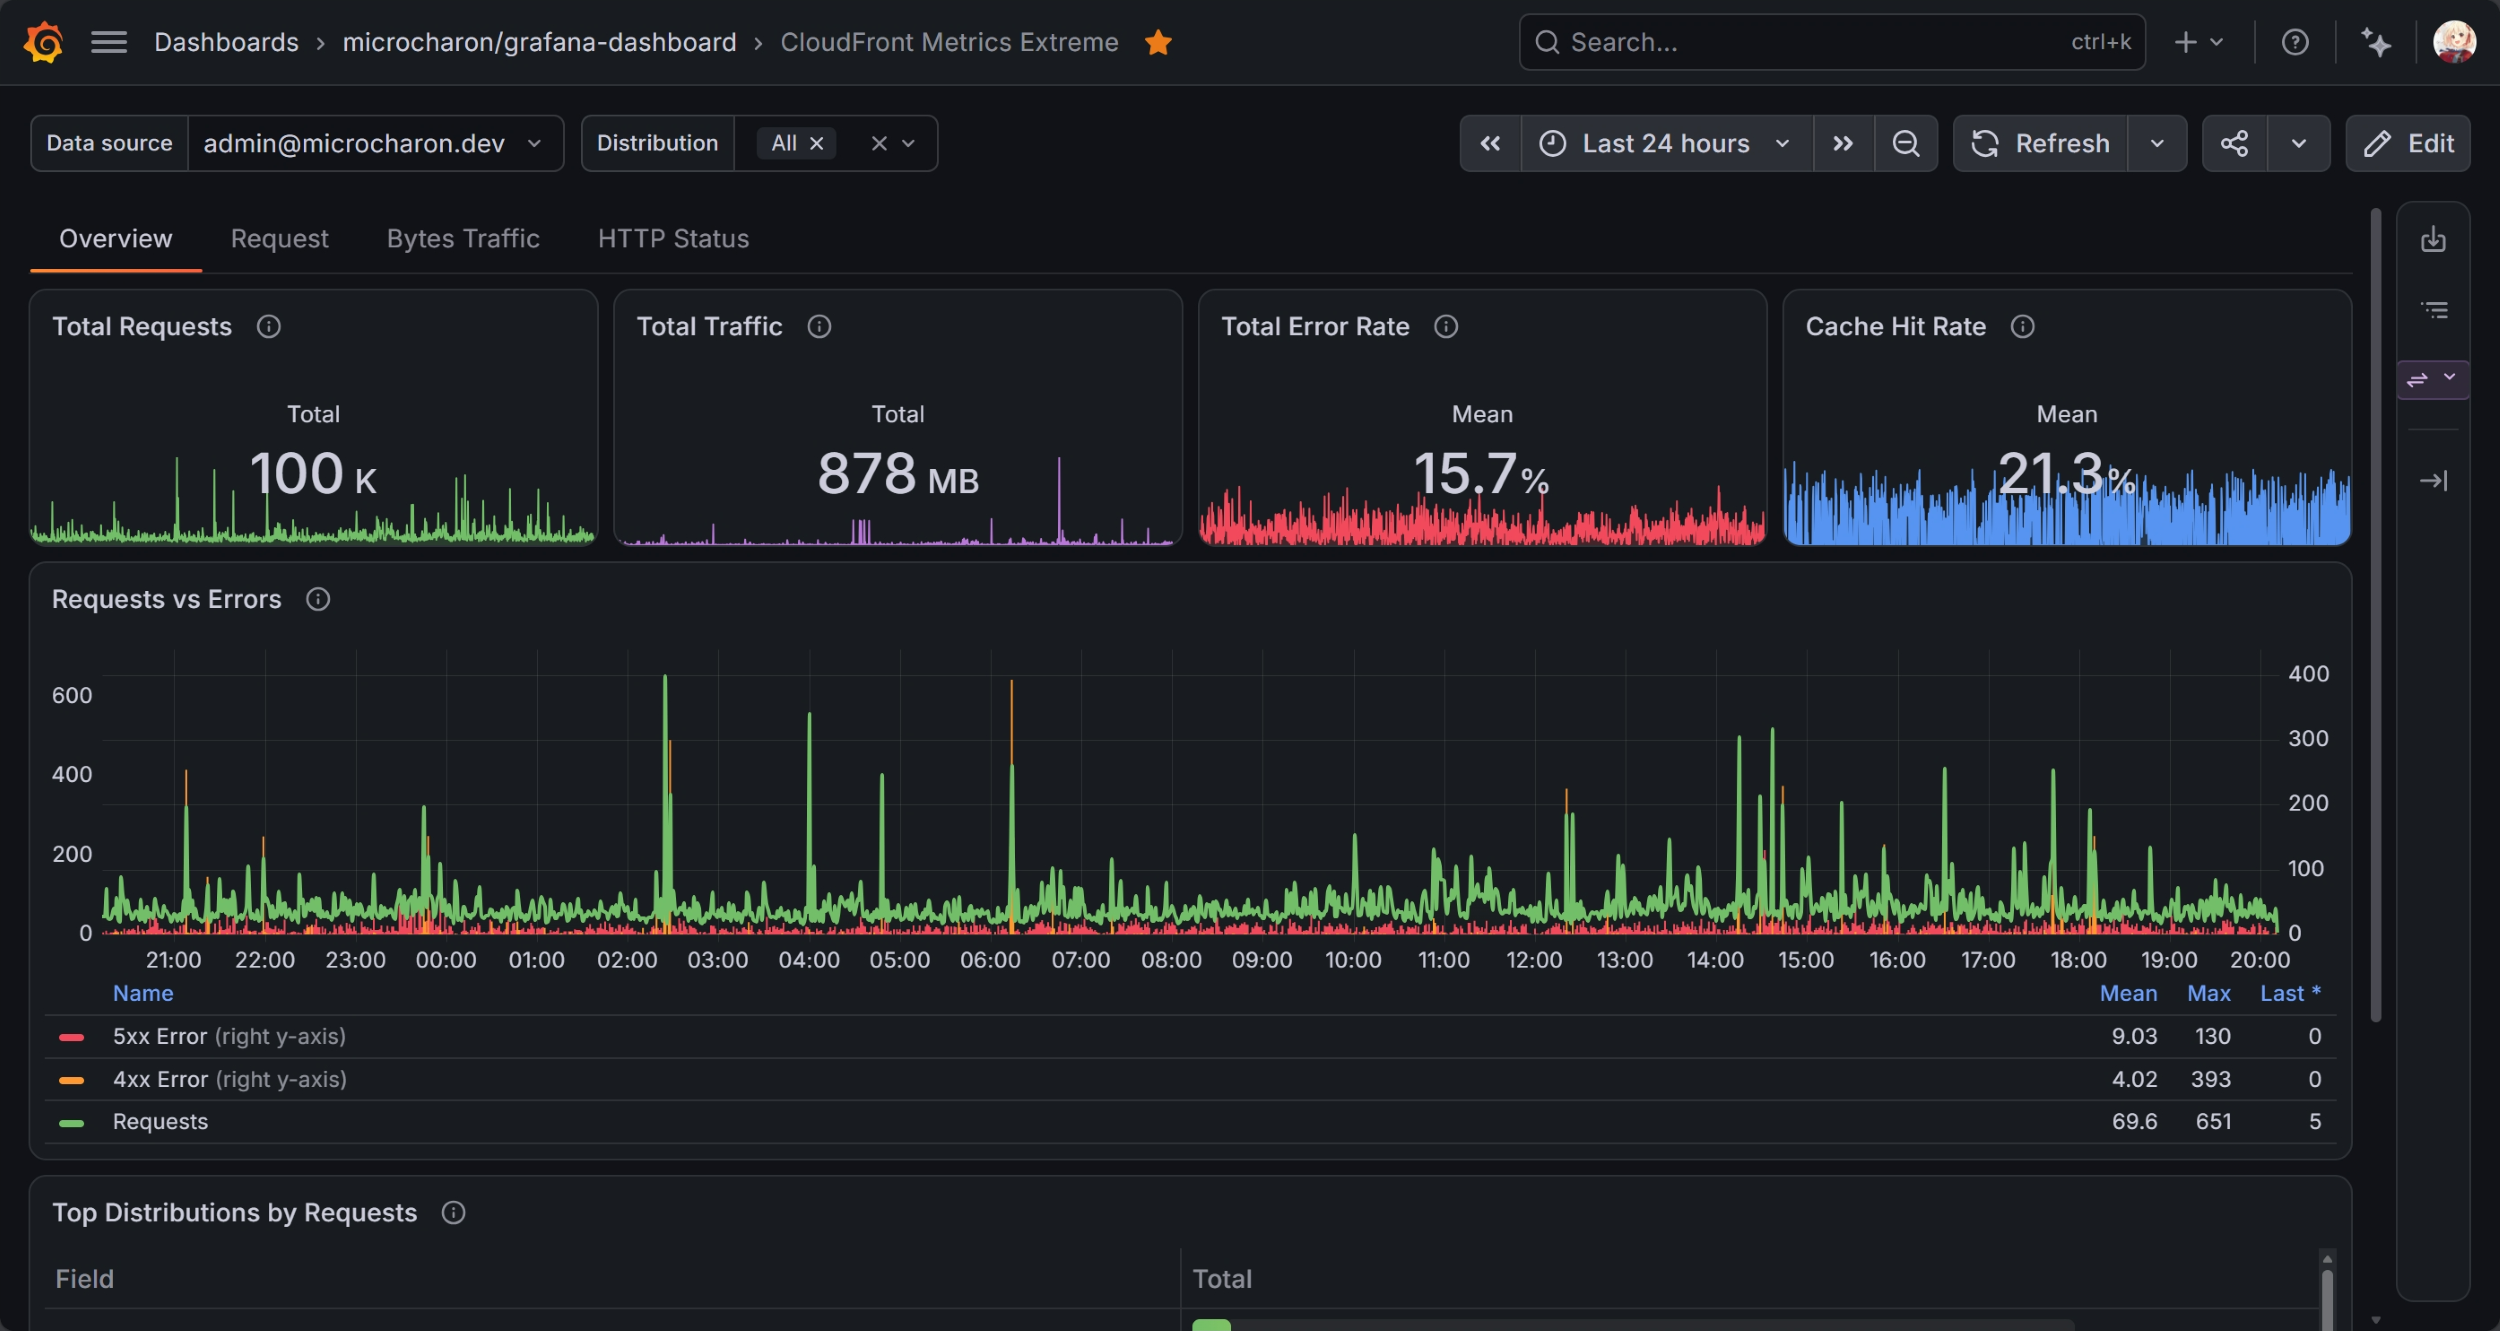
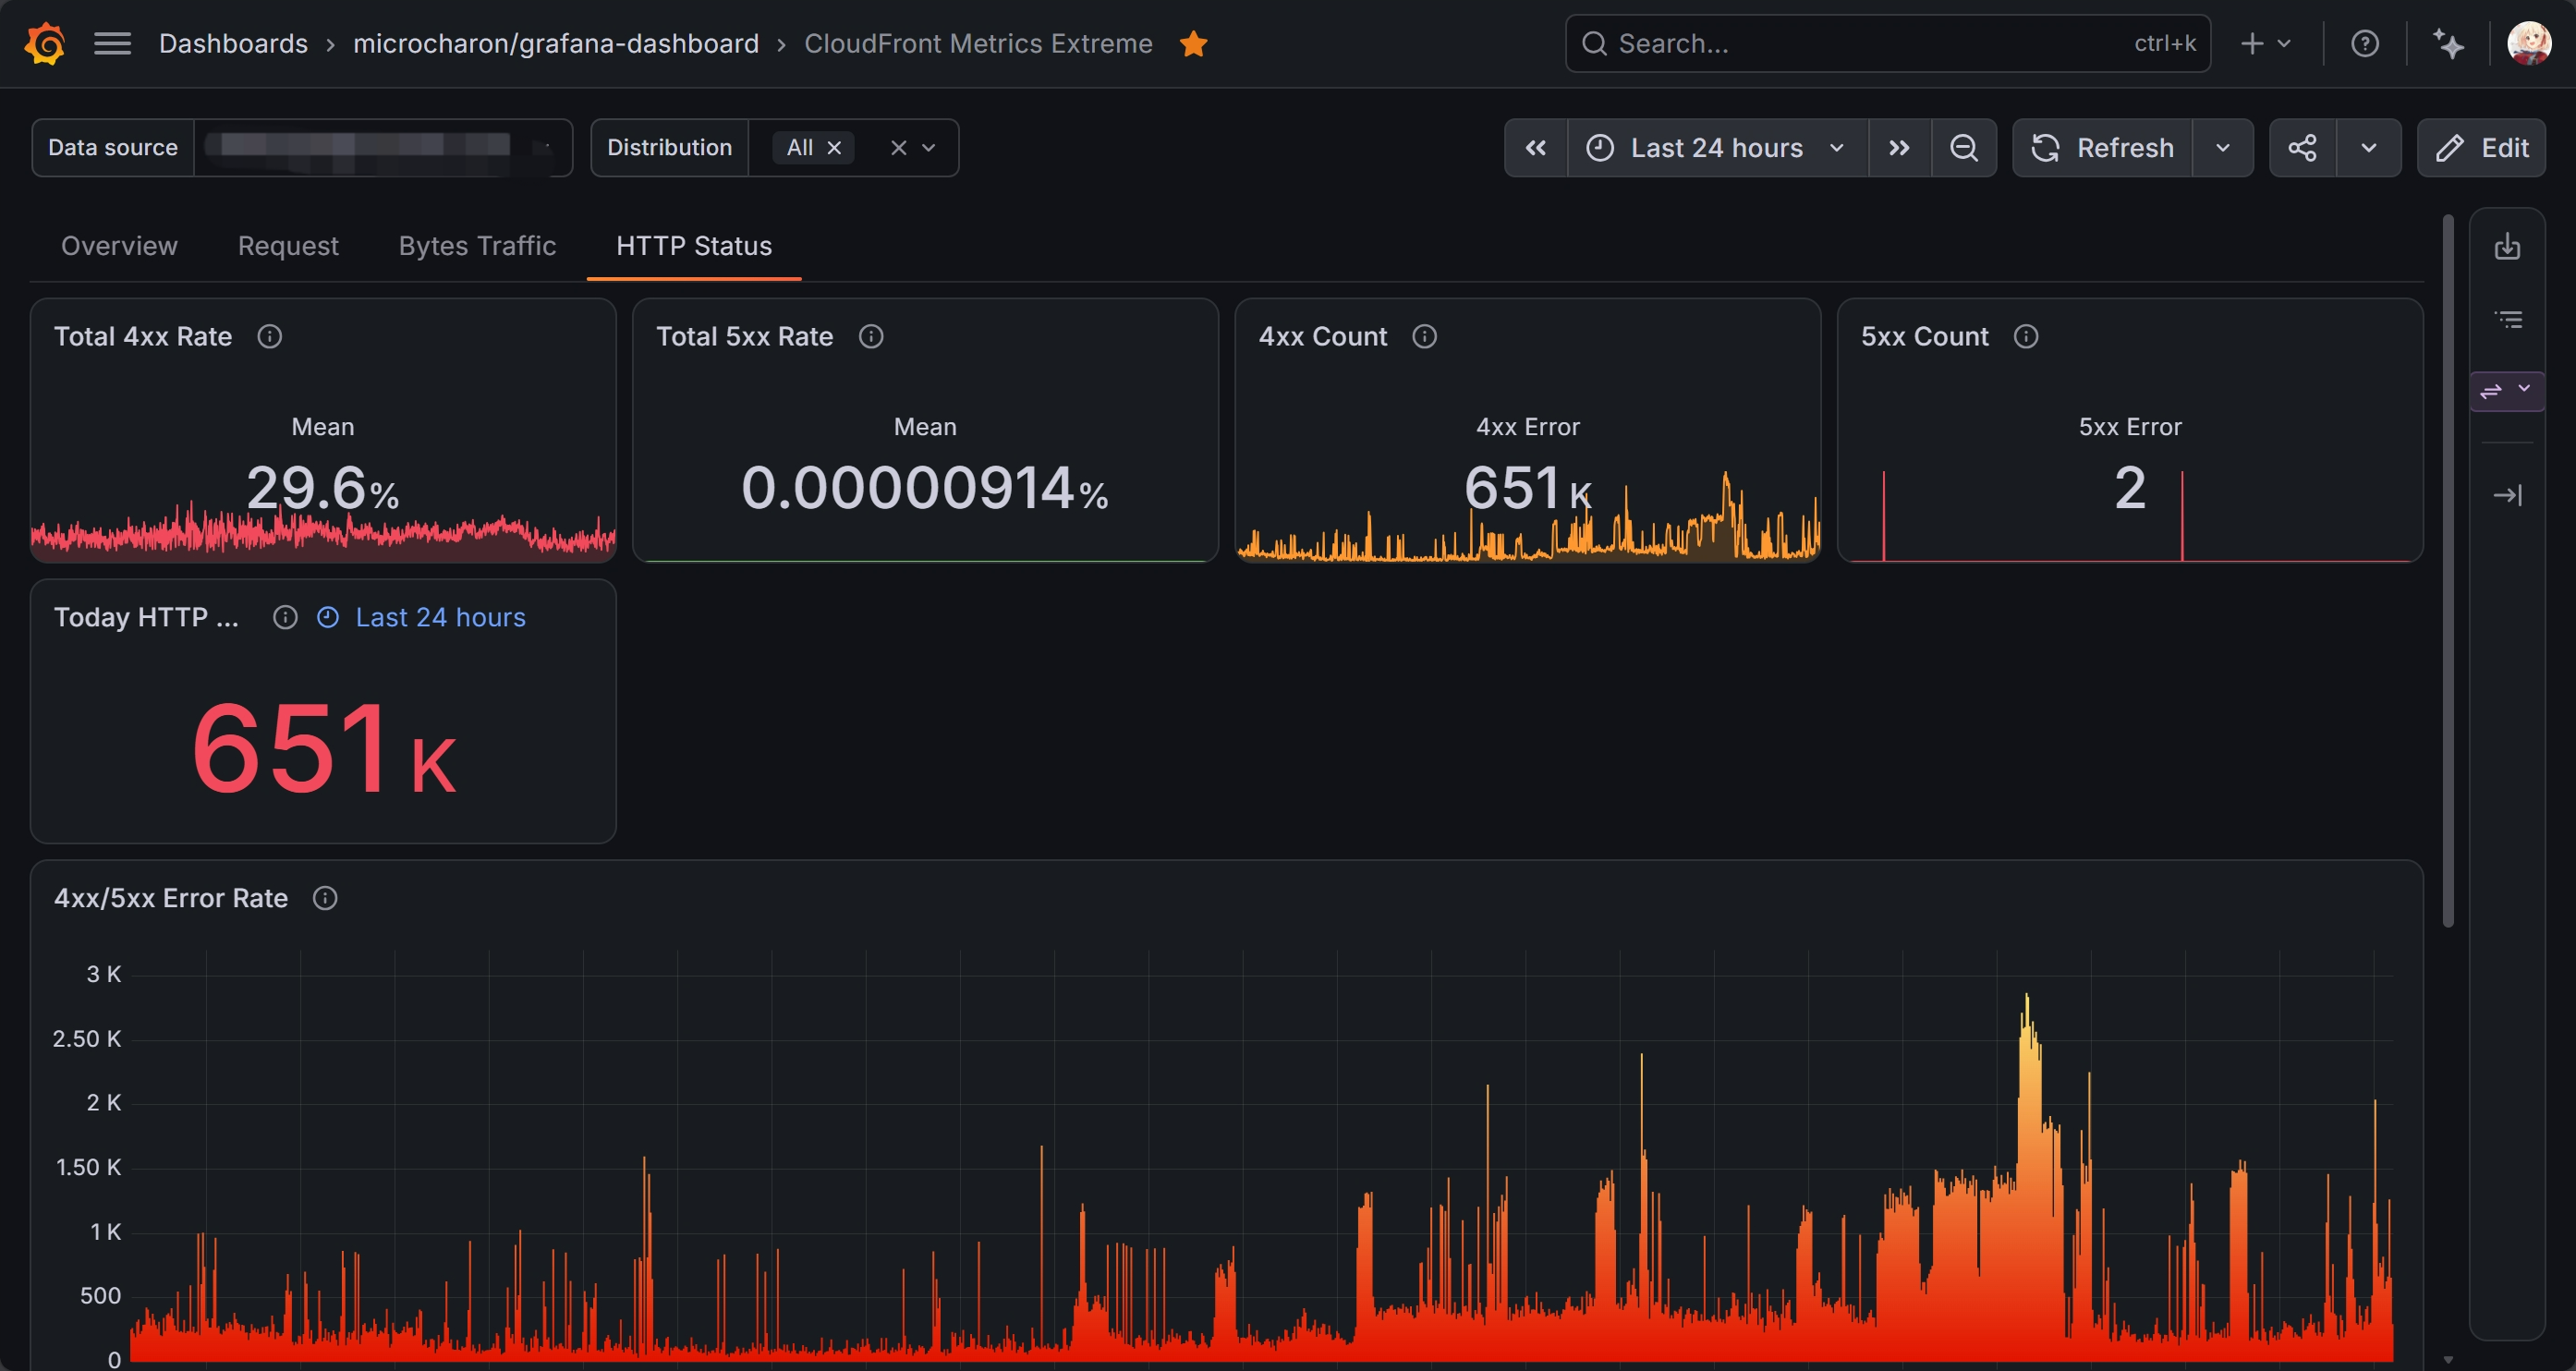
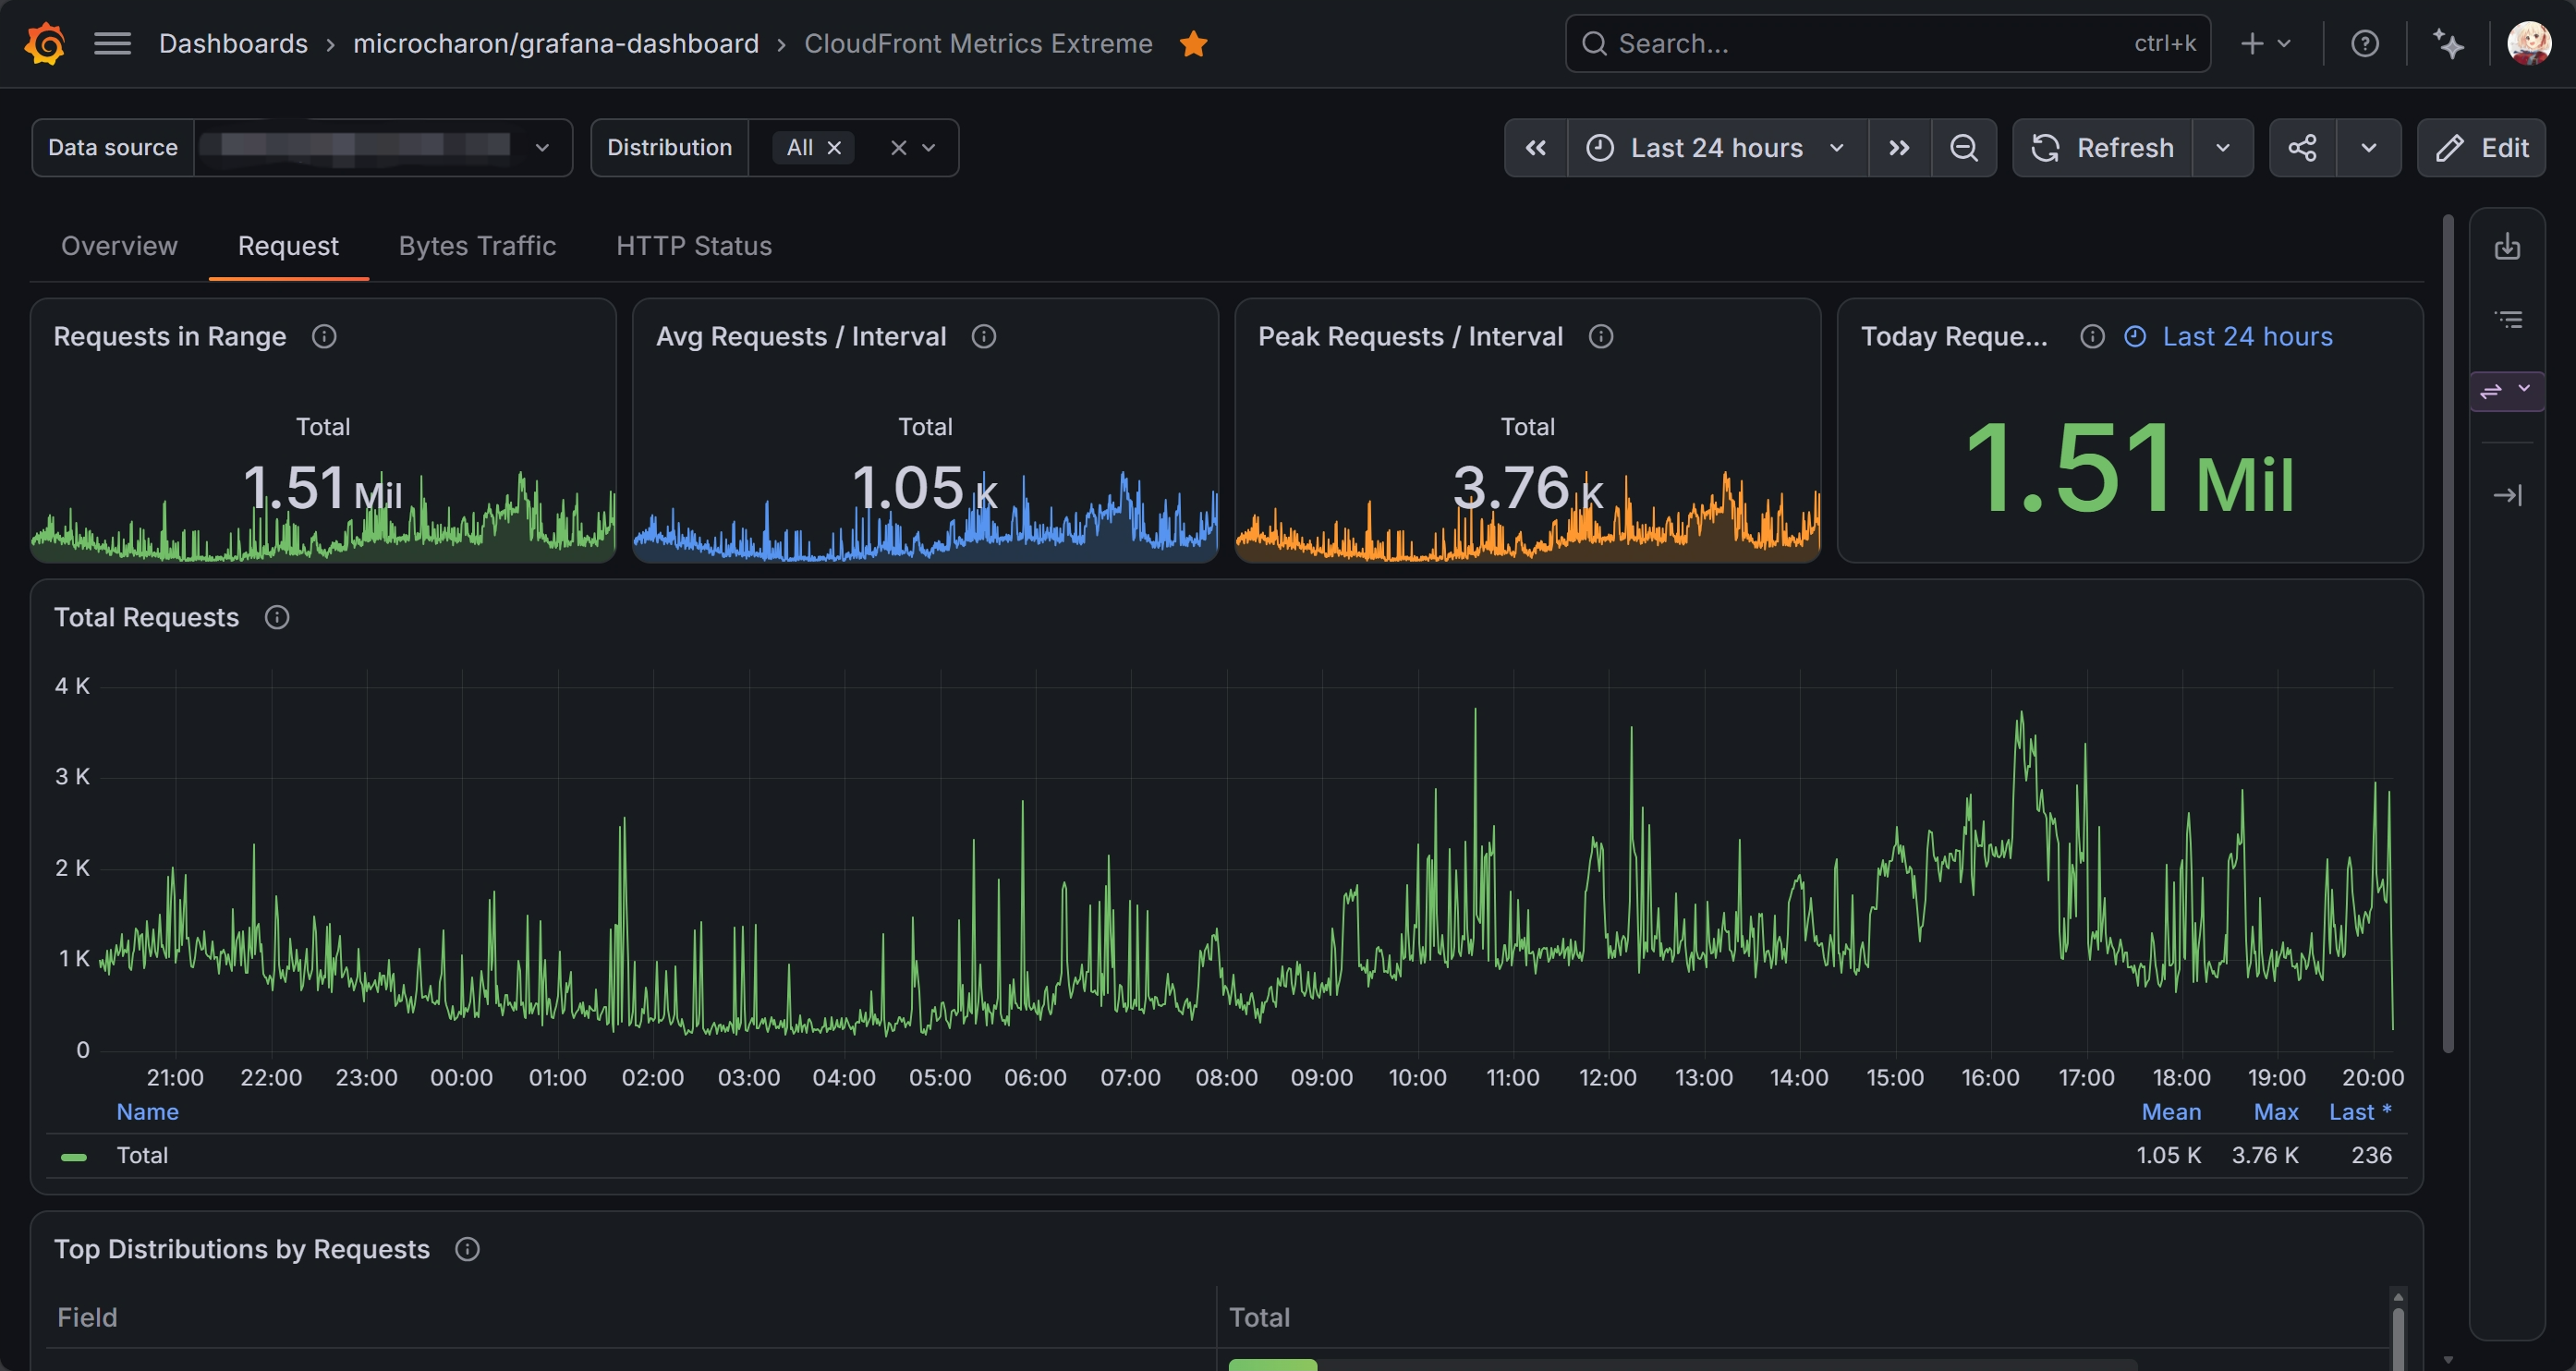
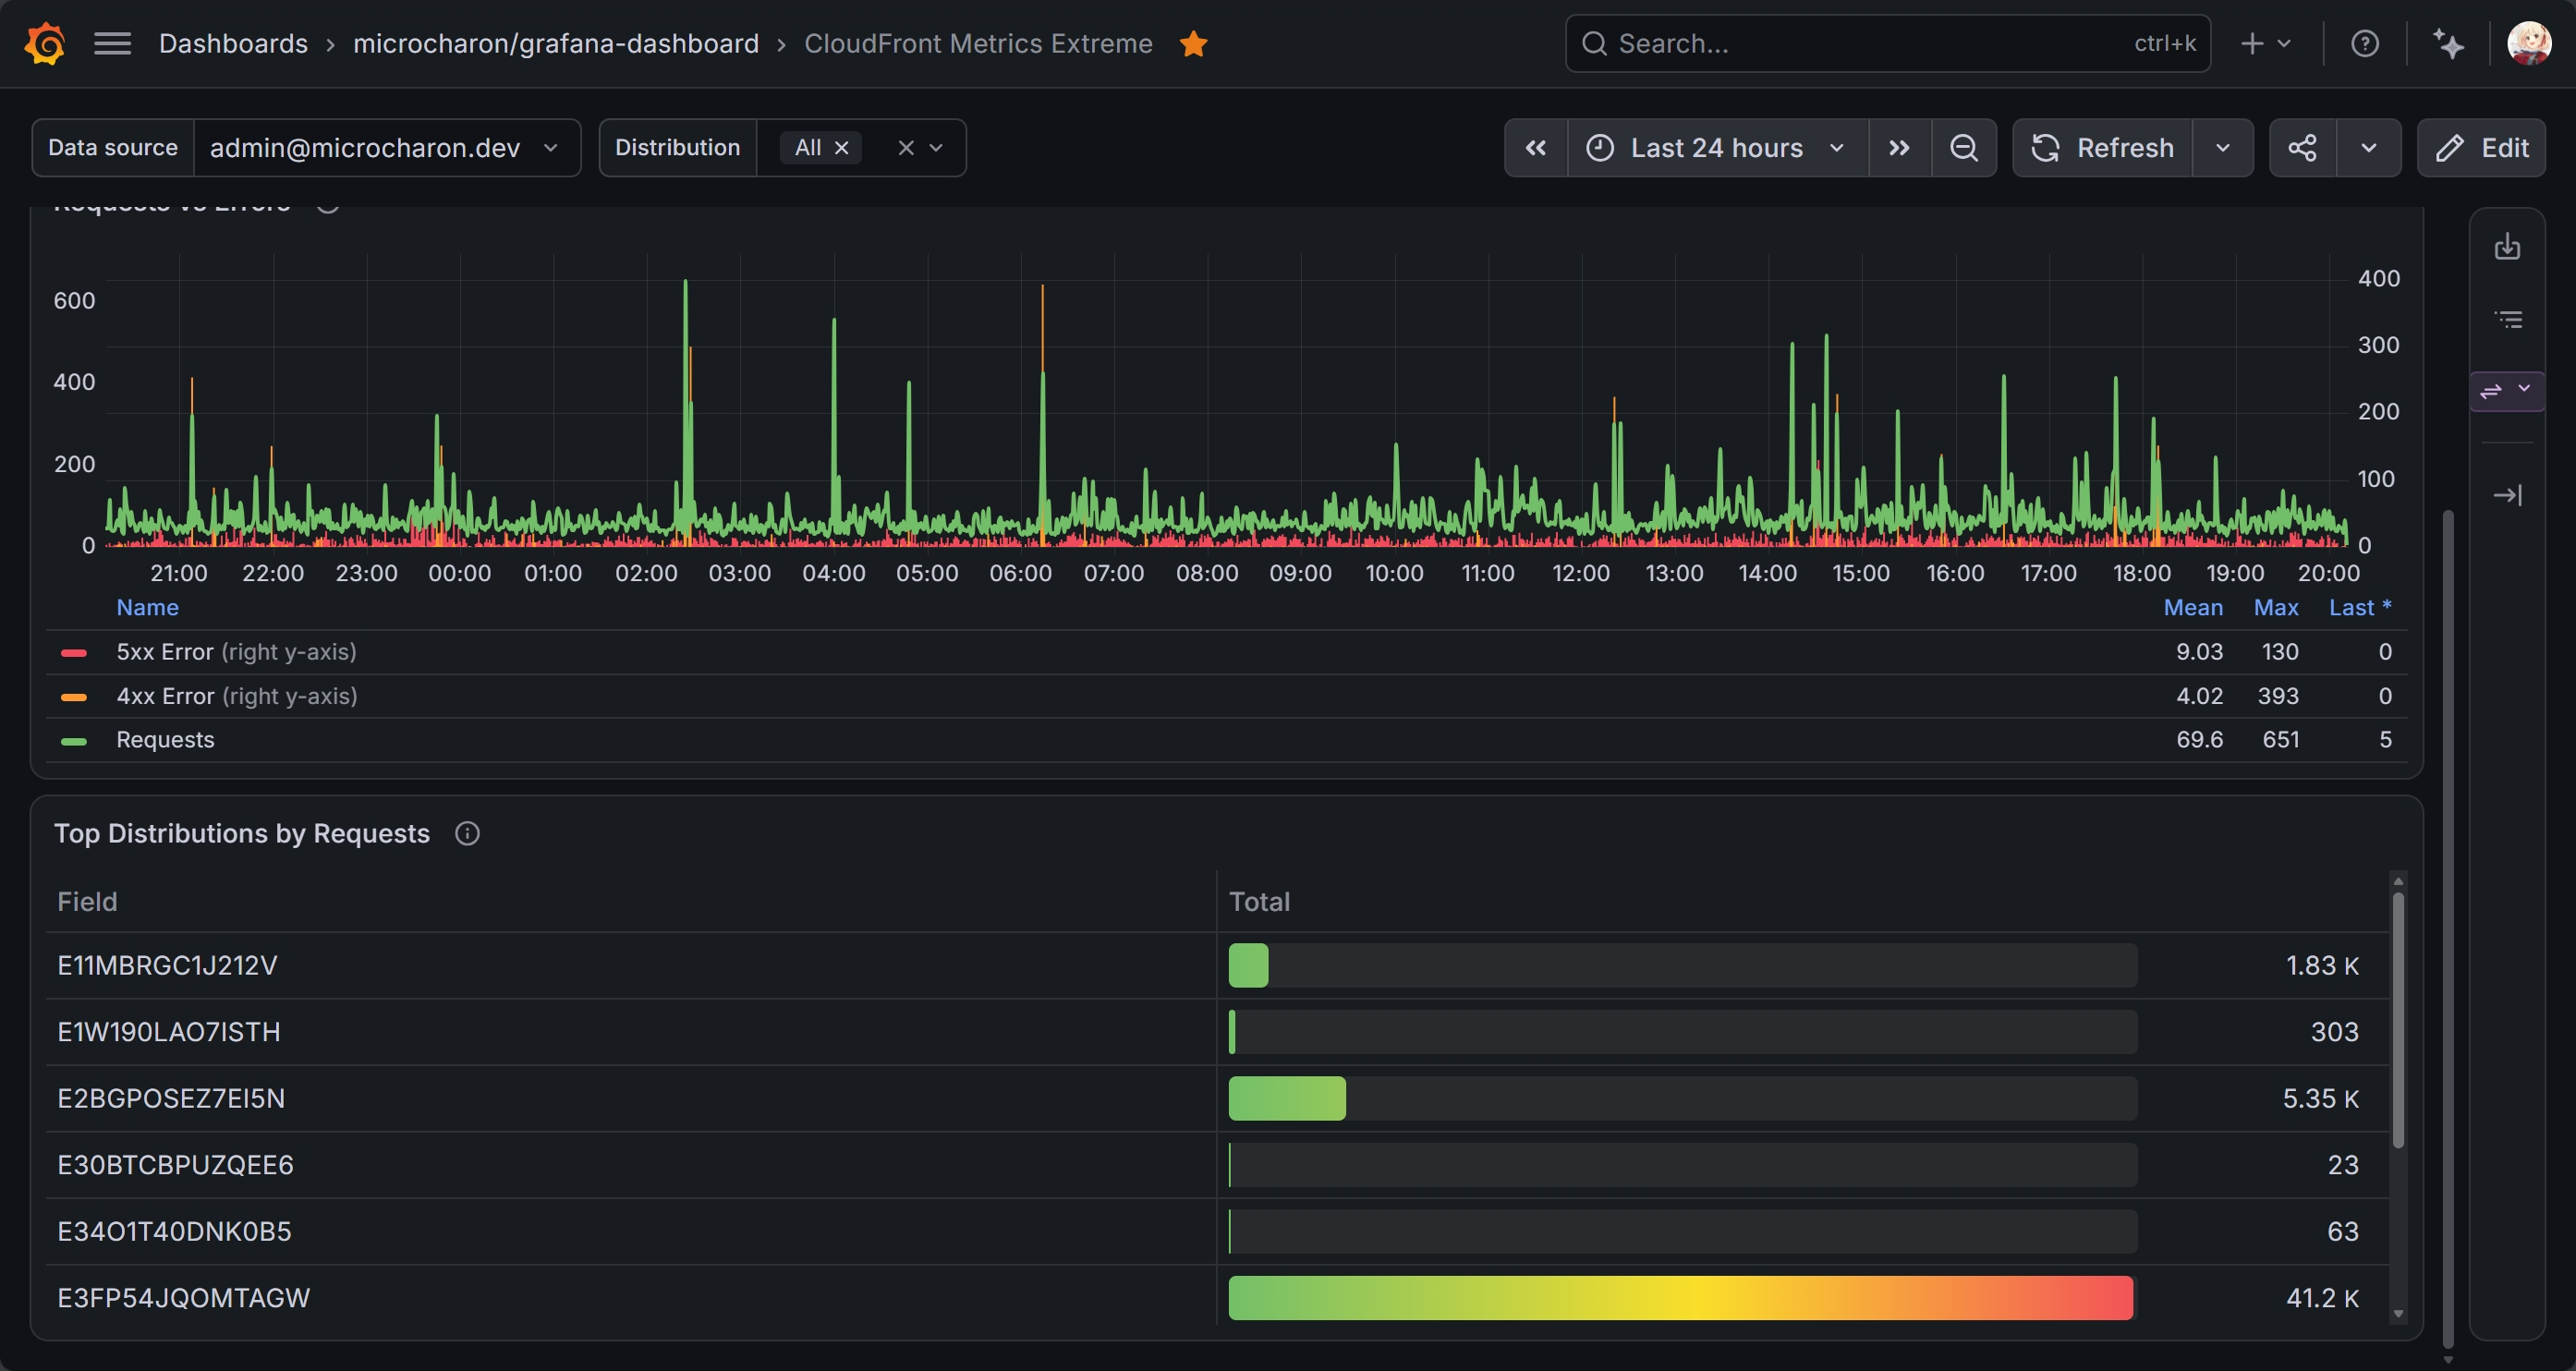
CloudFront Metrics Extreme
CloudFront Metrics Extreme provides a multi-distribution view of Amazon CloudFront activity using the native Grafana CloudWatch data source. It is designed for quickly reviewing request volume, transferred bytes, HTTP errors, cache efficiency, and the distributions contributing the most traffic or errors.
Features
- Switch between configured AWS CloudWatch data sources.
- Filter one, multiple, or all CloudFront distributions.
- Overview, Request, Bytes Traffic, and HTTP Status tabs.
- Selected-range and rolling 24-hour request and traffic summaries.
- 4xx, 5xx, and total error-rate visibility.
- Estimated 4xx and 5xx error counts derived from requests and error-rate metrics.
- Top distributions ranked by requests, byte traffic, and HTTP errors.
- Cache hit-rate summary when the metric is available.
Requirements
- A Grafana version that supports Dashboard Schema v2. The dashboard was built with Grafana 13.2.
- The built-in Amazon CloudWatch data source.
- A configured AWS credential or assumed role with permission to discover and read CloudWatch metrics.
- CloudFront metrics must be queried from
us-east-1(US East, N. Virginia).
No collector or Grafana Agent is required.
Setup
- Import the dashboard and select your CloudWatch data source in the Data source variable.
- Confirm that the data source's default region is
us-east-1. - Select one or more values from the Distribution variable.
- Adjust the dashboard time range as needed.
Metric Notes
- Panels labelled Today use a rolling 24-hour range rather than a calendar day.
- HTTP error counts are estimates calculated from
Requests × ErrorRate / 100. CacheHitRateis an additional CloudFront metric and appears only for distributions where additional metrics are enabled.- CloudWatch data can arrive with a short delay, so the latest interval may be incomplete.
Scope
This dashboard uses CloudWatch metrics only. It does not query CloudFront access logs, real-time logs, AWS WAF logs, origin logs, or CloudFront configuration data.
Documentation
Data source config
Collector type:
Collector plugins:
Collector config:
Revisions
Upload an updated version of an exported dashboard.json file from Grafana
| Revision | Description | Created | |
|---|---|---|---|
| Download |