
Linux Network Performance
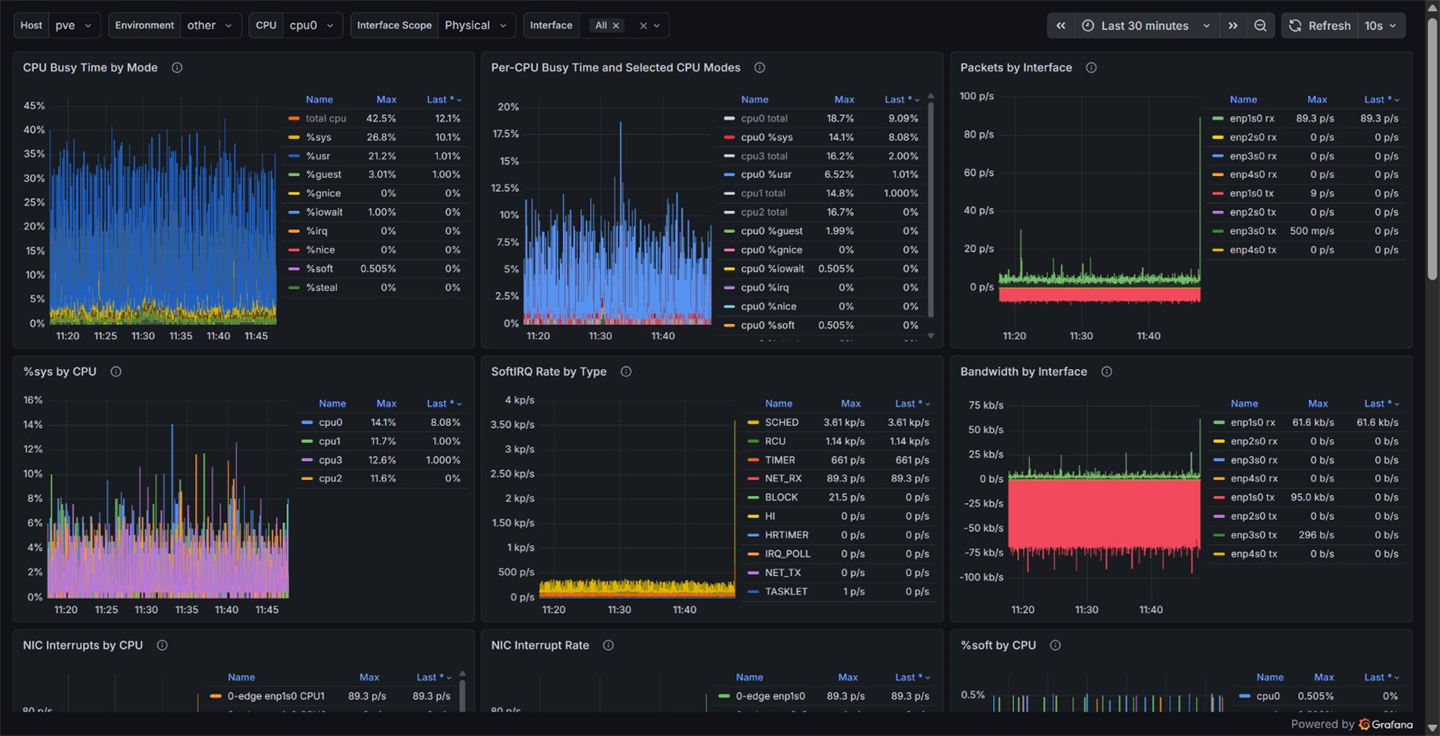
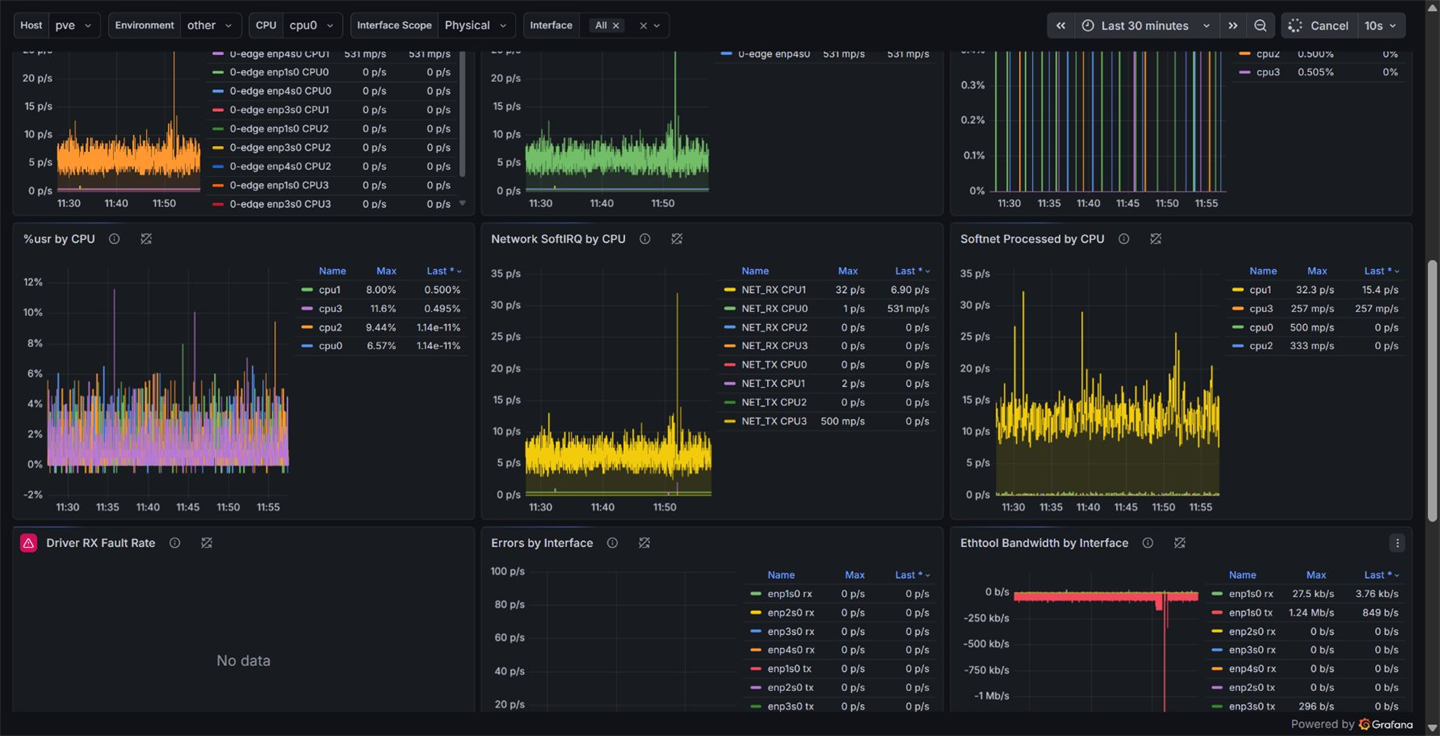
Focused Linux network performance dashboard for Telegraf and InfluxDB Flux. Correlates CPU modes, IRQ and SoftIRQ activity, interface throughput and packets, NIC interrupts, driver faults, errors, drops, ethtool counters, and traffic-control qdisc events across 21 selected panels.
Linux Network Performance
A focused Linux network performance dashboard for Telegraf and InfluxDB Flux. It places 21 high-signal CPU, interrupt, interface, driver, and qdisc panels in a compact three-column layout.
Coverage
- CPU busy time by mode and per-CPU
%sys,%usr,%irq, and%soft - SoftIRQ, softnet, and NIC interrupt activity by CPU
- Interface bandwidth, packet rate, errors, and drops
- Driver RX/TX fault rates and ethtool bandwidth and packet counters
- Traffic-control qdisc drops, overlimits, and event rates
Requirements
- Grafana 13.0.1 or later
- Telegraf 1.39+ with the matching custom network collectors
- InfluxDB 2.x with Flux enabled
- An InfluxDB data source that can read the
linuxbucket
Use the dashboard variables to select host, environment, CPU, interface scope, and interface.
Data source config
Collector config:
Upload an updated version of an exported dashboard.json file from Grafana
| Revision | Description | Created | |
|---|---|---|---|
| Download |

Linux Server

Monitor Linux with Grafana. Easily monitor your Linux deployment with Grafana Cloud's out-of-the-box monitoring solution.
Learn more