
Linux Network Performance Deep Dive
Deep Linux network performance and troubleshooting dashboard for Telegraf and InfluxDB Flux. Correlates CPU modes, IRQ/SoftIRQ, per-CPU softnet pressure, interface bandwidth/PPS/errors/drops, ethtool link, ring, coalescing and flow-control metrics, tc qdisc throughput/backlog/drop statistics, TCP/IP/UDP/ICMP/IPv6 counters, conntrack capacity/sessions/events, and socket queue/memory/buffer pressure. Includes filters for host, environment, CPU, interface scope, and interface. Requires an InfluxDB data source with Flux enabled and bucket `linux`, plus Telegraf 1.39+ with matching collectors for the custom network measurements. Tested with Grafana 13.0.1, Telegraf 1.39.3, and InfluxDB 2.x.
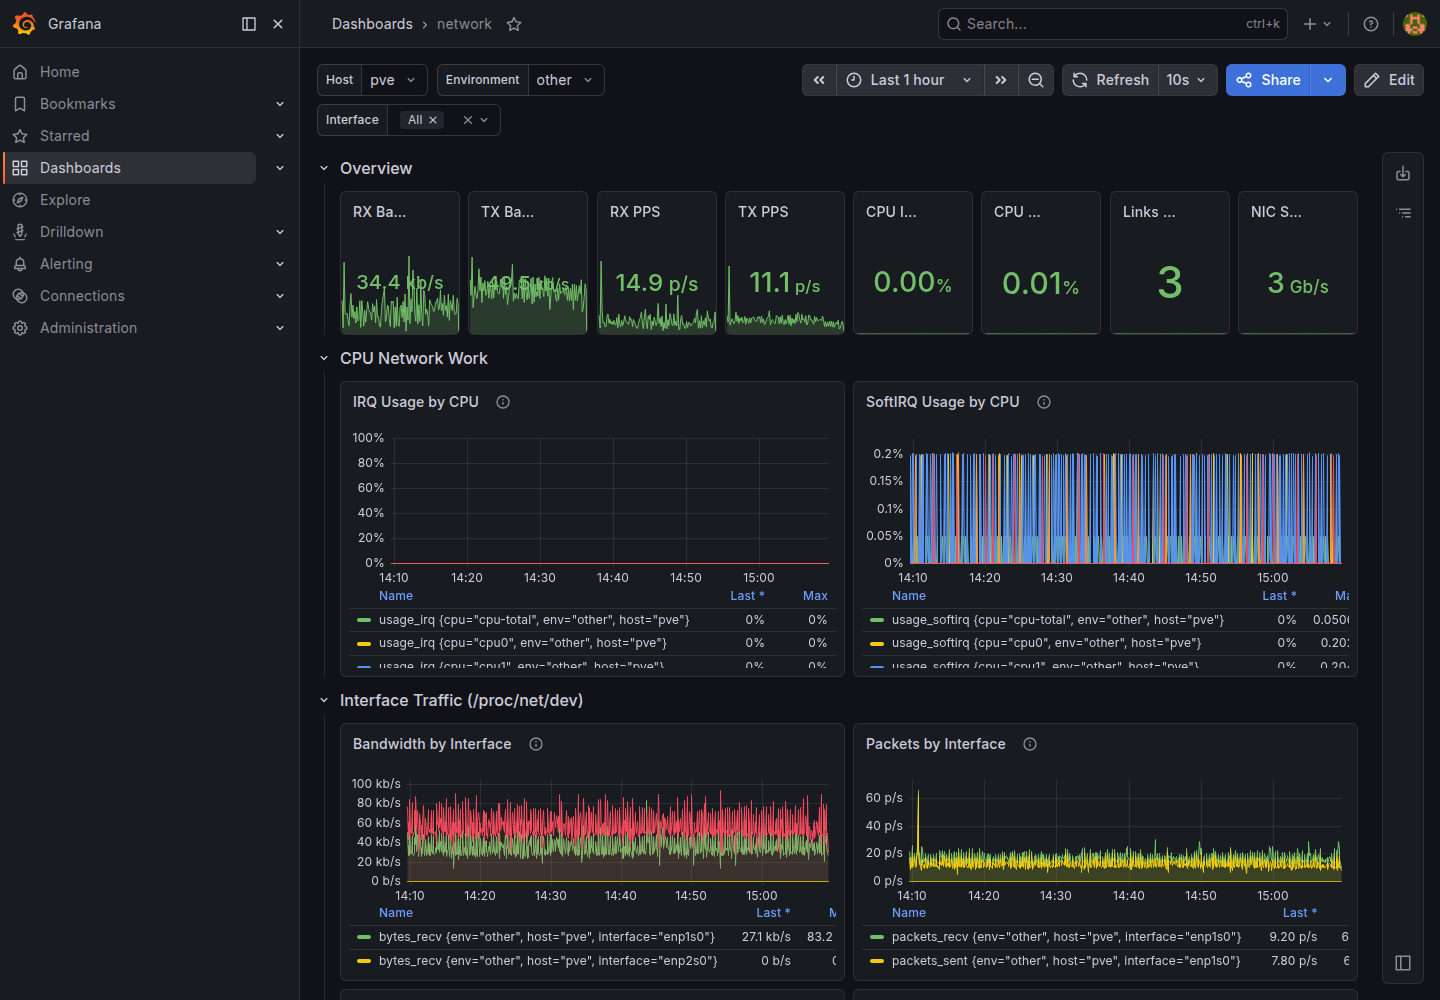
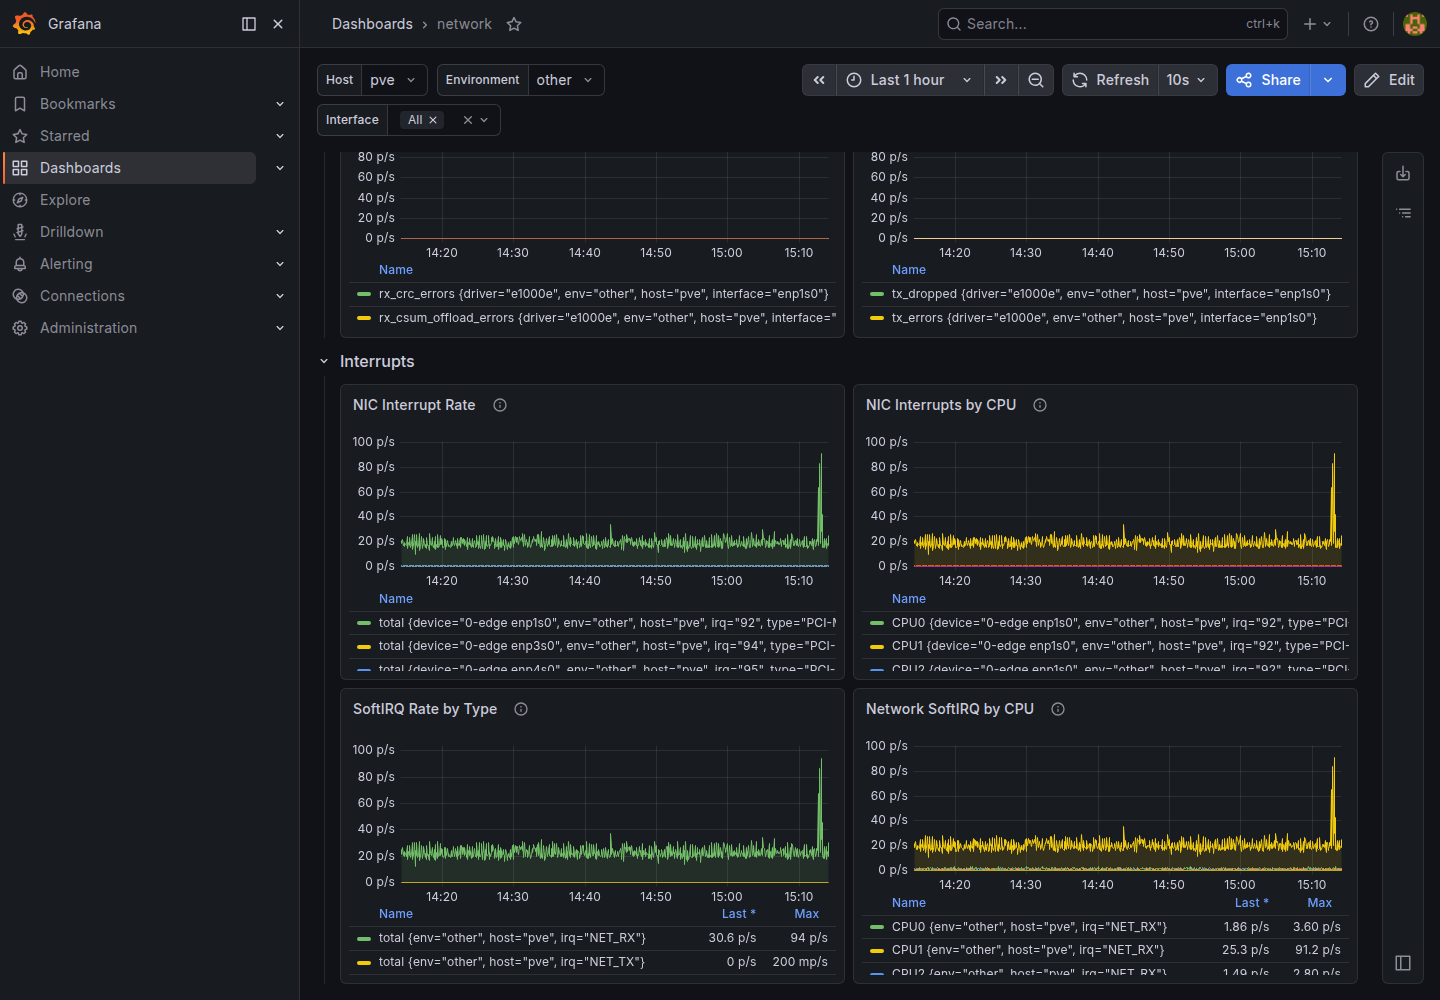
Linux Network Performance Deep Dive
A comprehensive Linux network performance and troubleshooting dashboard for Telegraf and InfluxDB Flux.
Coverage
- CPU modes, IRQ/SoftIRQ, and per-CPU softnet pressure
- Interface bandwidth, PPS, errors, drops, and scope filtering
- Ethtool link, ring, coalescing, and flow-control metrics
- Traffic-control qdisc throughput, backlog, drops, and configuration
- TCP, IP, UDP, ICMP, IPv6, conntrack, socket queue, and buffer pressure
Requirements
- Grafana 13.0.1 or later
- Telegraf 1.39+ with the matching custom network collectors
- InfluxDB 2.x with Flux enabled
- An InfluxDB data source that can read the
linuxbucket
Use the dashboard variables to select host, environment, CPU, interface scope, and interface.
Data source config
Collector config:
Upload an updated version of an exported dashboard.json file from Grafana
| Revision | Description | Created | |
|---|---|---|---|
| Download |

Linux Server

Monitor Linux with Grafana. Easily monitor your Linux deployment with Grafana Cloud's out-of-the-box monitoring solution.
Learn more