
Spring Boot HTTP Client Performance Analyzer
Monitor outbound HTTP traffic in Spring Boot applications

Spring Boot HTTP Client Performance Analyzer
A deep-dive observability dashboard built to monitor outbound HTTP dependencies, downstream microservice calls, and third-party REST integrations in Spring Boot applications using Micrometer and Prometheus.
Designed for rapid root-cause analysis when downstream dependencies degrade, this dashboard tracks client availability, latency regressions, and individual client endpoint distributions.
🚀 Key Features
Downstream Golden Signals:
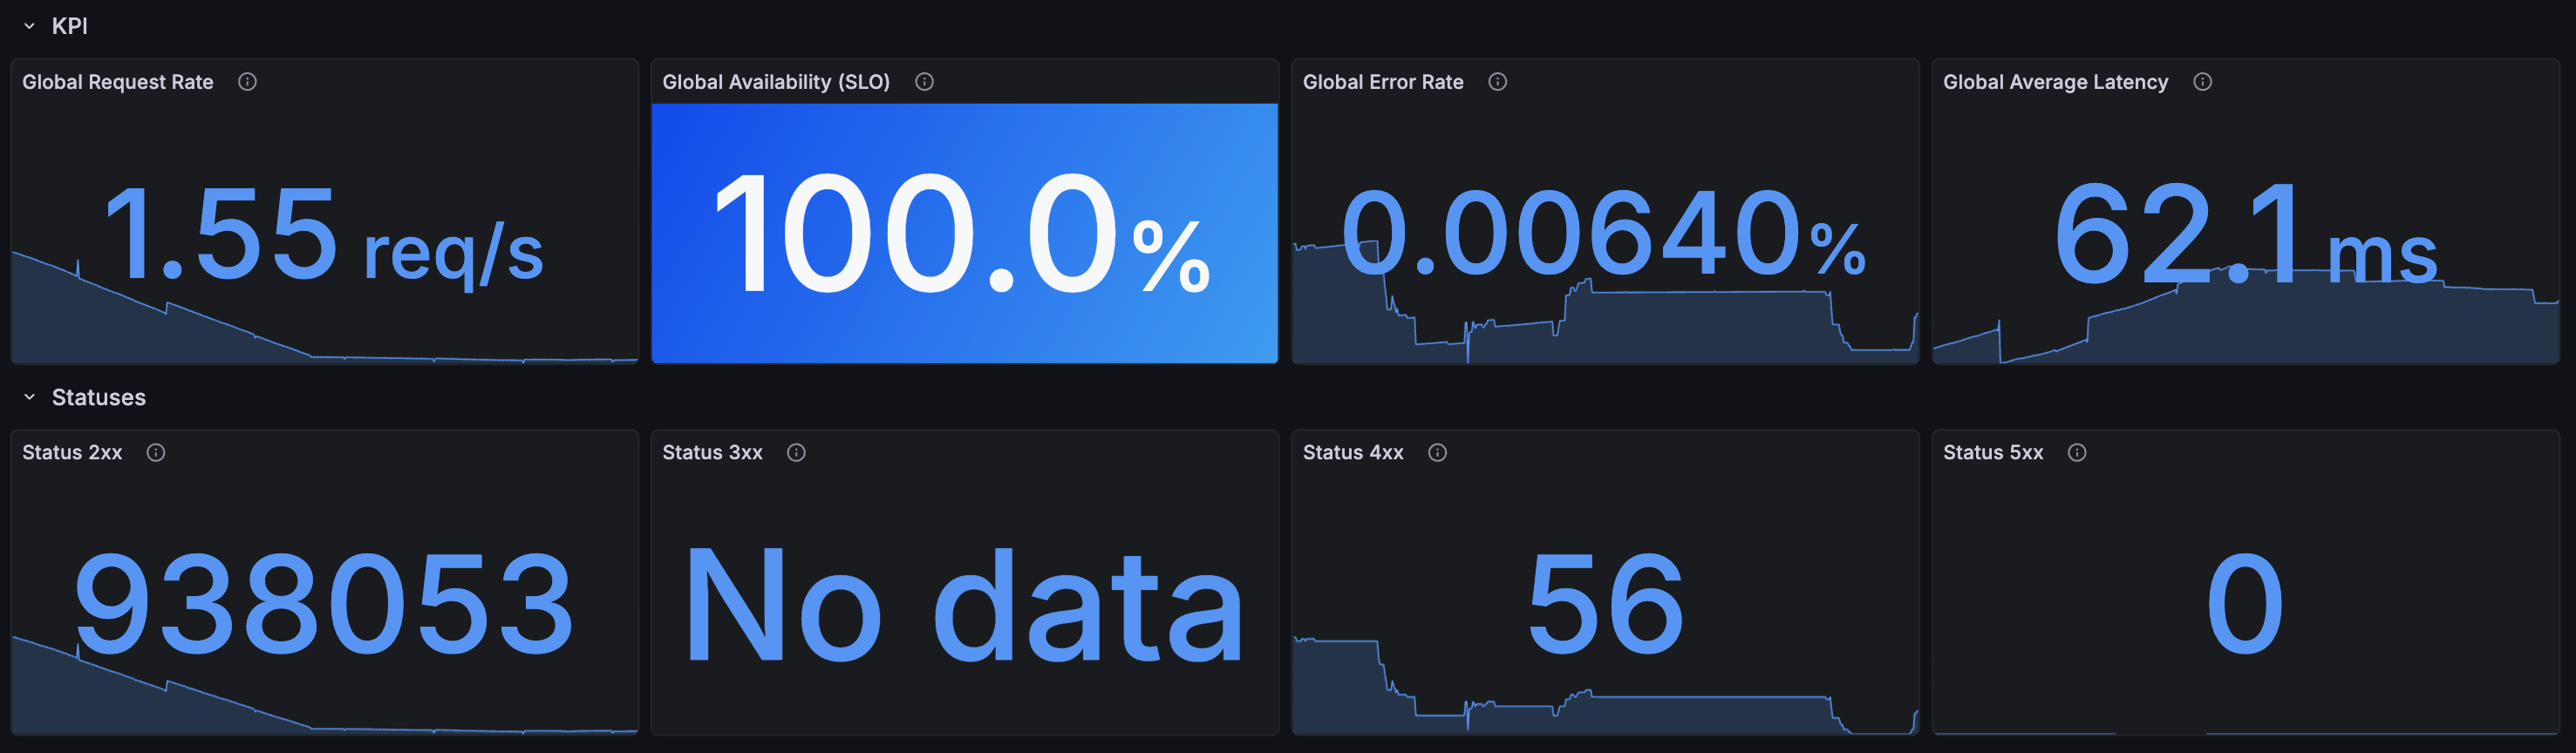
- Outgoing Request Rate, Downstream Availability SLO compliance, Error Rates, and Global Average Latency.
- Outbound HTTP status classification (2xx, 3xx, 4xx, 5xx).
Downstream Trendlines & Baseline Overlays:
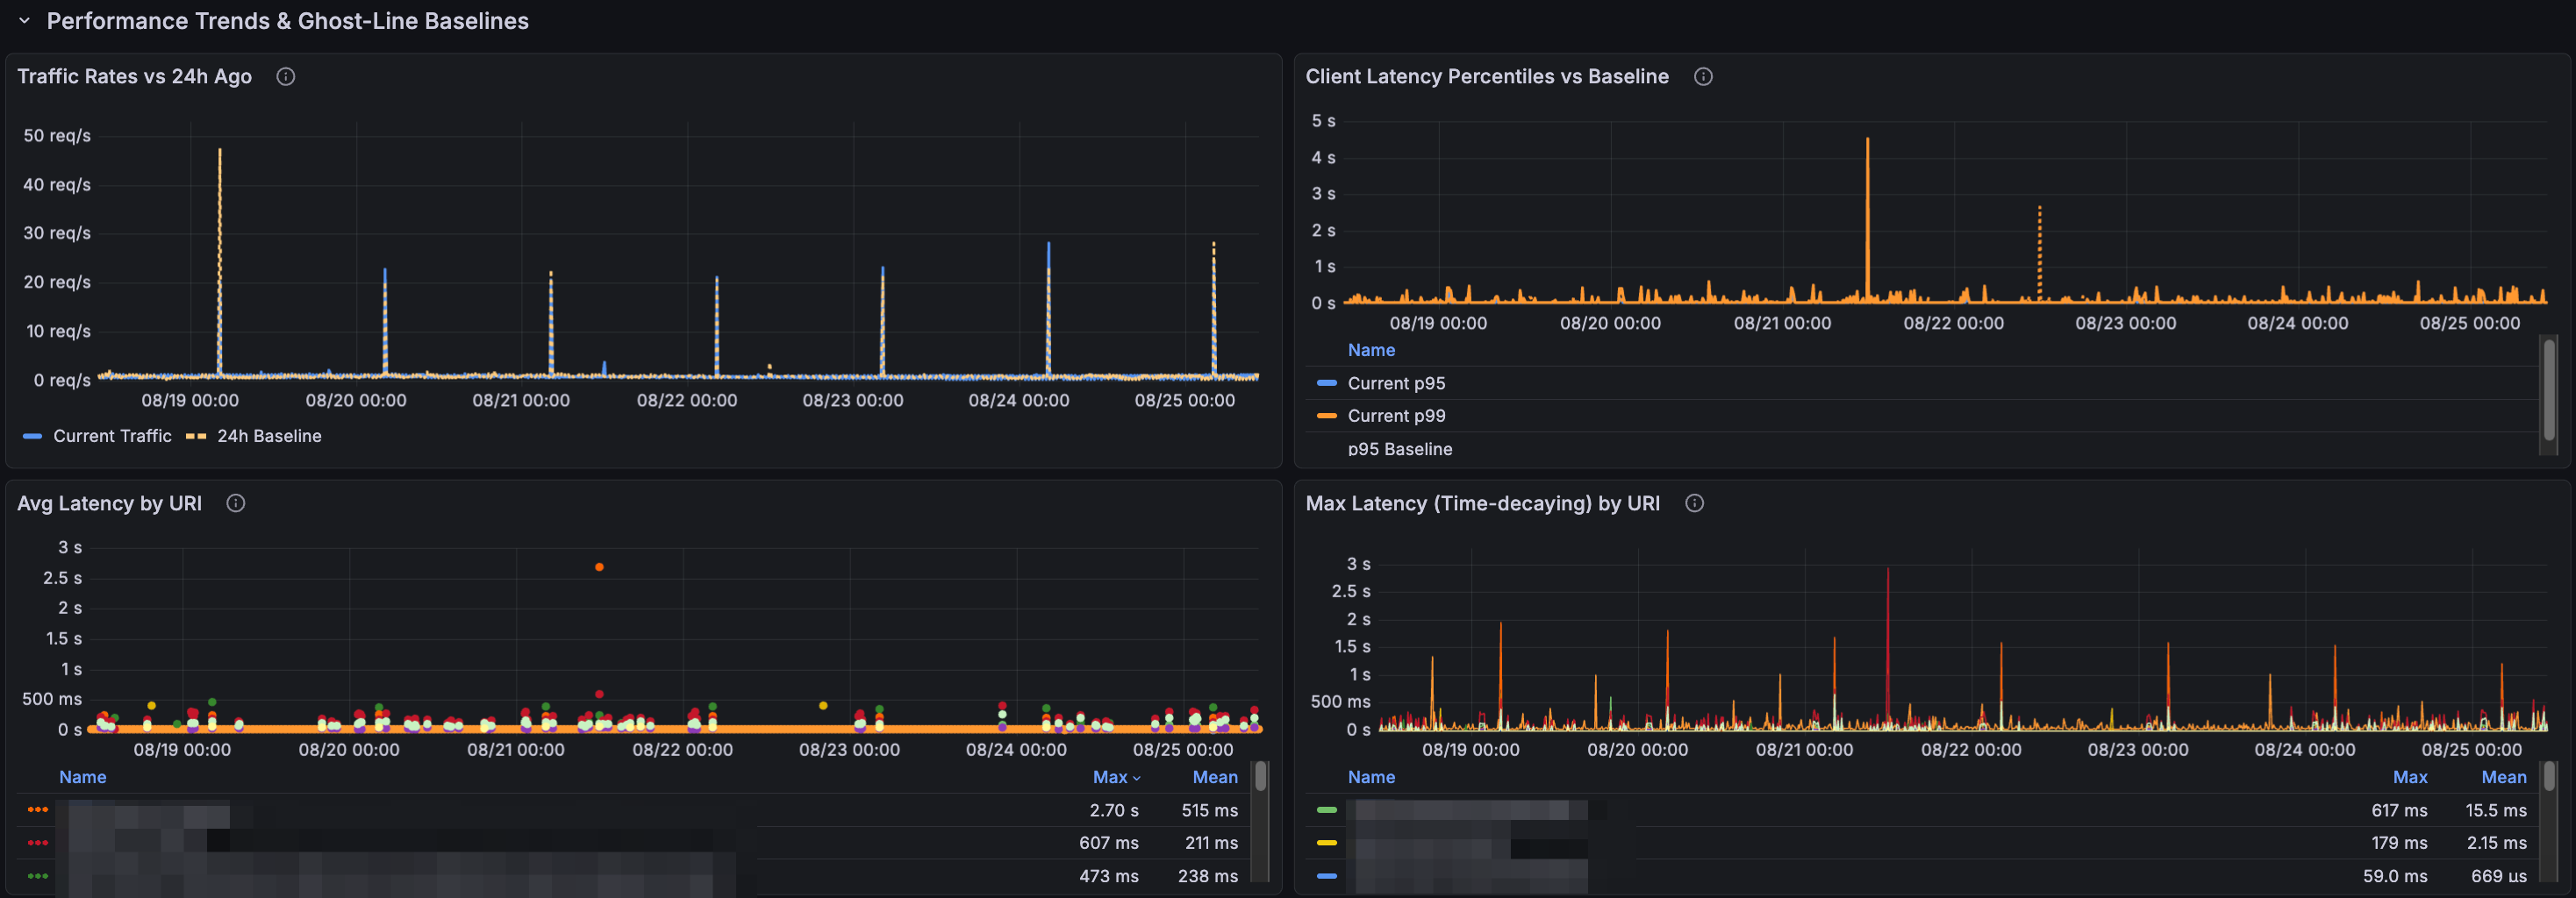
- Outbound traffic volume compared against 24-hour historical curves.
- p95 and p99 tail-latency analysis against yesterday's p95 baseline to isolate remote slowdowns.
Automated Regression & Error Discovery:
- Downstream Degradation Tracker: Surfaces external client calls running >20% slower than their 24h baseline.
- High-Failure Client Matrix: Identifies misbehaving remote routes, status codes, and failure proportions.
Client Context & Deep-Dive Profiling:
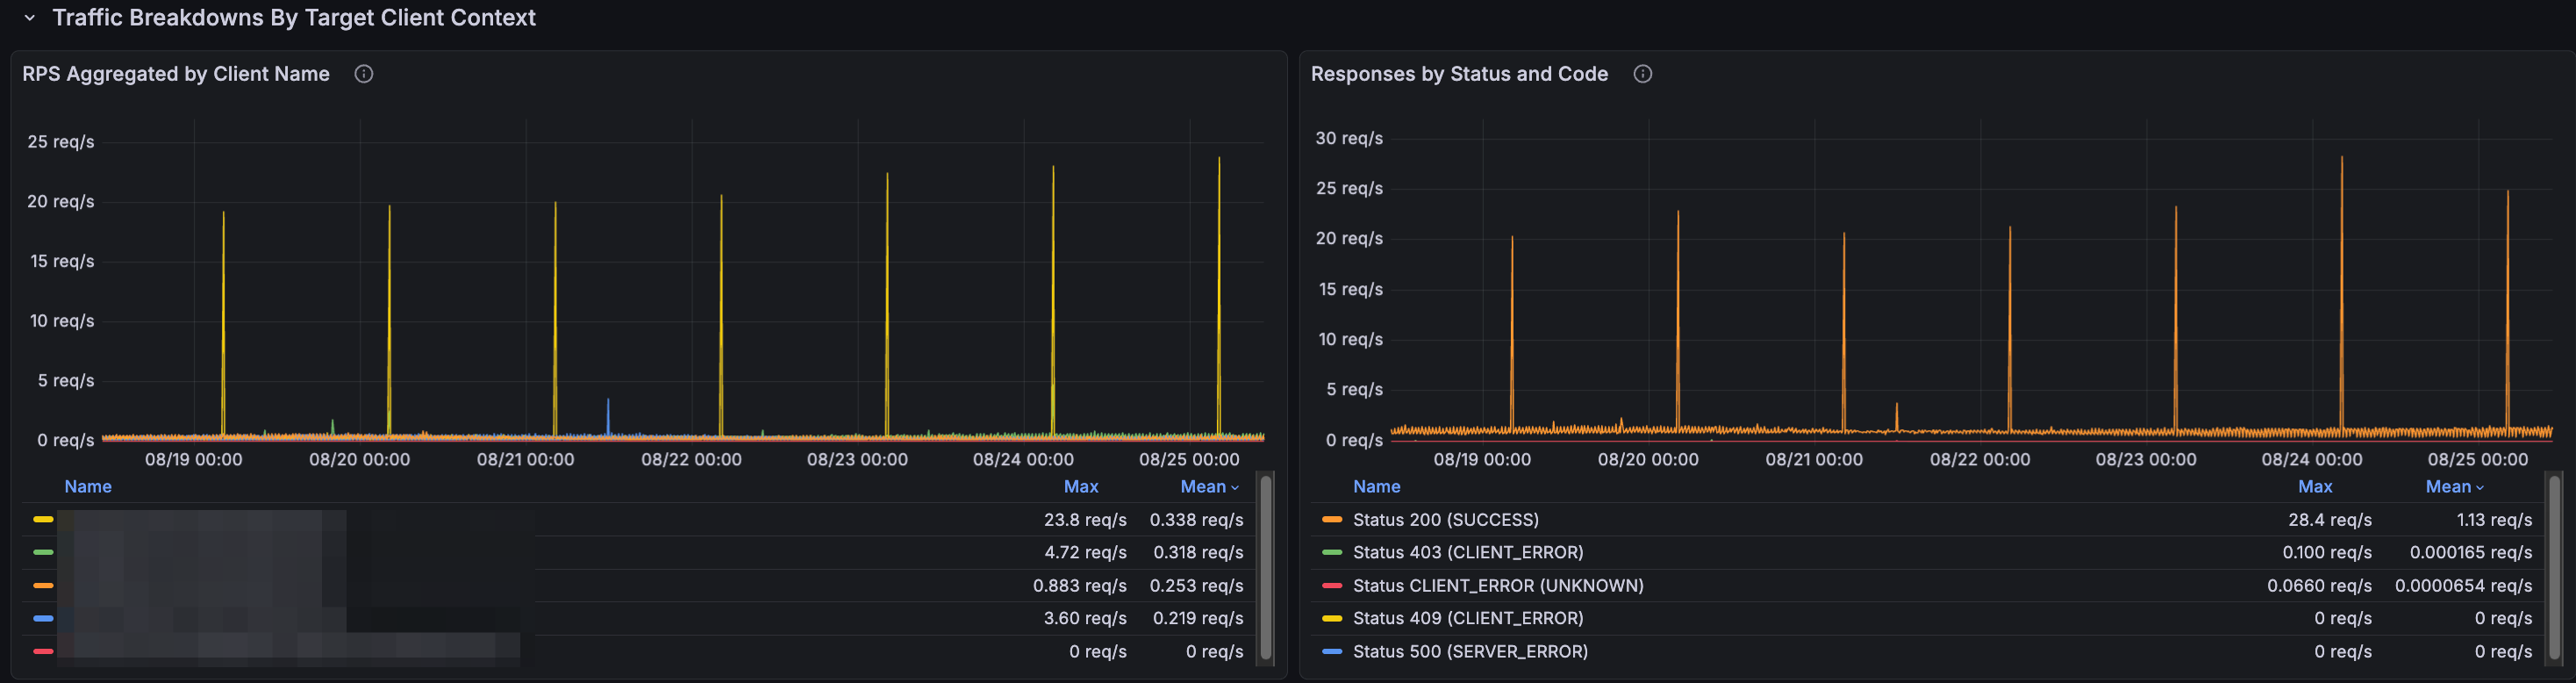
- RPS aggregated by
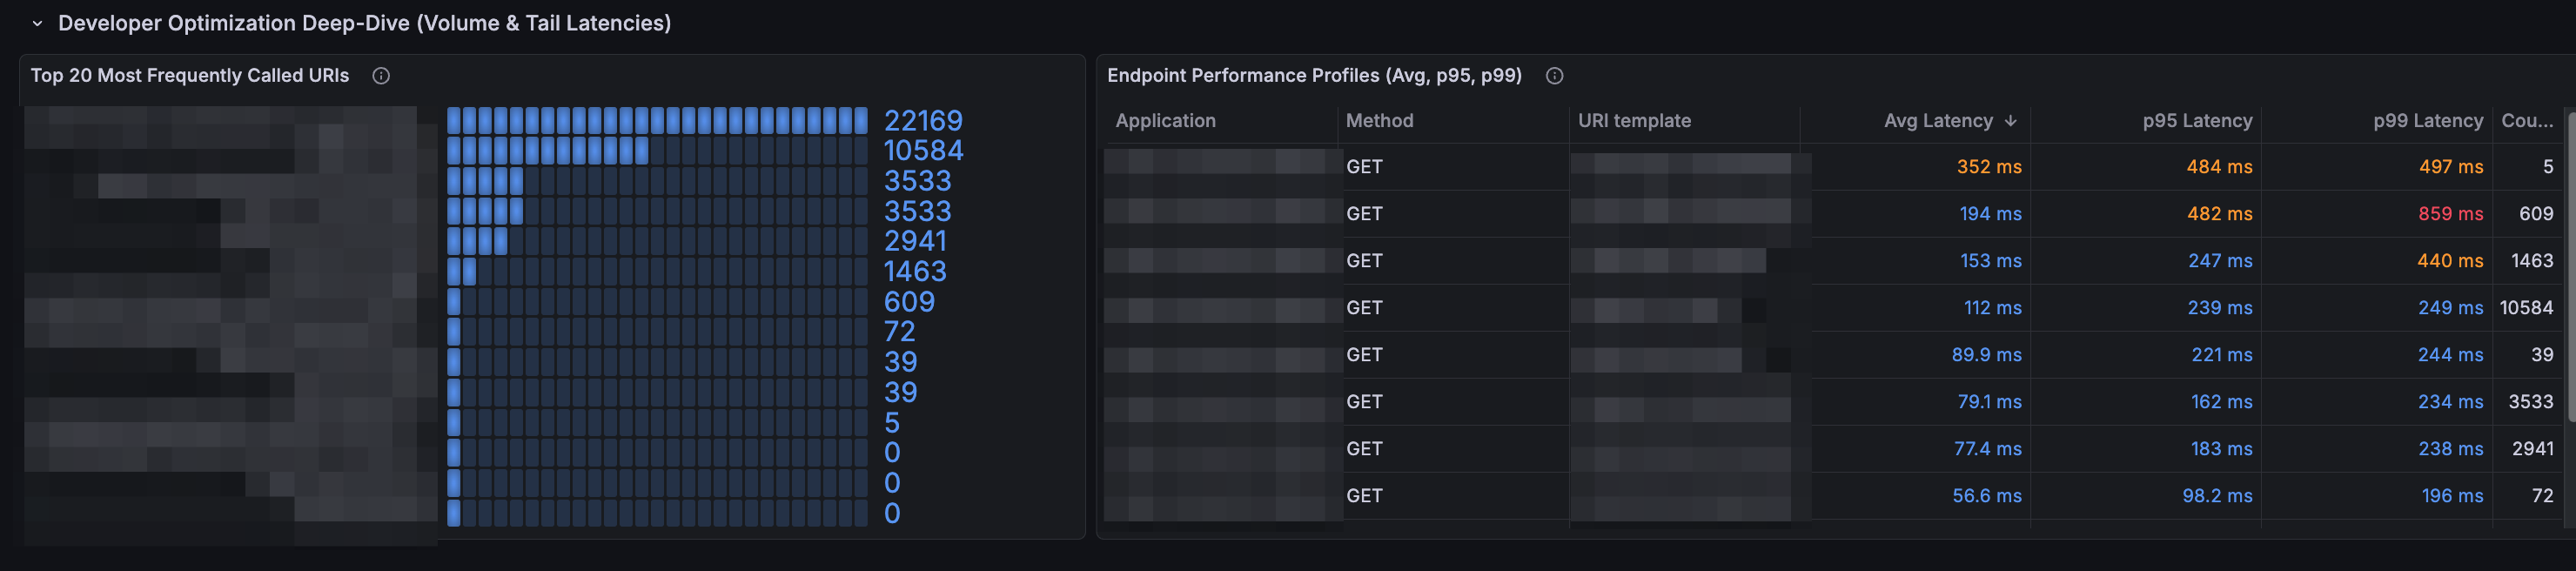
client_nameto view dependency distribution across downstream targets. - URI profiling grid cross-referencing outbound call count, average response time, p95, and p99 tail latency.
- RPS aggregated by
⚙️ Platform Adaptation & Configuration
This dashboard queries standard Spring Boot client metrics (http_client_requests_seconds_*).
Depending on your platform orchestration, adapt the template variables under Dashboard Settings → Variables:
| Variable | Cloud Foundry Default | Kubernetes / Standard Equivalent | Query Definition to Use |
|---|---|---|---|
$Namespace | space_name | namespace | label_values(http_client_requests_seconds_count, namespace) |
$Application | app_name | app, application, or job | label_values(http_client_requests_seconds_count{namespace="$Namespace"}, app) |
$Client | client_name | client_name or client | label_values(http_client_requests_seconds_count{app=~"$Application", namespace="$Namespace"}, client_name) |
$URI | uri | uri | label_values(http_client_requests_seconds_count{client_name=~"$Client", app=~"$Application", namespace="$Namespace"}, uri) |
Note on
client_name:client_nameis populated automatically when using Spring Boot'sRestClient.Builder,WebClient.Builder,RestTemplateBuilder, or HTTP Interfaces with Micrometer observation enabled.
📋 Requirements
- Grafana: v10.0+ (Tested on v12.3.x)
- Data Source: Prometheus
- Framework: Spring Boot 2.x / 3.x with
micrometer-registry-prometheus - Prometheus Metric Family:
http_client_requests_seconds_*(sum, count, bucket, max) - Standard Tags Needed:
client_name,uri,method,status,outcome
Data source config
Collector config:
Upload an updated version of an exported dashboard.json file from Grafana
| Revision | Description | Created | |
|---|---|---|---|
| Download |

Apache HTTP Server

Easily monitor Apache HTTP Server, an open source HTTP server for modern operating systems including UNIX and Windows, with Grafana Cloud's out-of-the-box monitoring solution.
Learn more