
Spring Boot HTTP Server Performance Analyzer
Monitor inbound HTTP traffic in Spring Boot applications
Spring Boot HTTP Server Performance Analyzer
A production-grade SRE and performance engineering dashboard designed for monitoring inbound HTTP traffic in Spring Boot applications instrumented with Micrometer and Prometheus.
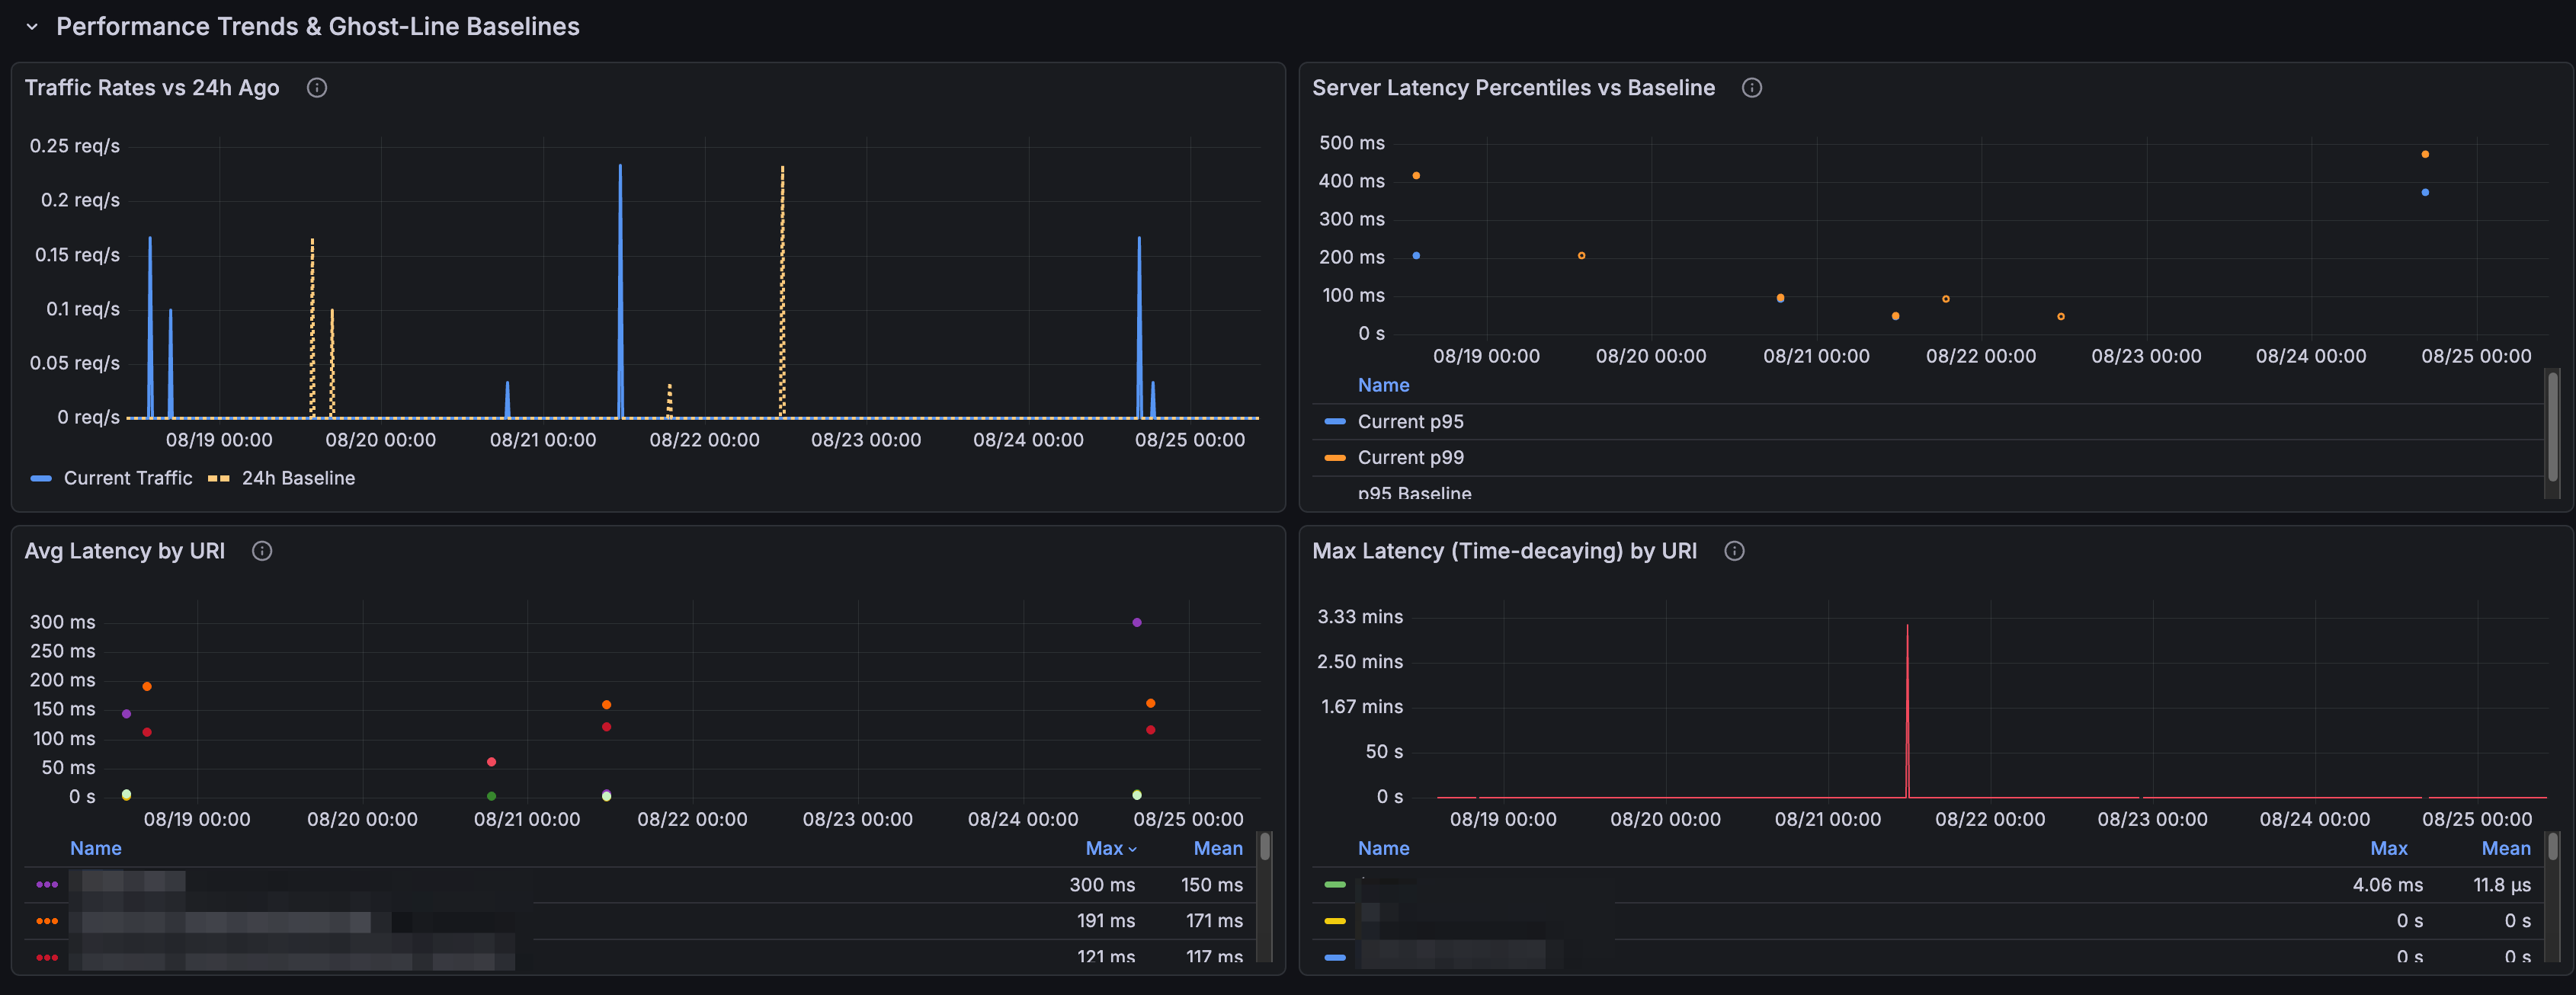
This dashboard pairs real-time golden signals with 24-hour historical baselines ("ghost-lines") to immediately surface latency regressions, throughput anomalies, and endpoint-level failures.
🚀 Key Features
High-Level KPIs & SLO Compliance:
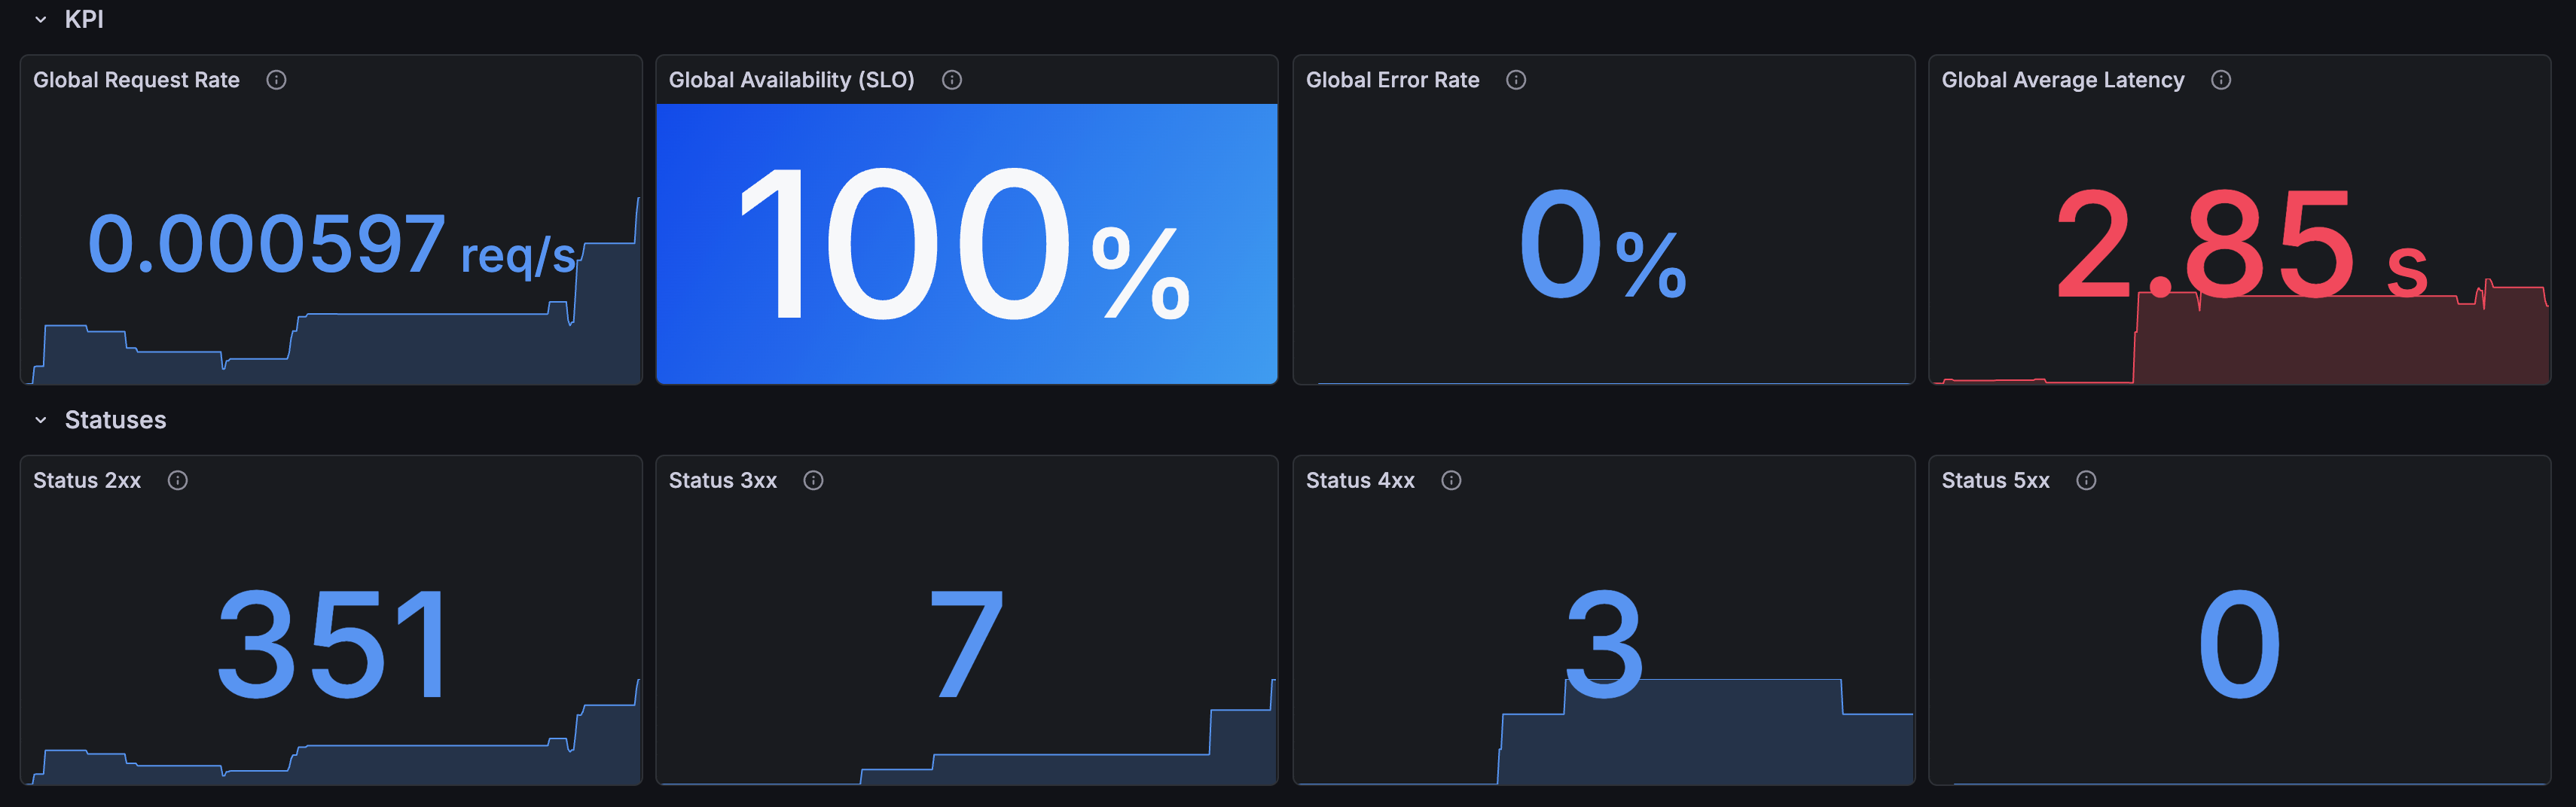
- Global Request Rate (RPS), Error Rate (5xx), and Macro Average Latency.
- Target-based Availability SLO Gauge (>= 99.5%) with accessible color-coding.
- Full breakdown of HTTP status code families (2xx, 3xx, 4xx, 5xx).
Historical Baseline Comparisons (24h Ghost-Lines):
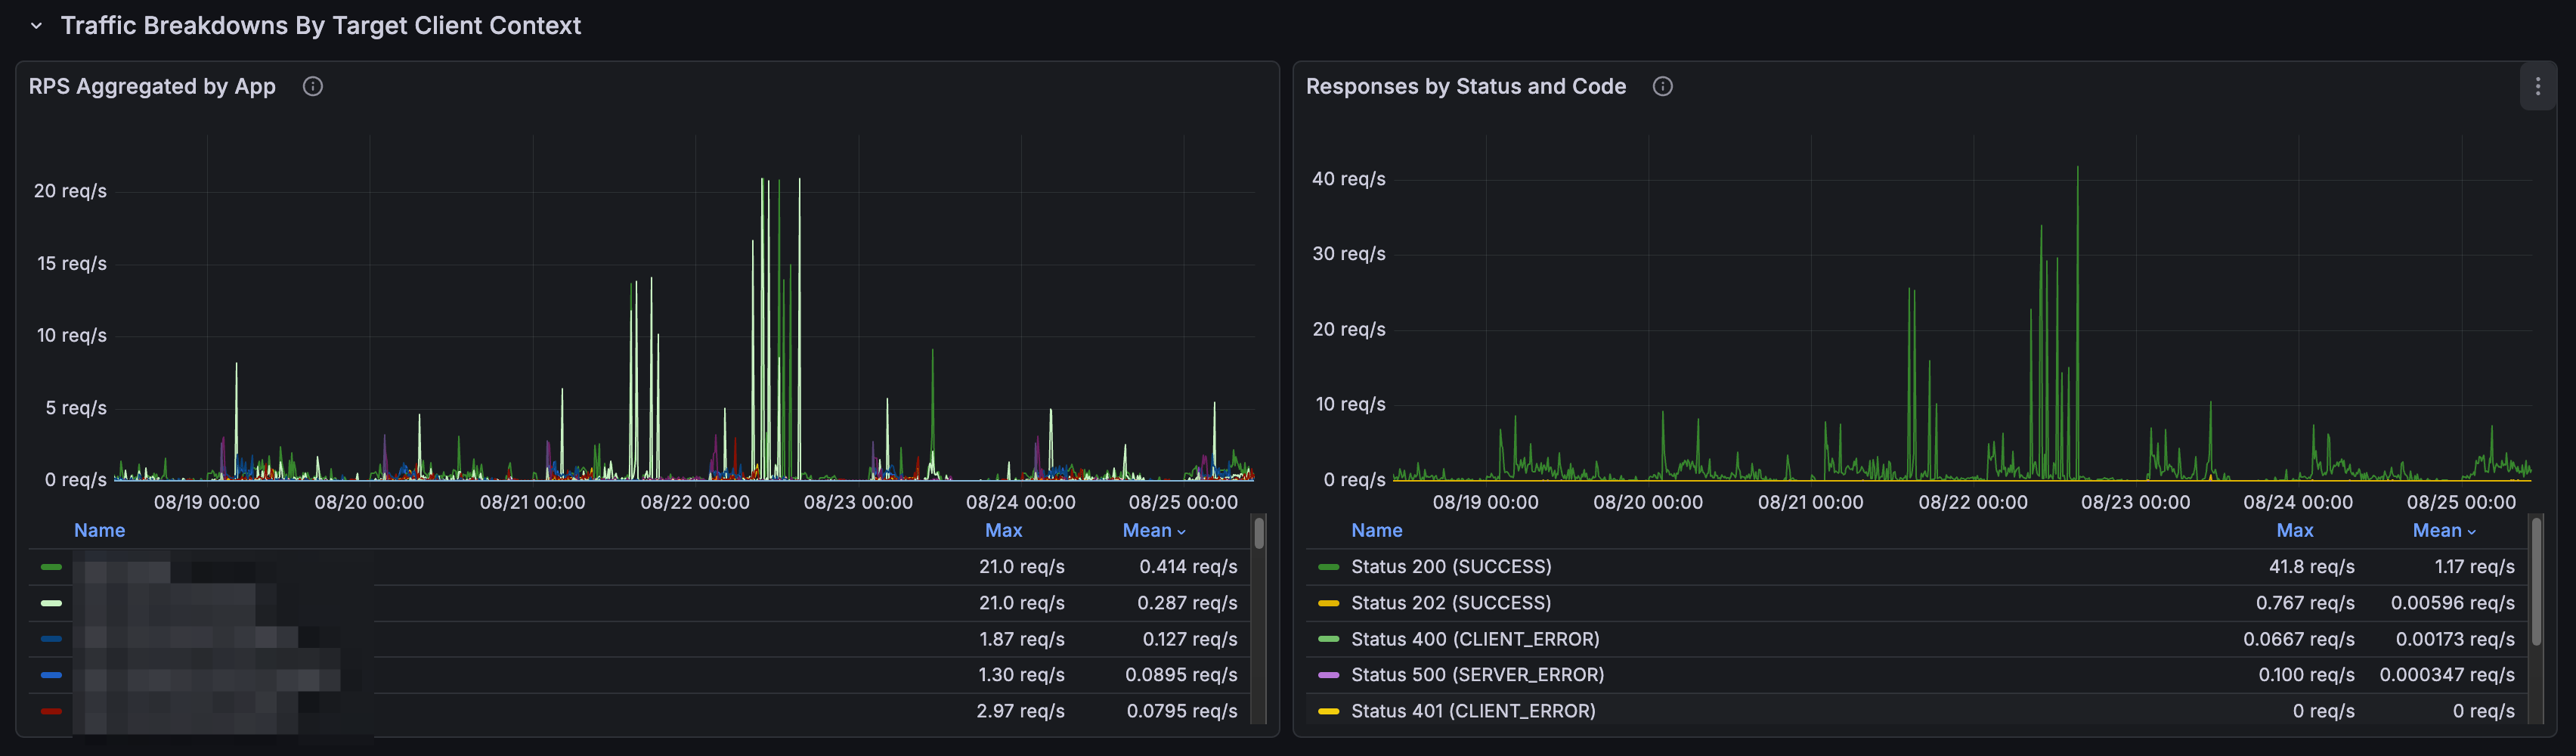
- Real-time traffic volume plotted against a 24-hour historical offset.
- Server latency percentiles (p95, p99) contrasted with yesterday's running baseline.
Automated Anomaly & Failure Triage:
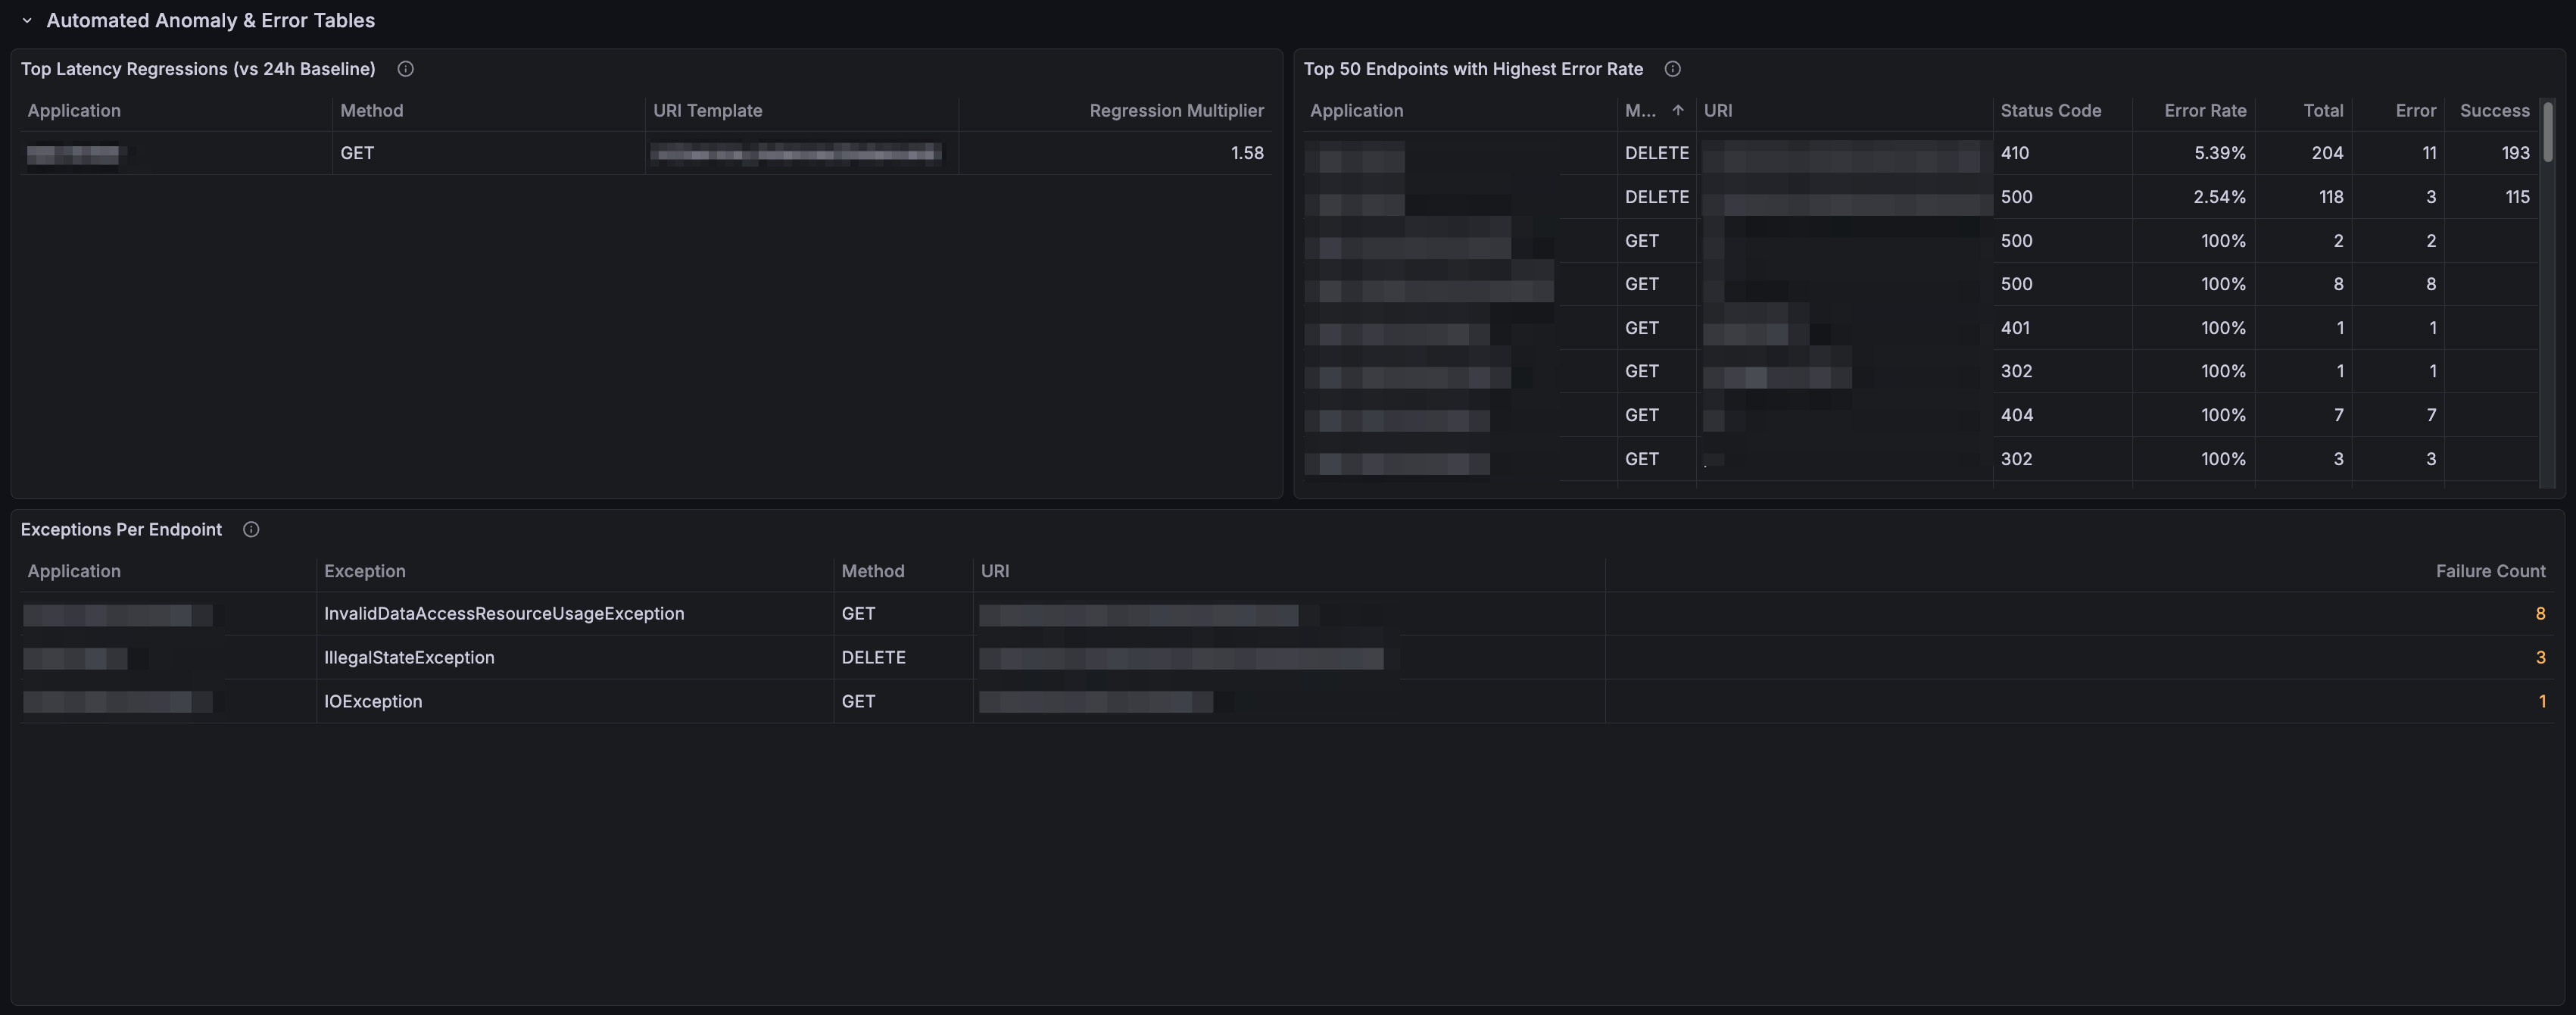
- Top Latency Regressions Table: Automatically captures and ranks endpoints running >20% slower than their 24h baseline.
- Top 50 Failing Endpoints: Detailed failure footprints showing error rates, success counts, and HTTP status codes per route.
- Unhandled Exceptions Matrix: Code-level diagnostics mapping raw Java exception classes directly to the throwing URI templates.
Developer Optimization & Tail-Latency Profiles:
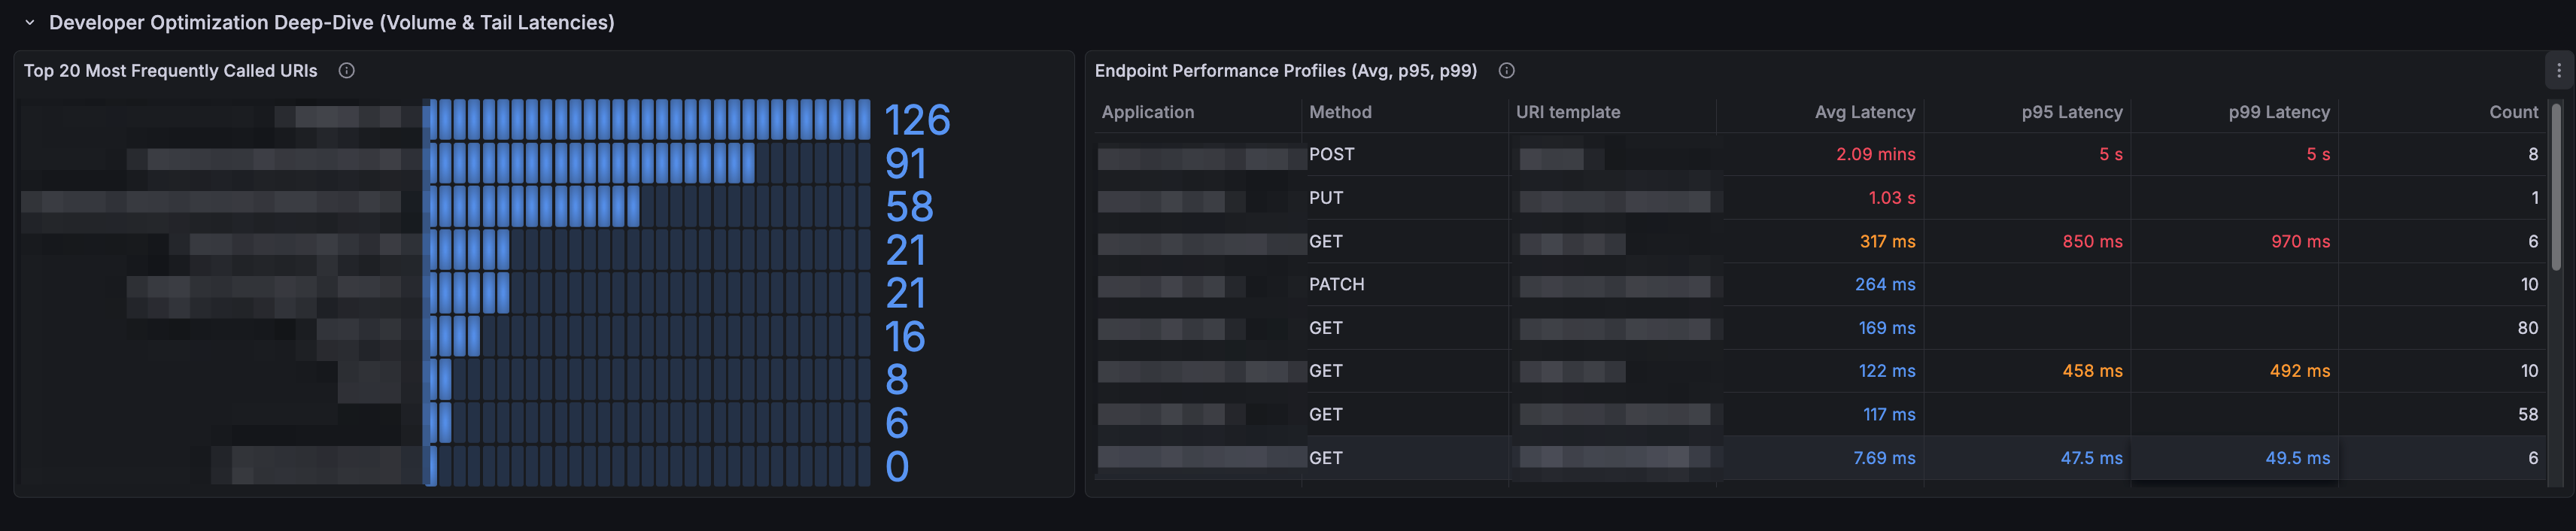
- Top 20 most frequently invoked endpoints for caching and execution profiling.
- Side-by-side comparison of Average, p95, and p99 response times per URI.
⚙️ Platform Adaptation & Configuration
This dashboard relies on standard Spring Boot Actuator/Micrometer Prometheus metrics (http_server_requests_seconds_*).
By default, the dashboard template variables use Cloud Foundry / Tanzu label conventions (space_name and app_name). If you run on Kubernetes, Docker, or Bare Metal, adjust the variables under Dashboard Settings → Variables:
| Variable | Cloud Foundry Default | Kubernetes / Standard Equivalent | Query Definition to Use |
|---|---|---|---|
$Namespace | space_name | namespace | label_values(http_server_requests_seconds_count, namespace) |
$Application | app_name | app, application, or job | label_values(http_server_requests_seconds_count{namespace="$Namespace"}, app) |
$URI | uri | uri | label_values(http_server_requests_seconds_count{app=~"$Application", namespace="$Namespace"}, uri) |
Single-Namespace / No-Namespace Environments: If you do not tag metrics by namespace, you can edit the
$Namespacevariable and set Hide: Variable (or enable Include All with custom all value.*).
📋 Requirements
- Grafana: v10.0+ (Tested on v12.3.x)
- Data Source: Prometheus
- Framework: Spring Boot 2.x / 3.x with
micrometer-registry-prometheus - Prometheus Metric Family:
http_server_requests_seconds_*(sum, count, bucket, max) - Standard Tags Needed:
uri,method,status,outcome,exception
Data source config
Collector config:
Upload an updated version of an exported dashboard.json file from Grafana
| Revision | Description | Created | |
|---|---|---|---|
| Download |

Apache HTTP Server

Easily monitor Apache HTTP Server, an open source HTTP server for modern operating systems including UNIX and Windows, with Grafana Cloud's out-of-the-box monitoring solution.
Learn more