
z/VM FICON Usage by Channel
This dashboard visualizes z/VM FICON channel throughput using Performance Toolkit EPM data stored in InfluxDB.
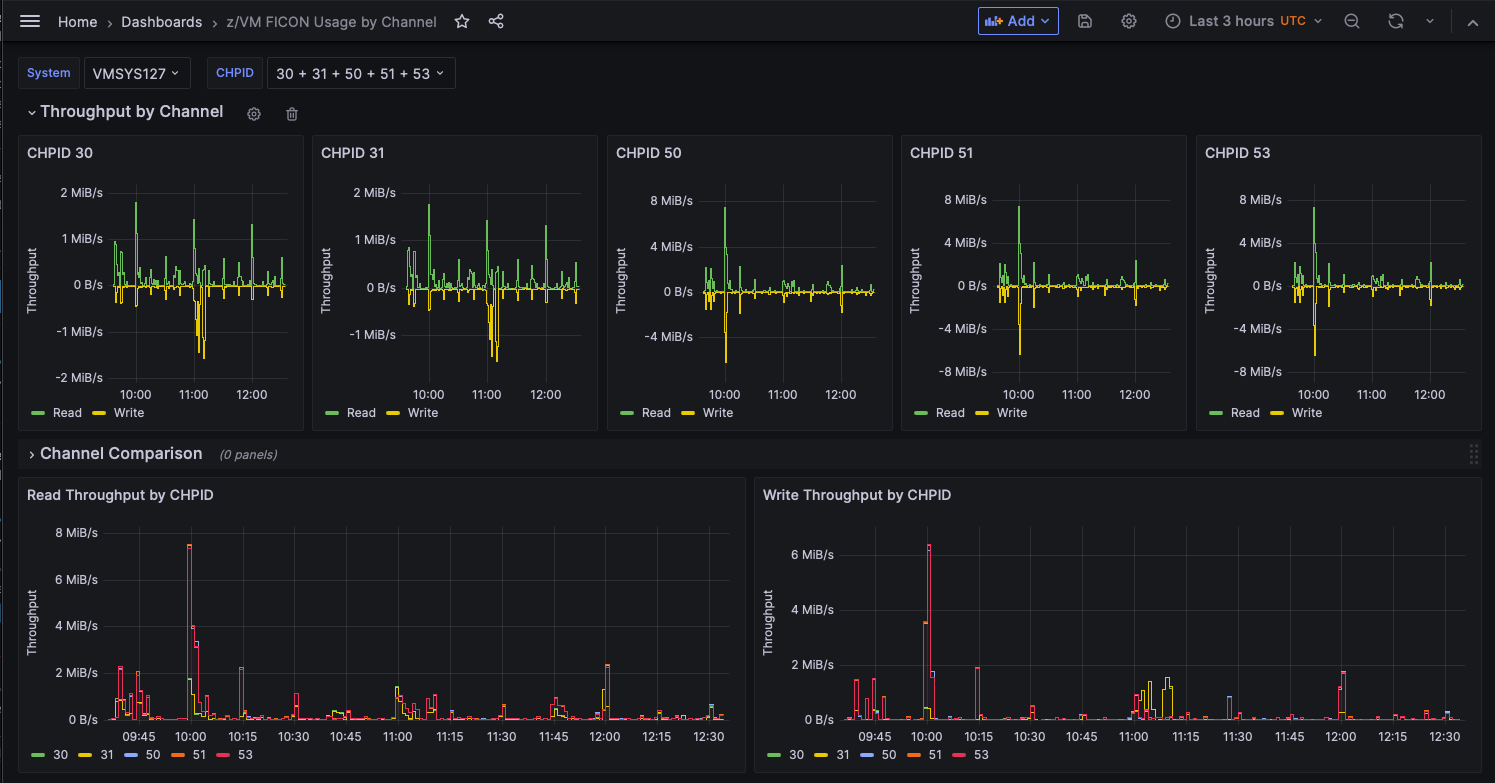
This dashboard visualizes z/VM FICON channel throughput using Performance Toolkit EPM data stored in InfluxDB. Individual CHPID panels display read and write throughput over time, while comparison charts allow quick analysis of channel utilization across the selected system. Useful for capacity planning, performance monitoring, workload balancing, and identifying heavily utilized FICON channels. Requires sytepm data with system and chpid tags.
This dashboard is licensed by IBM under the Apache 2.0 License and is provided ‘as is’ without warranty, representation, support, maintenance or an obligation to issue updates.
Data source config
Collector config:
Upload an updated version of an exported dashboard.json file from Grafana
| Revision | Description | Created | |
|---|---|---|---|
| Download |