
OpsiMate
Self-monitoring for OpsiMate: alert inventory and triage backlog, ingestion and lifecycle throughput, API latency, and server runtime health.
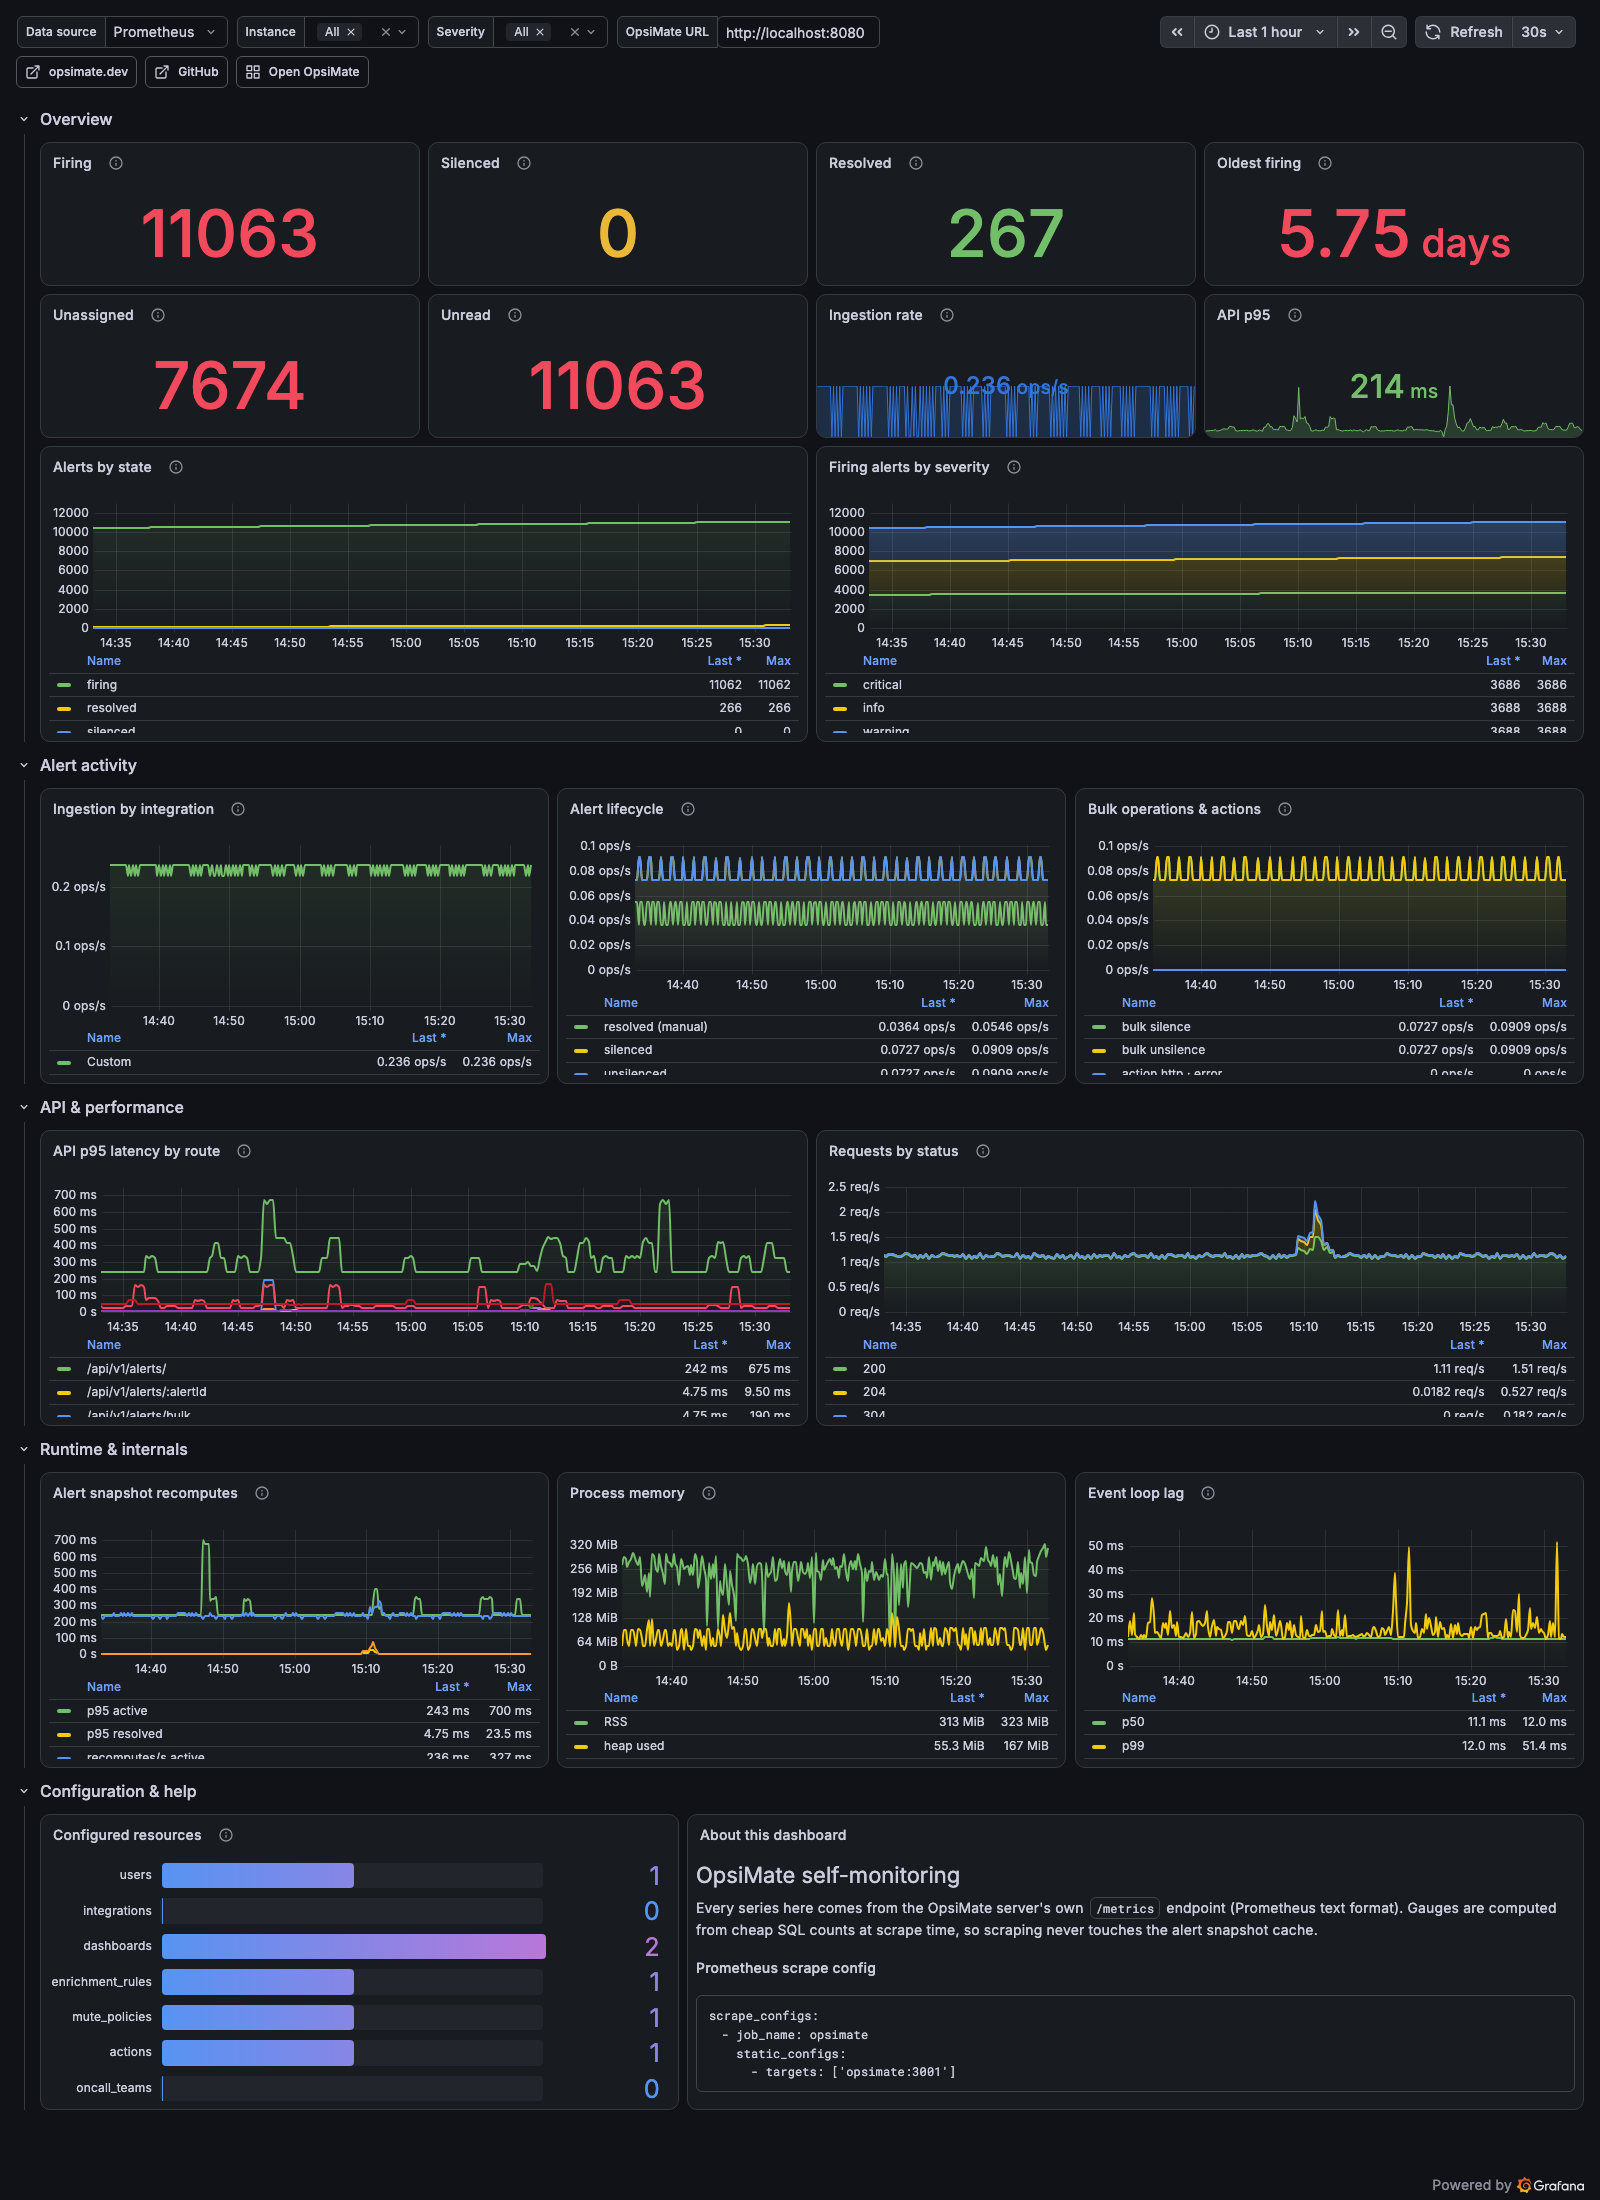
OpsiMate self-monitoring
Dashboard for OpsiMate, the open-source alert management platform. Every series comes from the OpsiMate server's built-in /metrics endpoint, so there is nothing to install beyond a Prometheus scrape.
What it shows
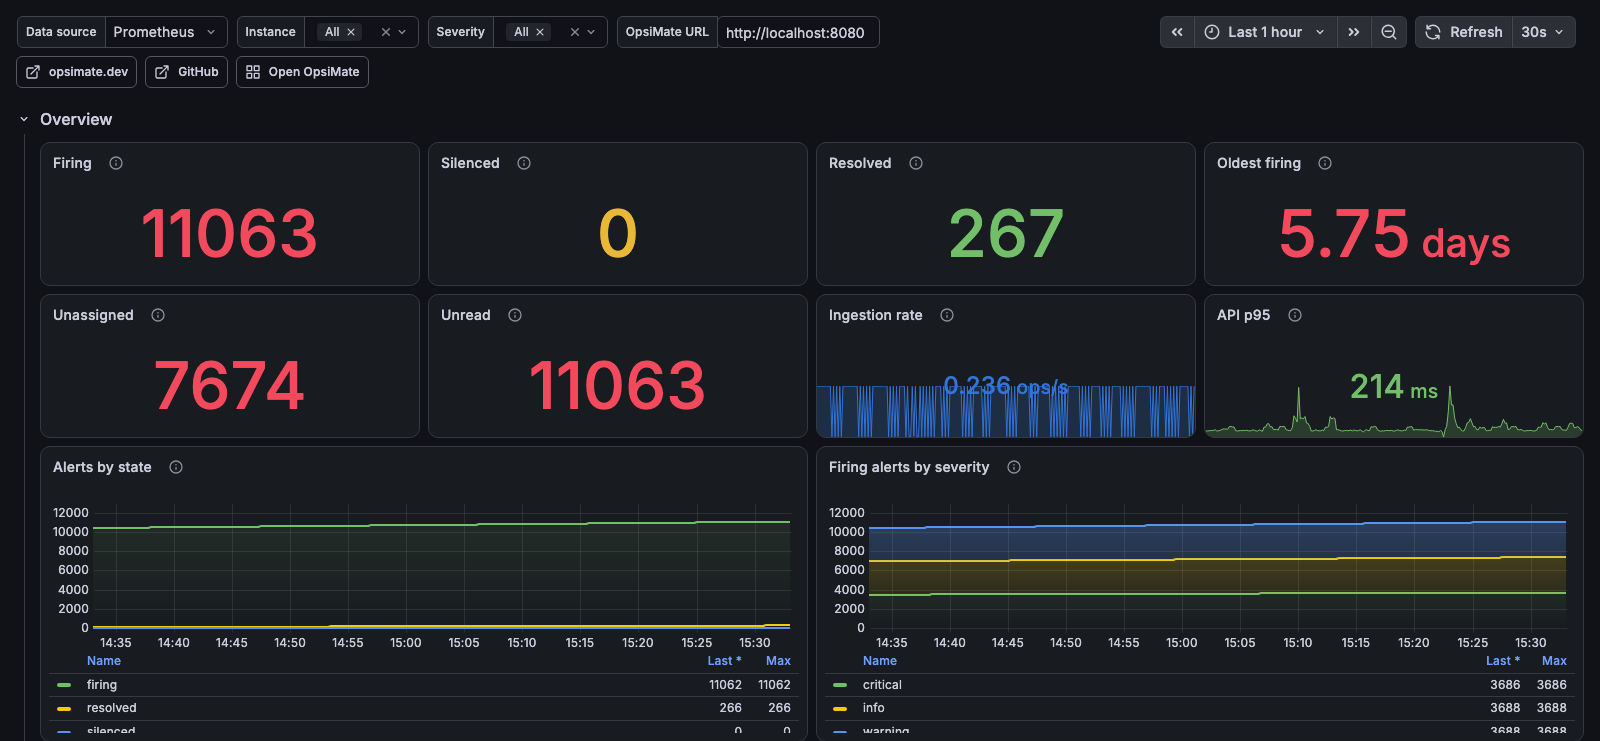
- Overview — firing / silenced / resolved inventory, the unassigned and unread triage backlog, age of the oldest firing alert, ingestion rate and API p95
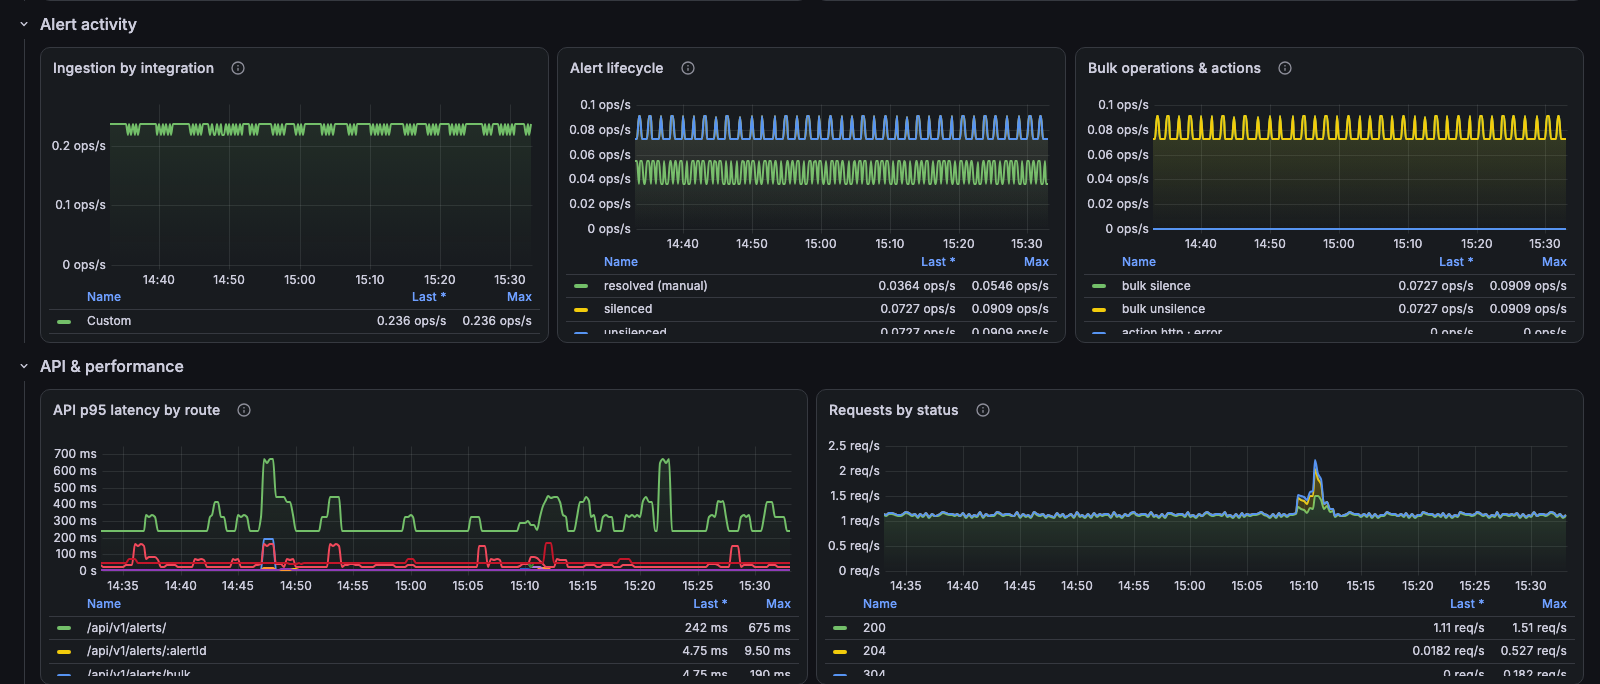
- Alert activity — ingestion by integration (Grafana, Datadog, Zabbix, Uptime Kuma, GCP, custom webhooks), alert lifecycle (manual vs automatic resolves, silence and unsilence), bulk operations and action executions with their outcome
- API & performance — p95 latency by matched route, request rate by status code
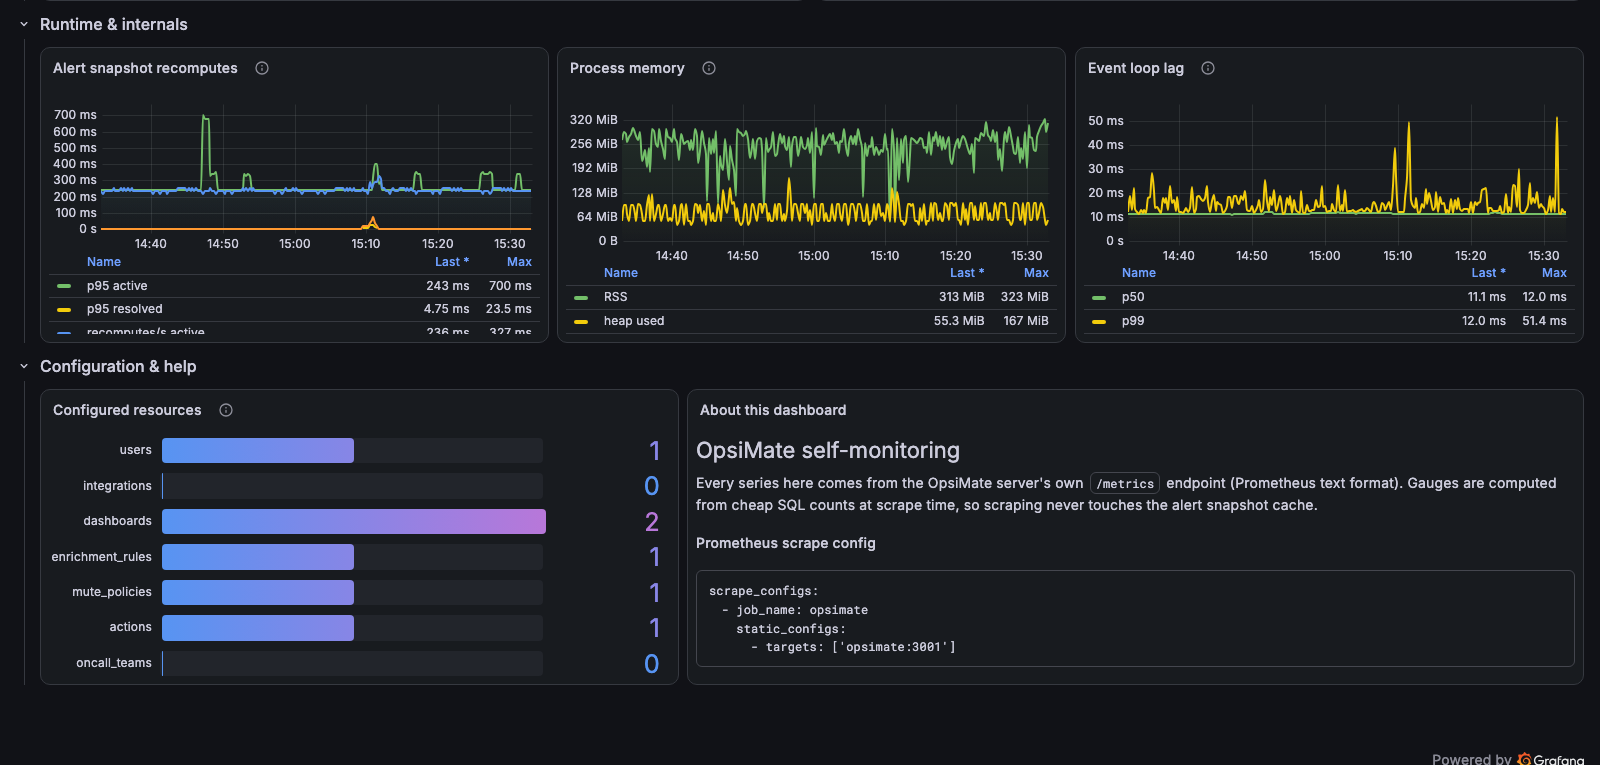
- Runtime & internals — alert snapshot recompute duration, process memory, event loop lag
- Configuration & help — inventory of users, integrations, dashboards, enrichment rules, mute policies, actions and on-call teams, plus setup notes
Every panel carries a description explaining what the metric means and what a bad value looks like.
Setup
Point Prometheus at the OpsiMate server:
scrape_configs:
  - job_name: opsimate
    static_configs:
      - targets: ['opsimate:3001']
The endpoint is open by default so it is scrape-friendly. If the server sets METRICS_TOKEN, add matching authorization credentials to the scrape job.
Gauges are computed from cheap SQL counts at scrape time and never touch the alert snapshot cache, so a scrape costs roughly 9 ms even at 10,000 alerts.
Variables
Instance and Severity filter the panels. Set OpsiMate URL to your own deployment so the panel links open your alert list.
Requires an OpsiMate server build that includes the /metrics endpoint.
Data source config
Collector config:
Upload an updated version of an exported dashboard.json file from Grafana
| Revision | Description | Created | |
|---|---|---|---|
| Download |