
SA Overview
Support Overview is a Kubernetes/Prometheus dashboard for monitoring the health of a Sisense cluster at a glance. It rolls up 13 automated health checks (node/pod CPU and RAM over 80%, pod crash or error states, HPA saturation, build-pod concurrency, MongoDB memory, disk usage, pod/container restart frequency, resource-limit changes, and container restart frequency) into a single 0–100 Health Score gauge, with a breakdown panel showing exactly which checks are currently failing.
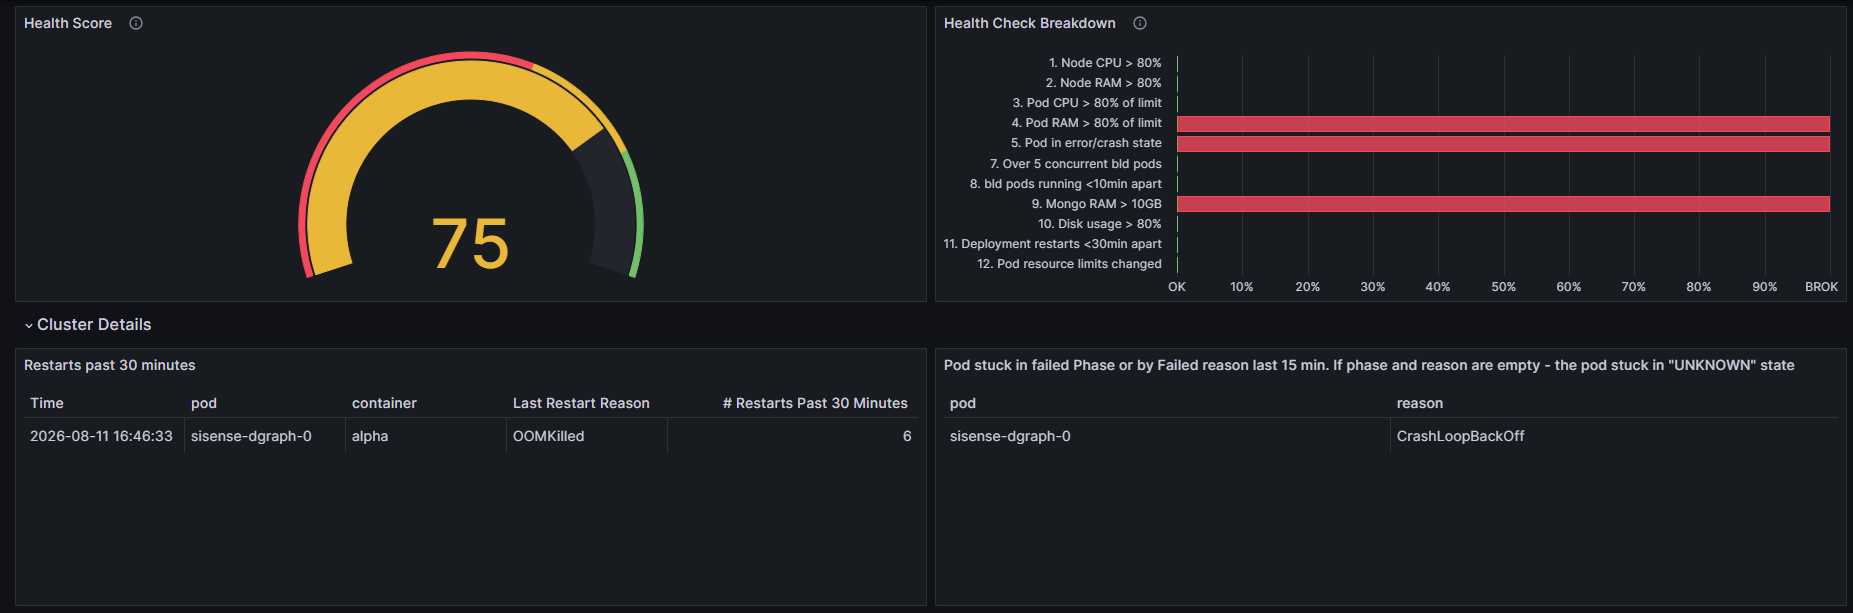
The SA Overview dashboard uses the __expr__ and prometheus data sources to create a Grafana dashboard with the barchart, gauge, stat, state-timeline, table and timeseries panels.
Data source config
Collector type:
Collector plugins:
Collector config:
Revisions
Upload an updated version of an exported dashboard.json file from Grafana
| Revision | Description | Created | |
|---|---|---|---|
| Download |