
Grafana Dashboard for Veeam Node Exporter
Node-level health dashboard for VBR v13.1's built-in Prometheus node_exporter (Veeam Software Appliance, and Veeam Infrastructure Appliances)
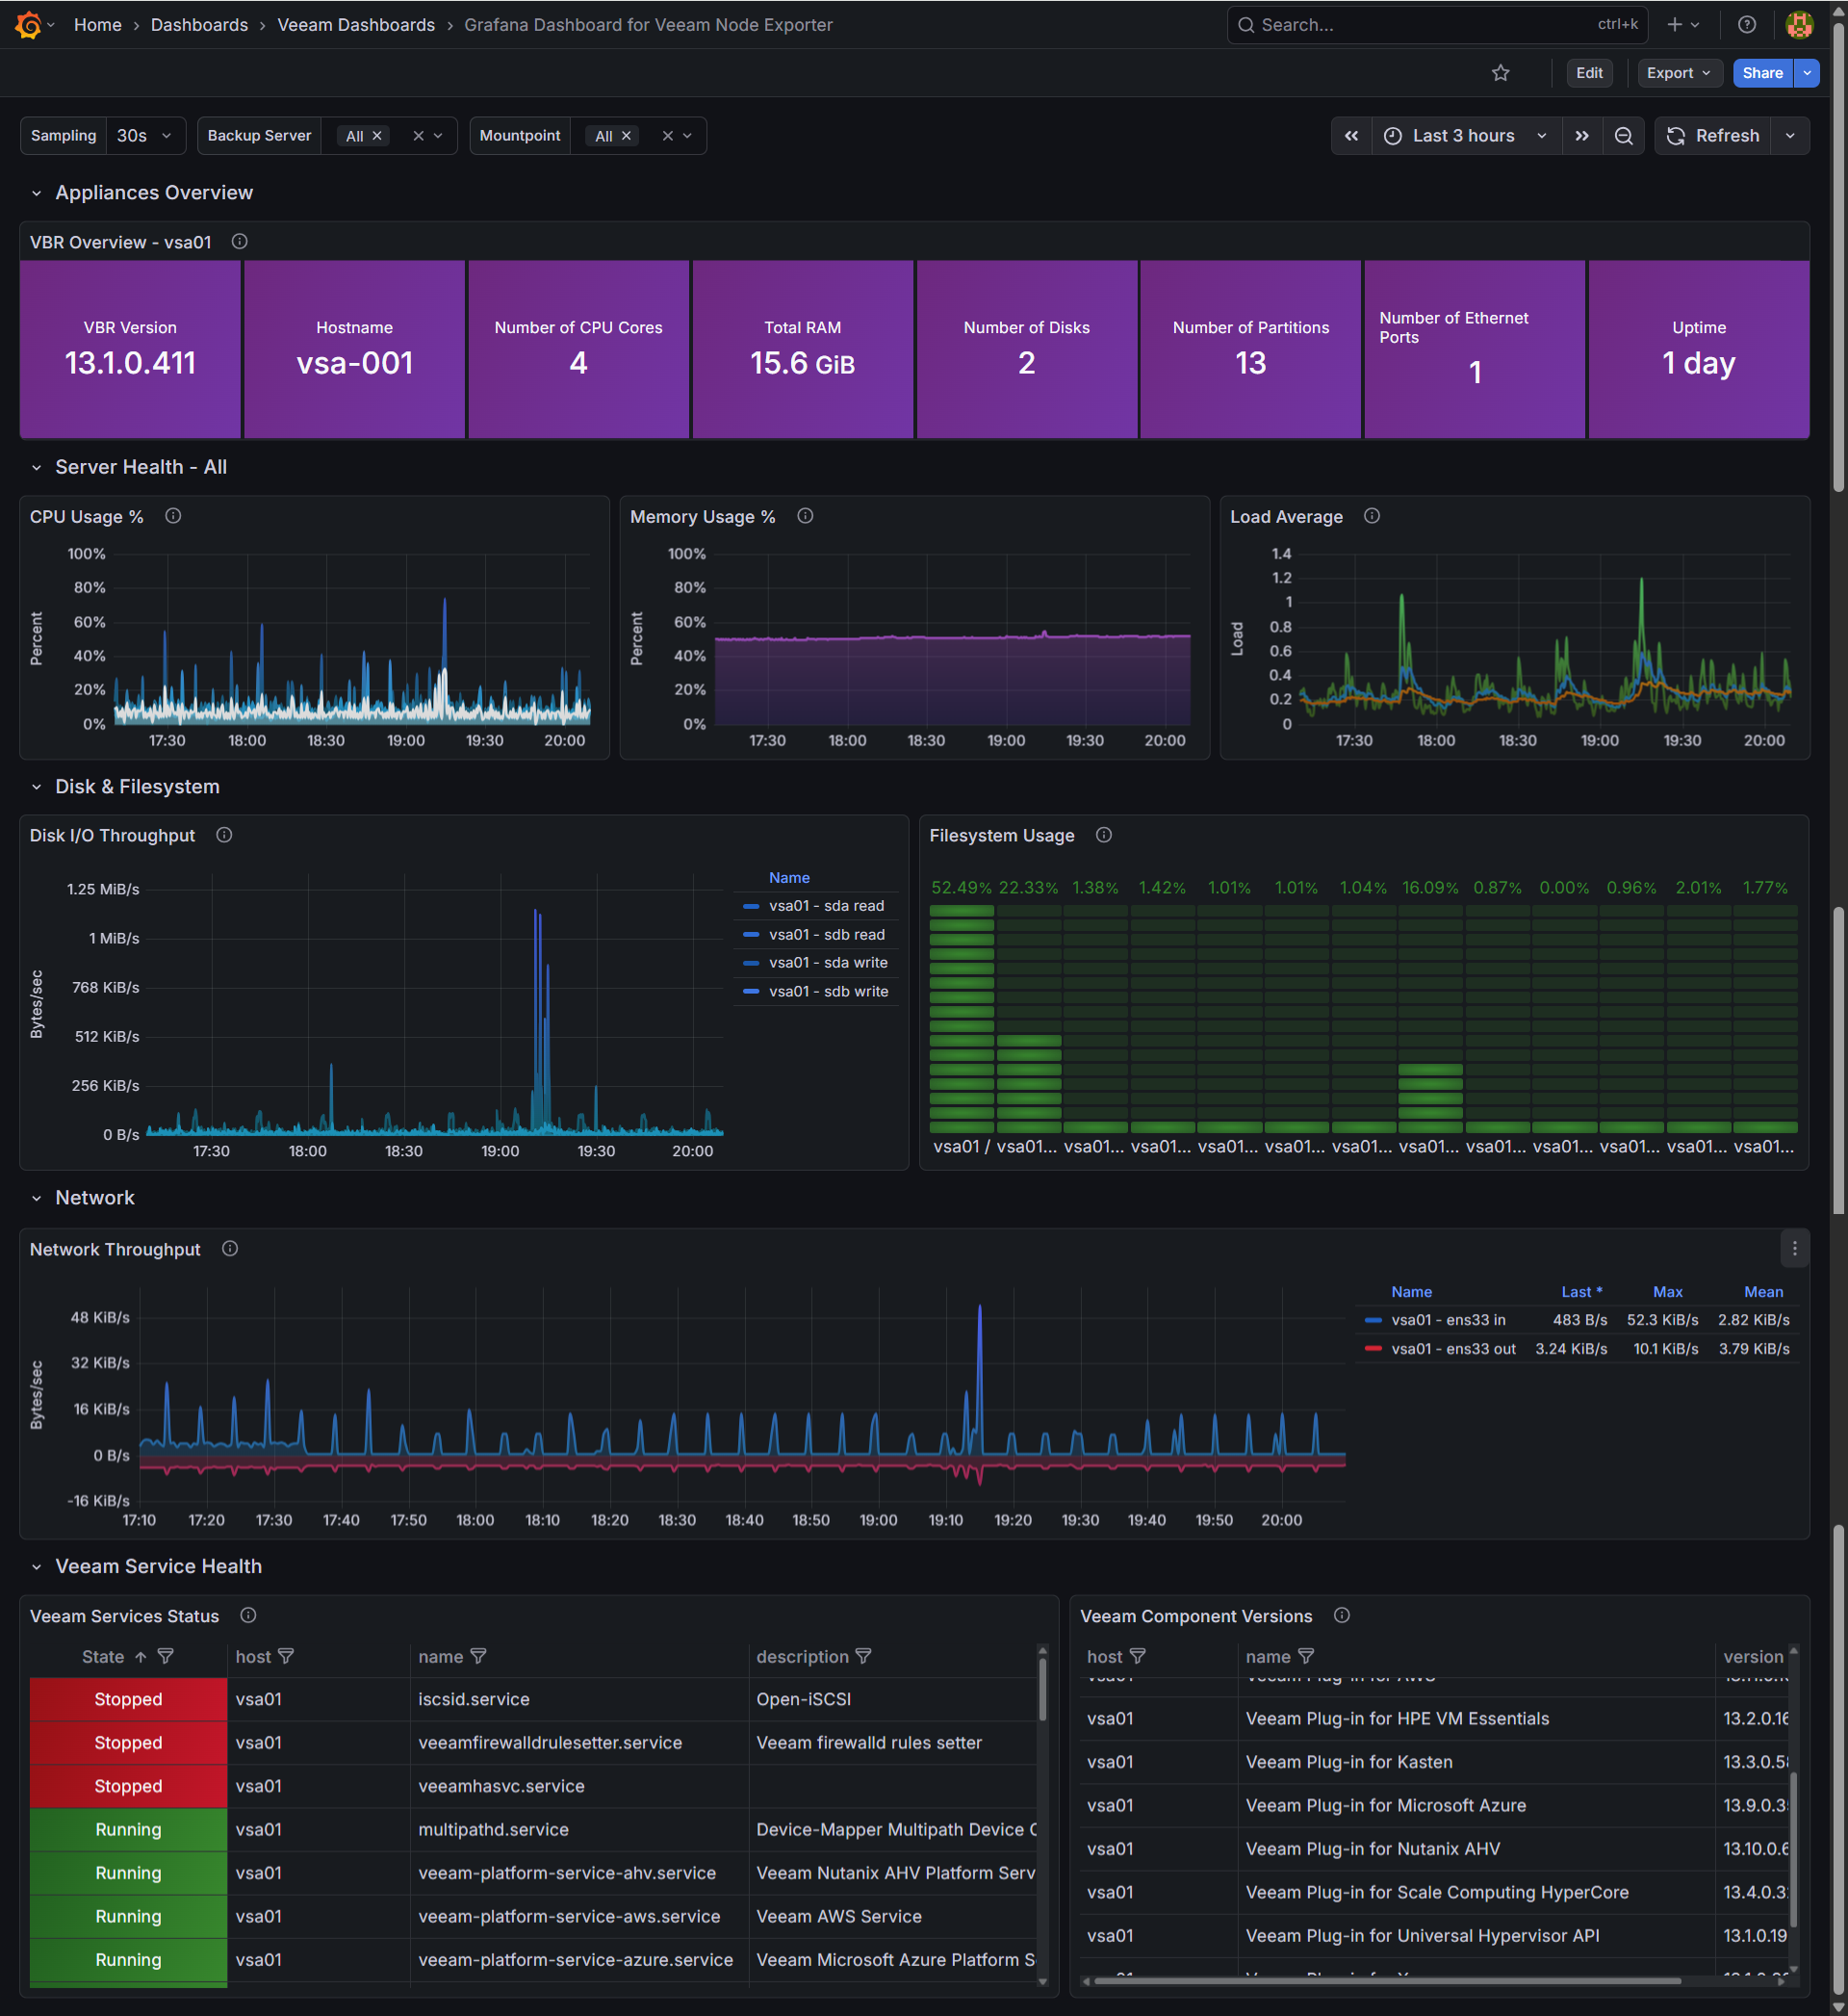
You need to have Veeam Software Appliance, or Veeam Infrastructure Appliance v13.1 and above, and make sure to enable the Node Exporter configuration. Depending if you have selected http or https, and auth, that will change the telegraf collector, or your favorite Prometheus collector.
Review that you are publishing data under https://VBRorVIAIPFQDN/metrics
Then with telegraf, add this to the configuration. Bear in mind to modify the tags if the component is a VBR, or proxy, or repo, etc. So you can use that in the future:
[[inputs.prometheus]]
  urls = ["https://VBRorVIAIPFQDN/metrics"]
  metric_version = 2
  name_override = "veeam_exporter"
  insecure_skip_verify = true
  [inputs.prometheus.tags]
    host = "vsa01"
    role = "vbr"
Restart the Telegraf service, add this dashboard to Grafana and enjoy.
Data source config
Collector config:
Upload an updated version of an exported dashboard.json file from Grafana
| Revision | Description | Created | |
|---|---|---|---|
| Download |

Linux Server

Monitor Linux with Grafana. Easily monitor your Linux deployment with Grafana Cloud's out-of-the-box monitoring solution.
Learn more