
Synthetic Exporter - UI, APIs, and SSL Monitoring
Official dashboard for Synthetic Exporter. Monitors API health, SSL expiry, and active Playwright UI journeys.
Synthetic Exporter Dashboard
This is the official dashboard for the Synthetic Exporter, a straightforward Go-based tool that runs active synthetic checks against your web services and APIs.
What problem does it solve?
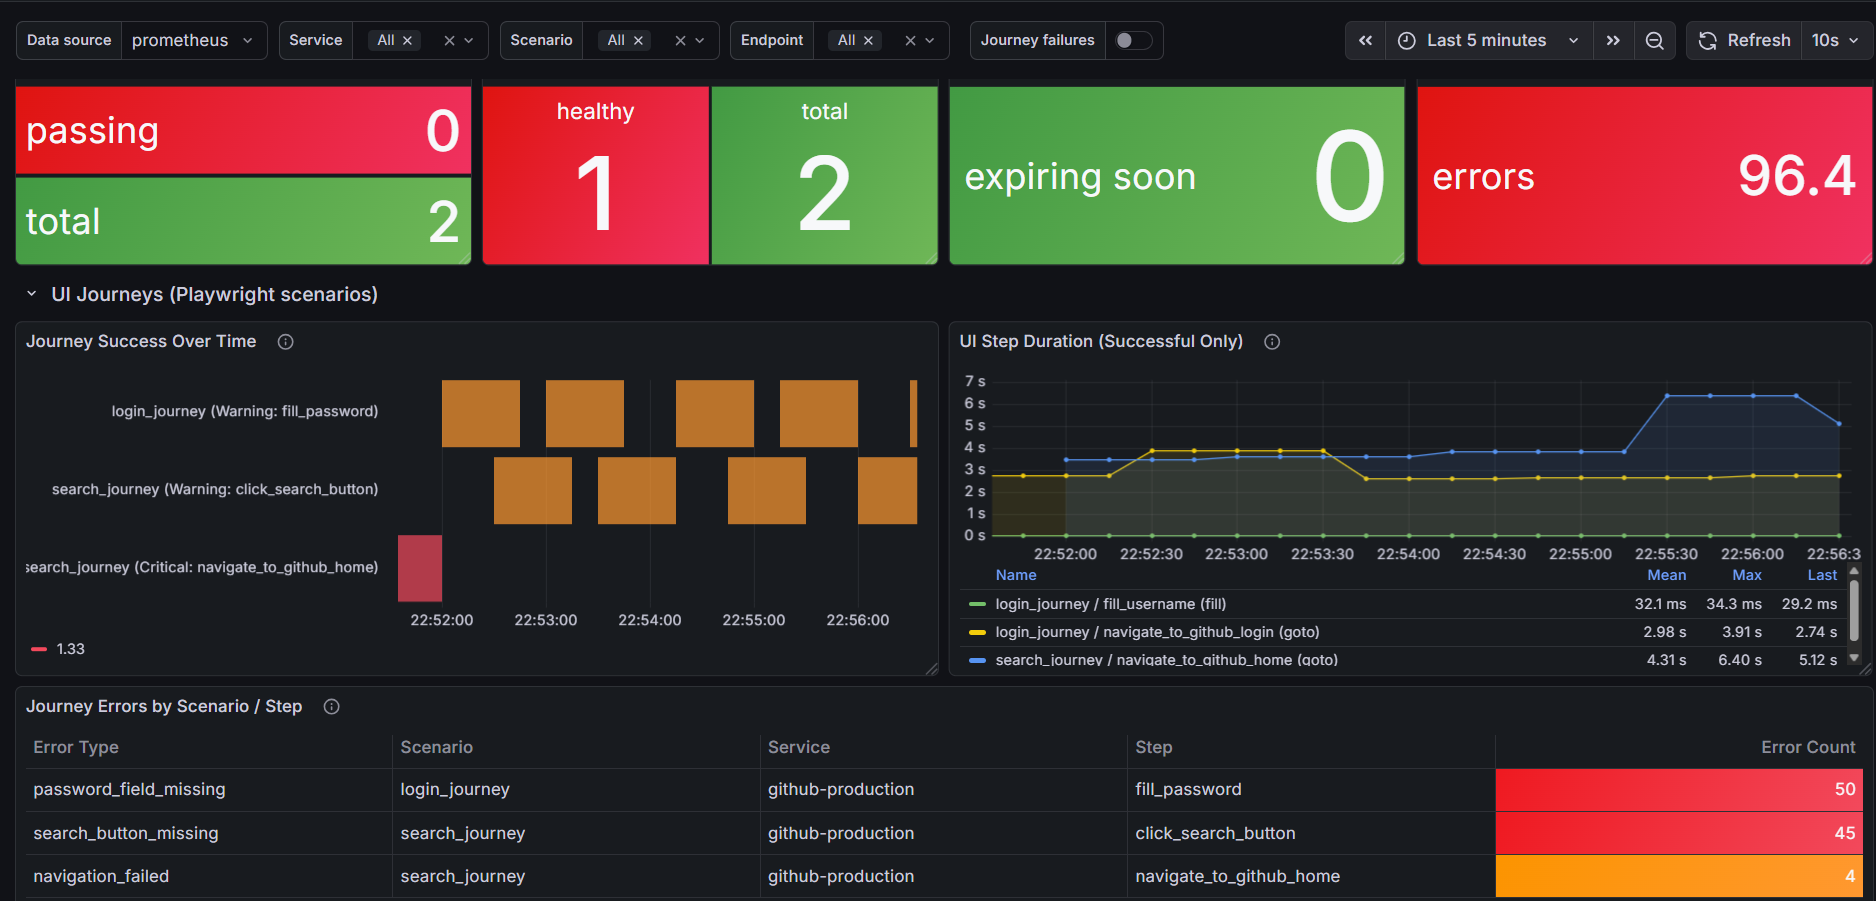
Standard monitoring tells you if your server is running, but it doesn't tell you if a user can actually log in or search your site. This exporter simulates real user journeys using headless browsers (Playwright), so you know immediately when a critical flow breaks, before your users report it.
Key Indications Provided:
- UI Journey Status: Real-time pass/fail status of multi-step UI scenarios.
- UI Step Duration: Exact loading and execution times for individual browser actions (e.g., goto, fill, click).
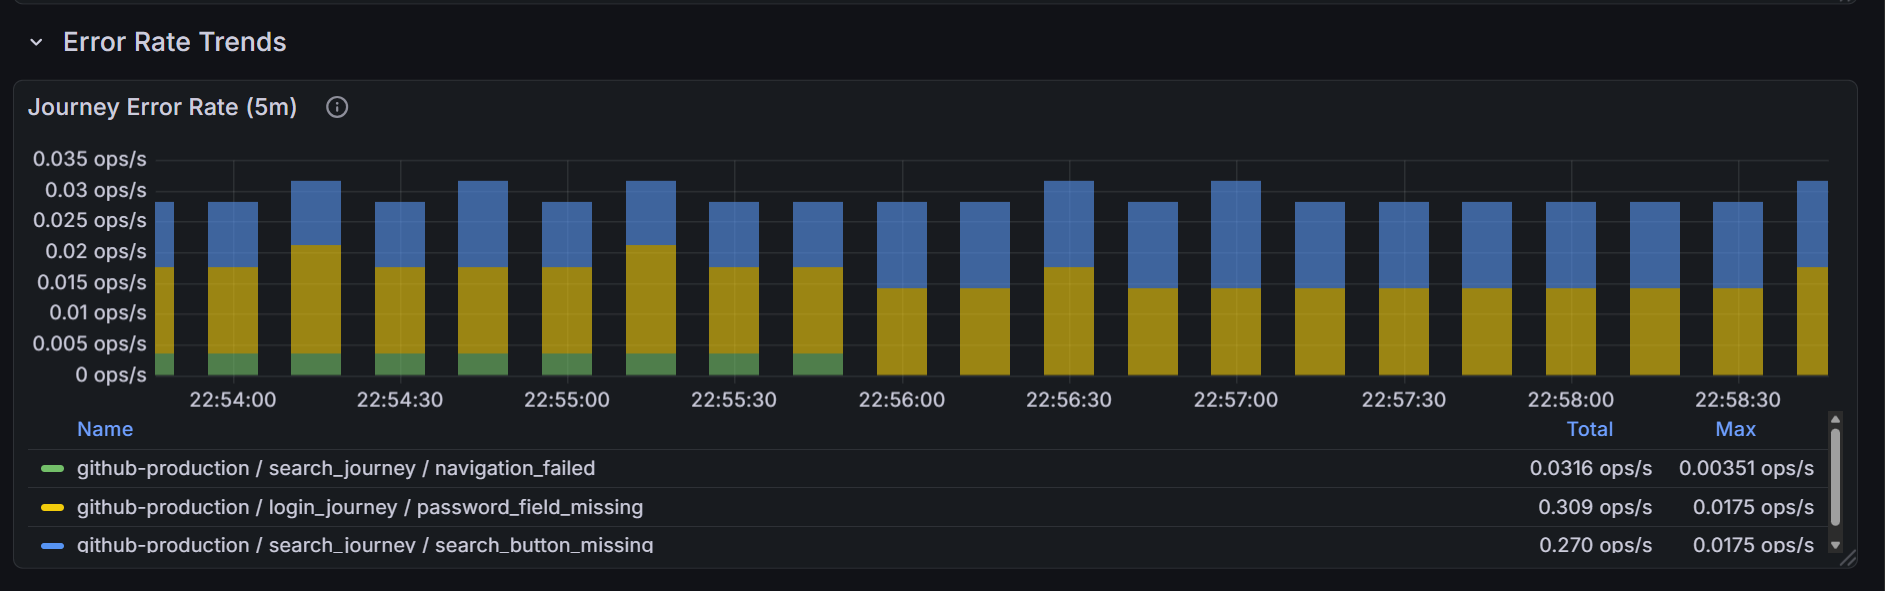
- Specific Error Tracking: Identifies exactly which step failed (e.g.,
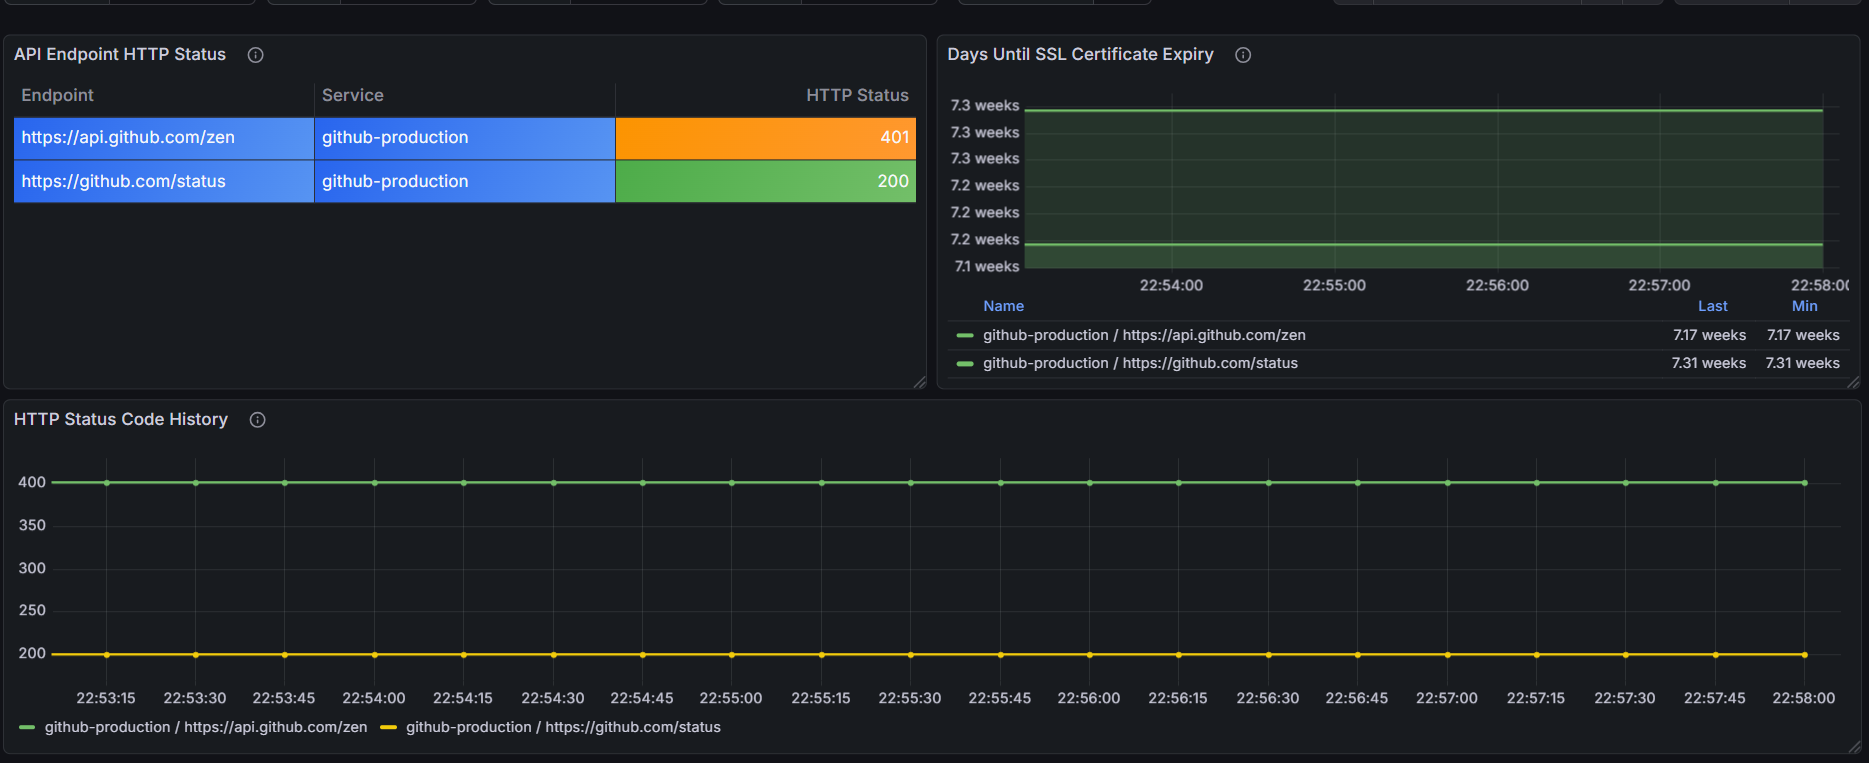
username_field_missingdue to WAF blocking or DOM changes). - API Health: HTTP status codes for your critical endpoints.
- SSL Expiration: Days remaining until TLS/SSL certificates expire.
Getting Started (Agent Installation)
To use this dashboard, you need to run the Synthetic Exporter container and scrape it with your Prometheus instance.
- Agent Installation & Documentation: https://github.com/aizik-fridman/synthetic-exporter
Support & Feedback
Found a bug, want to request a feature, or suggest a change to this dashboard?
- Open an issue: https://github.com/aizik-fridman/synthetic-exporter/issues
- Dashboard JSON Source: synthetic-exporter/grafana/dashboard.json
Data source config
Collector config:
Upload an updated version of an exported dashboard.json file from Grafana
| Revision | Description | Created | |
|---|---|---|---|
| Download |