
NVMe logpage exporter
NVMe health from log pages read over ioctl. Fleet-wide aggregates on top, per-device detail in the collapsed rows.
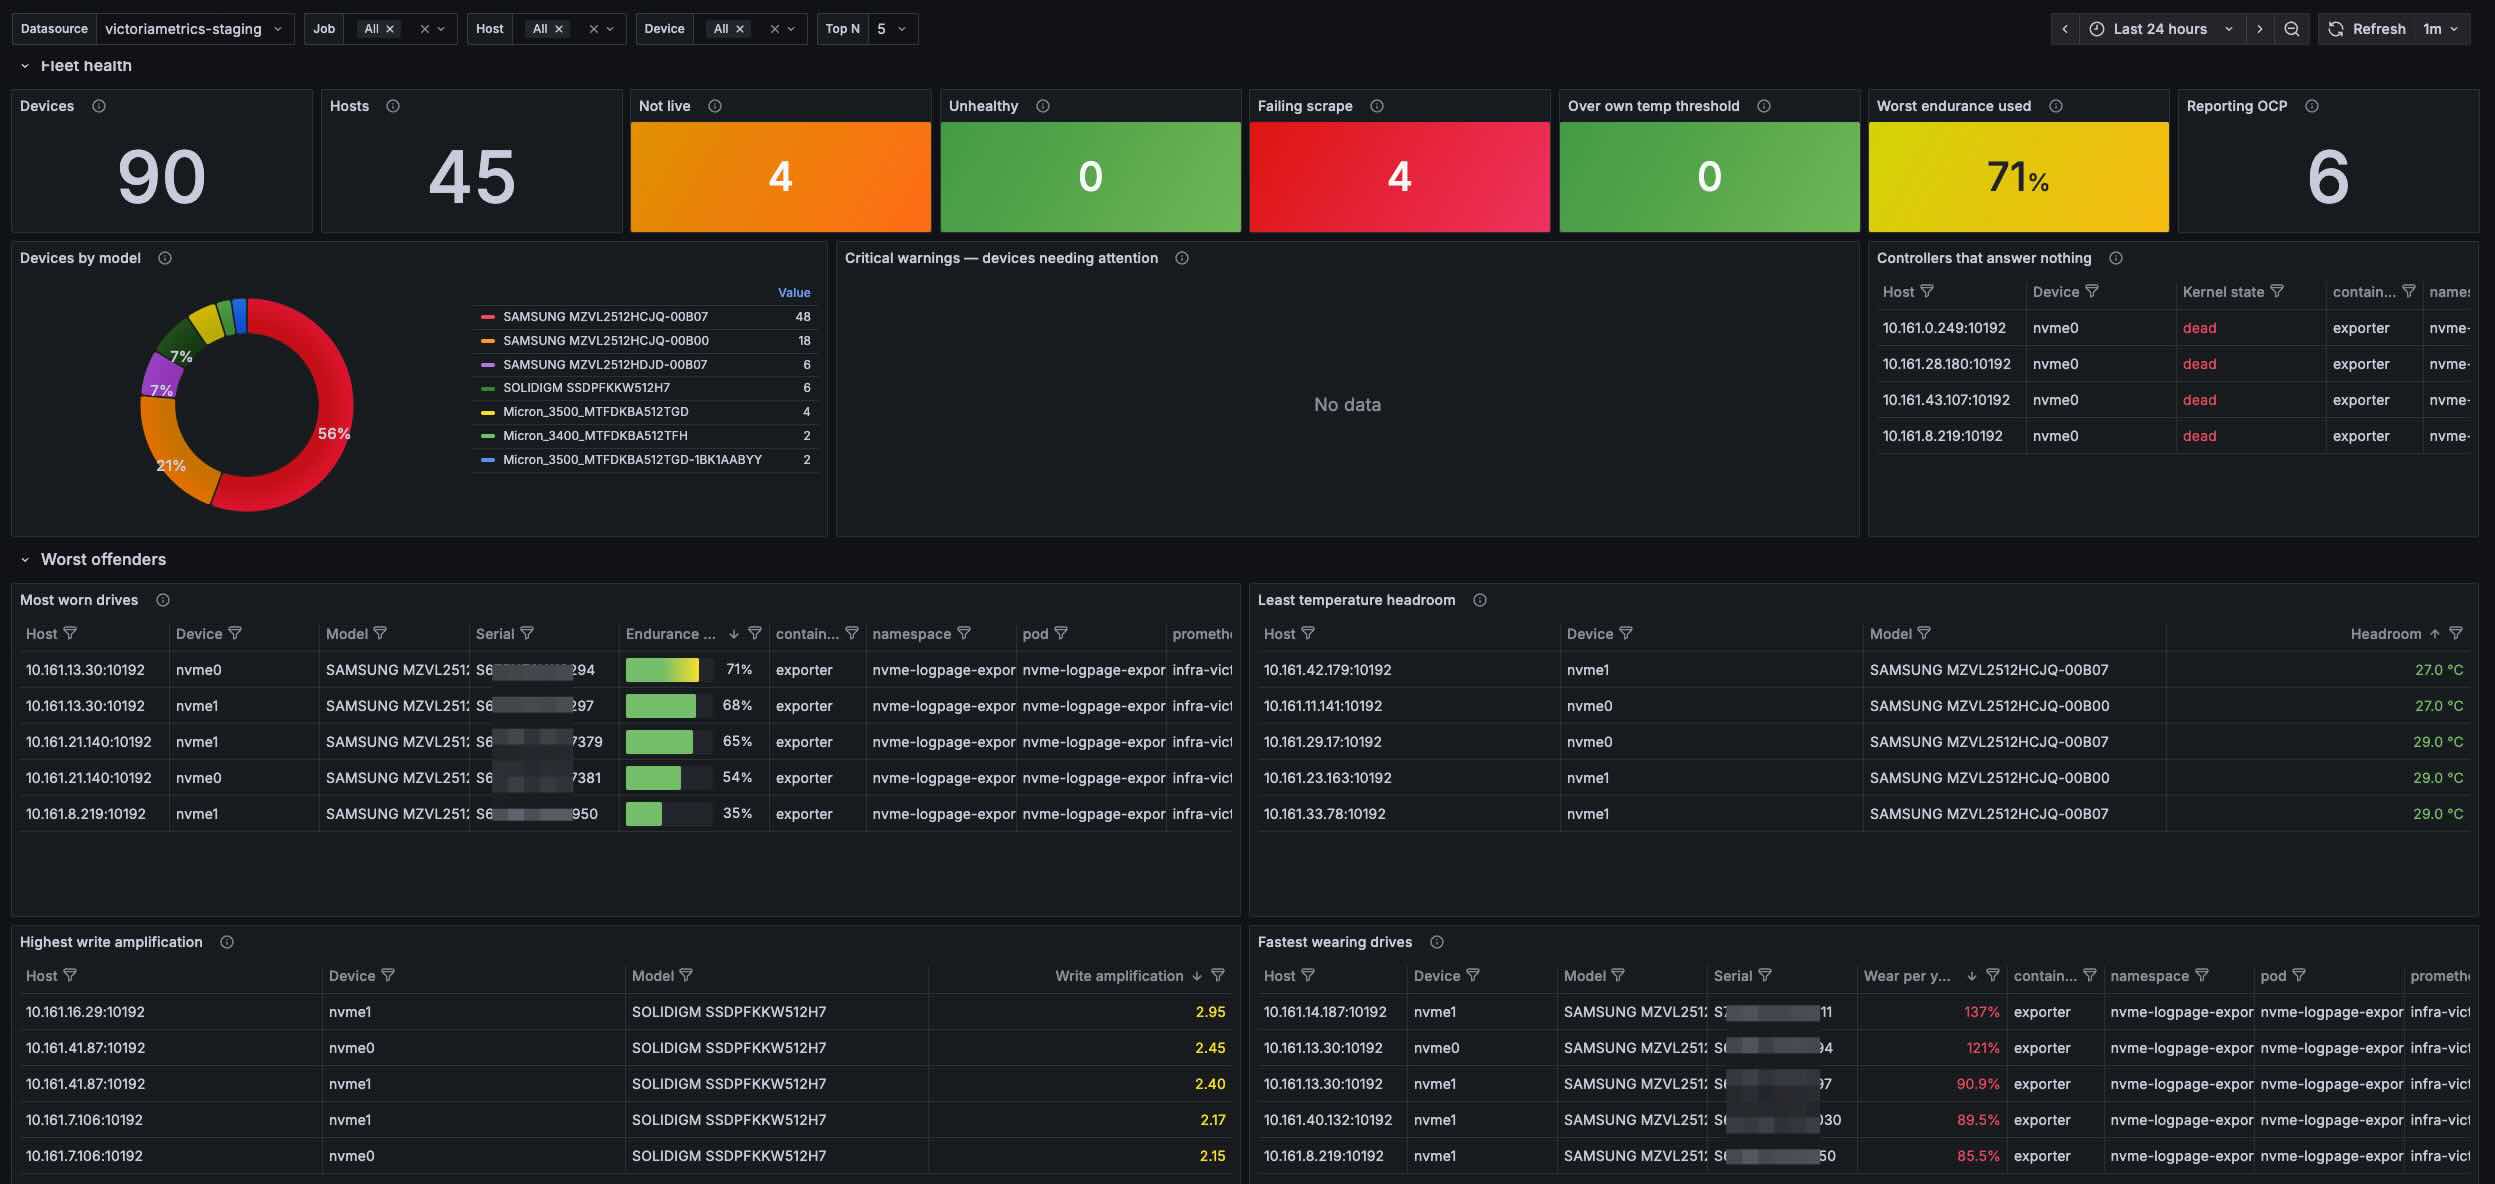
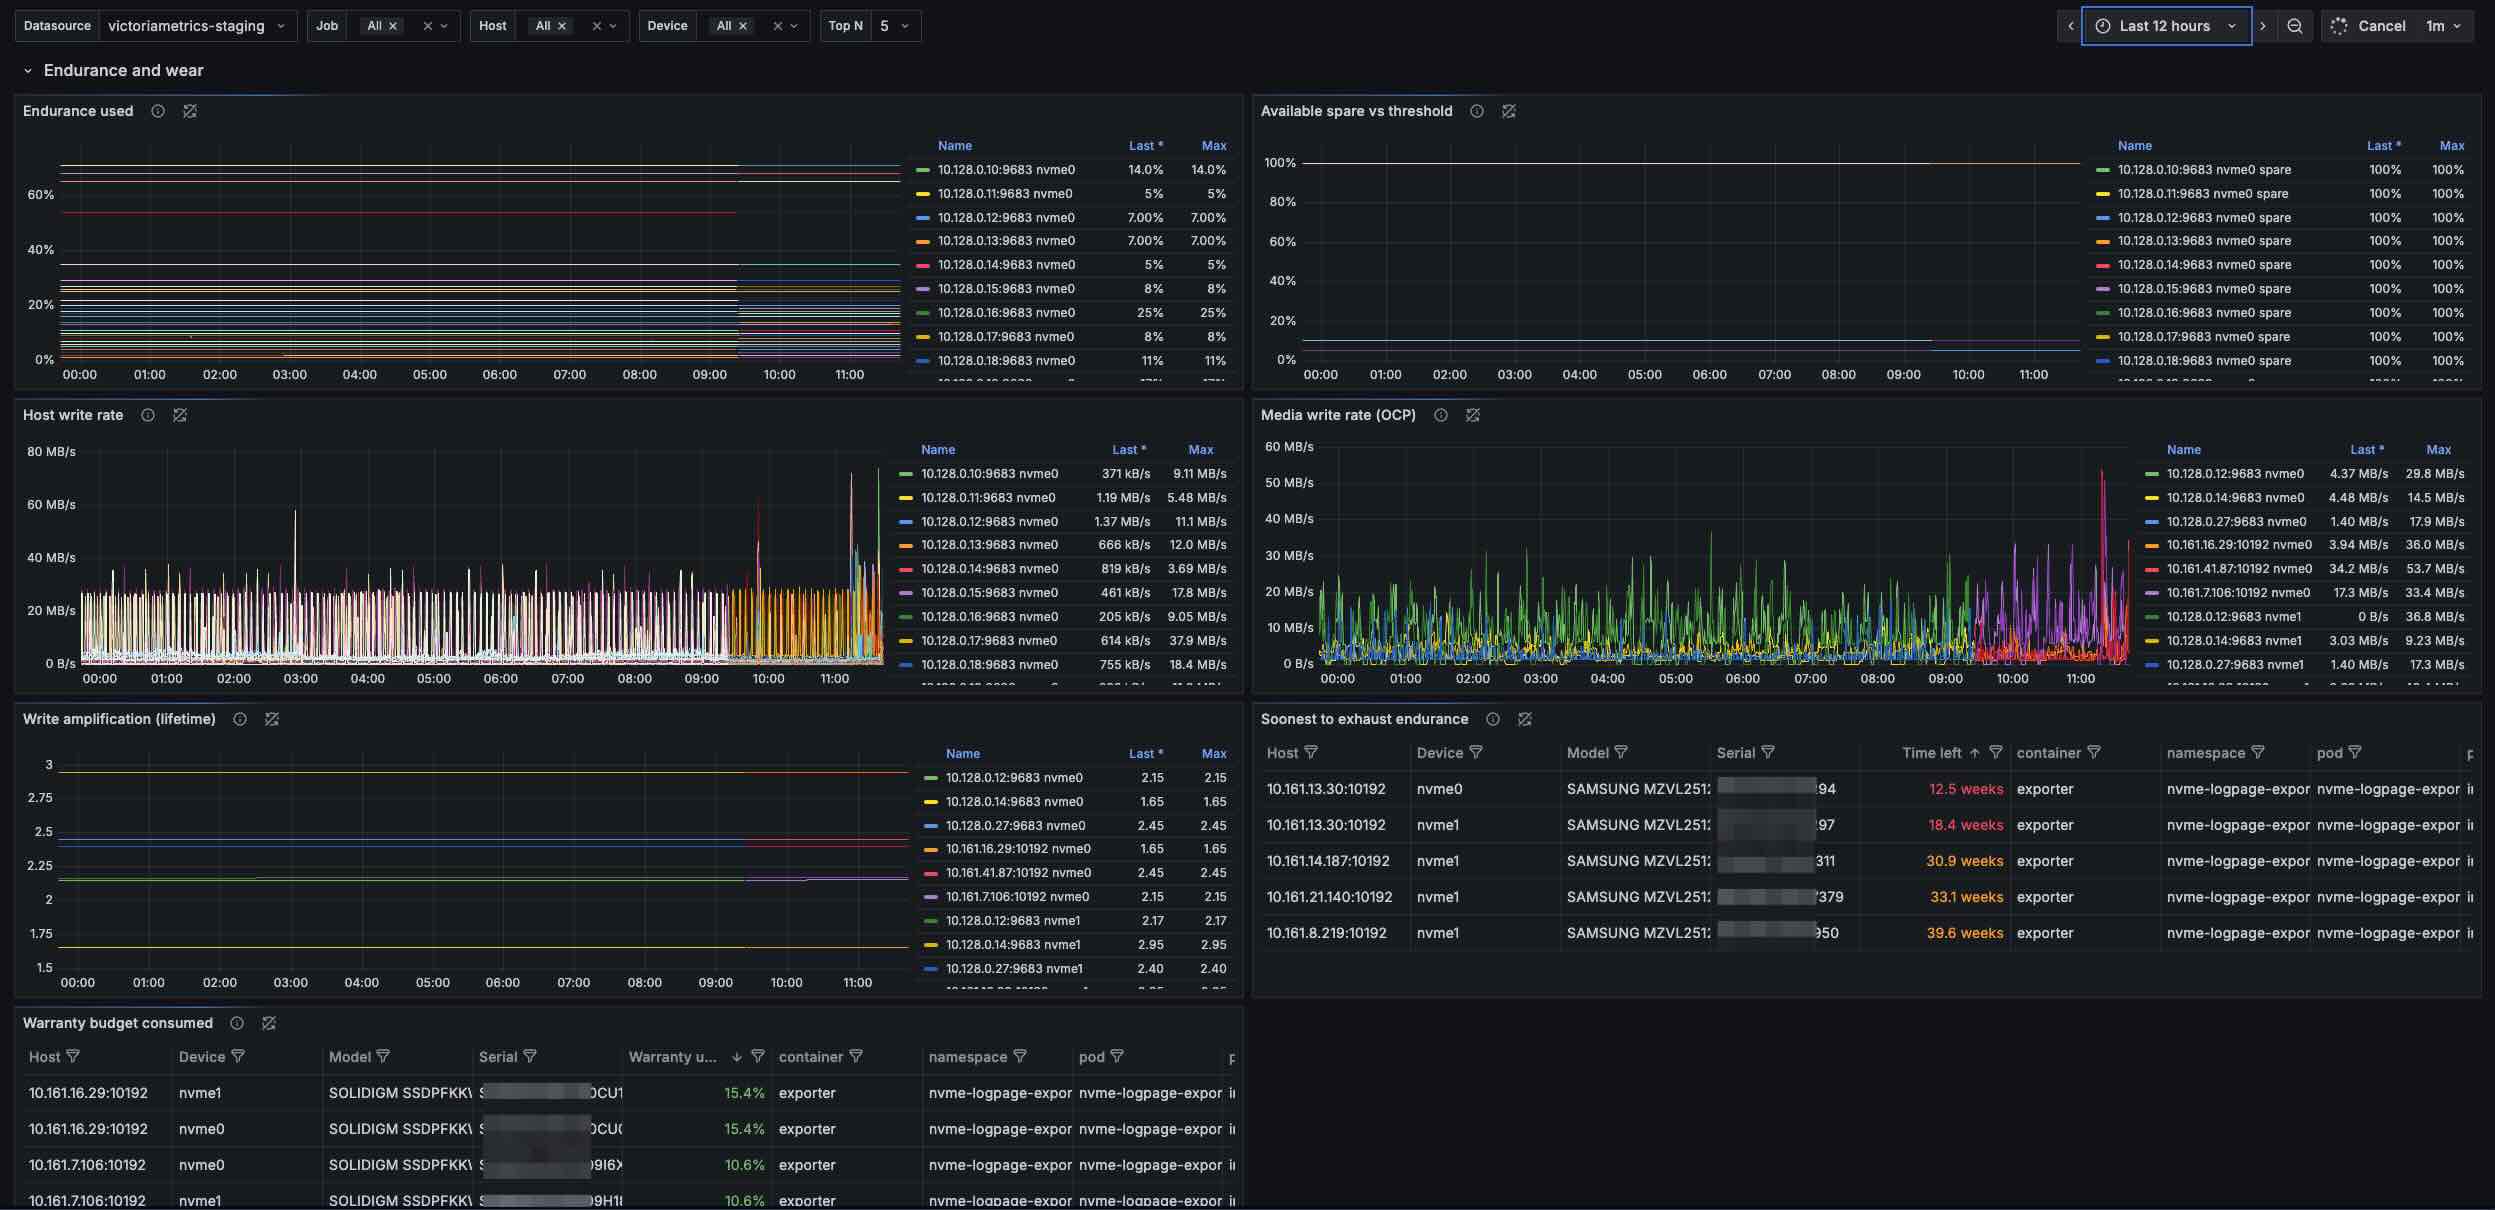
Dashboard for nvme_logpage_exporter, a Prometheus exporter that reads NVMe log pages directly through the kernel's admin passthrough ioctl — no smartctl, no nvme-cli, no process spawned per scrape.
Covers SMART health, controller state, temperature against the thresholds the drive reports for itself, endurance and projected exhaustion, firmware slots, the error log, and the OCP extended health page where the drive serves it — which is what makes true write amplification available.
Requirements
A Prometheus- or VictoriaMetrics-compatible datasource scraping the exporter. Nothing else: every panel draws on this exporter alone.
Layout
The two top rows are aggregates and topk tables, so they stay the same size on a fleet of five hundred hosts as on one. Per-device detail is in the collapsed rows below, reached by selecting a host.
Variables: datasource, job, instance, device, top_n.
Data source config
Collector config:
Upload an updated version of an exported dashboard.json file from Grafana
| Revision | Description | Created | |
|---|---|---|---|
| Download |