
Seagate Exos Storage · Fleet NOC
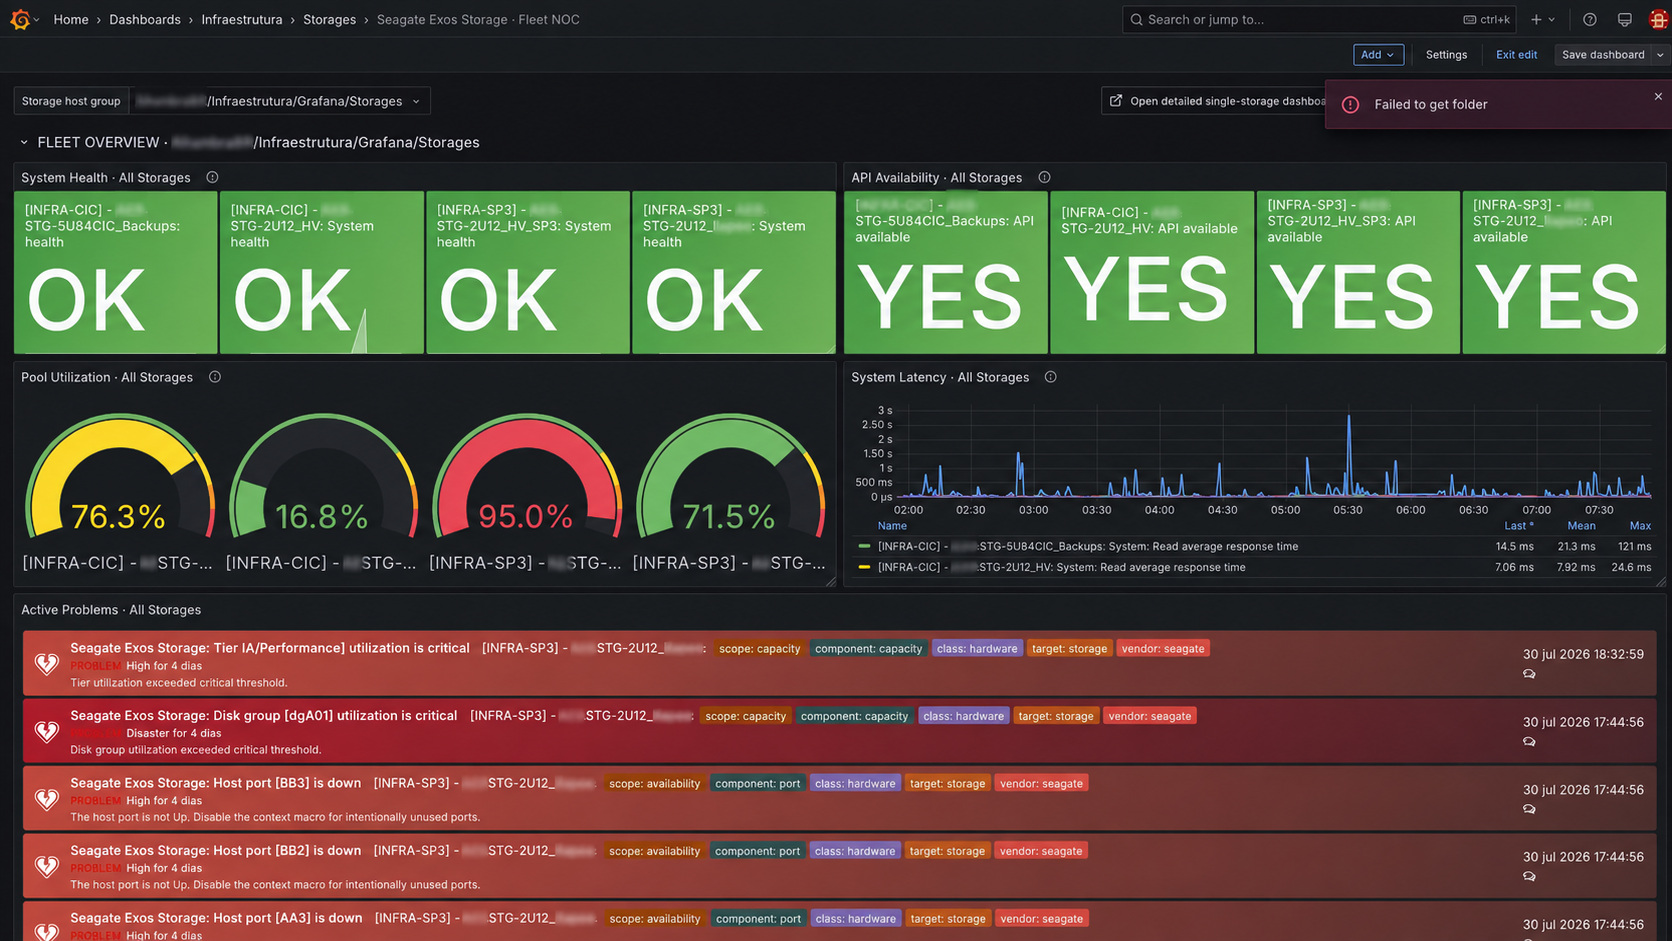
Dynamic NOC dashboard for monitoring multiple Seagate Exos storage systems through Zabbix, with fleet-wide health, problems, capacity, latency, IOPS, throughput, and per-storage status.
Seagate Exos Storage · Fleet NOC
A dynamic Grafana dashboard for centralized NOC monitoring of multiple Seagate Exos storage systems through Zabbix.
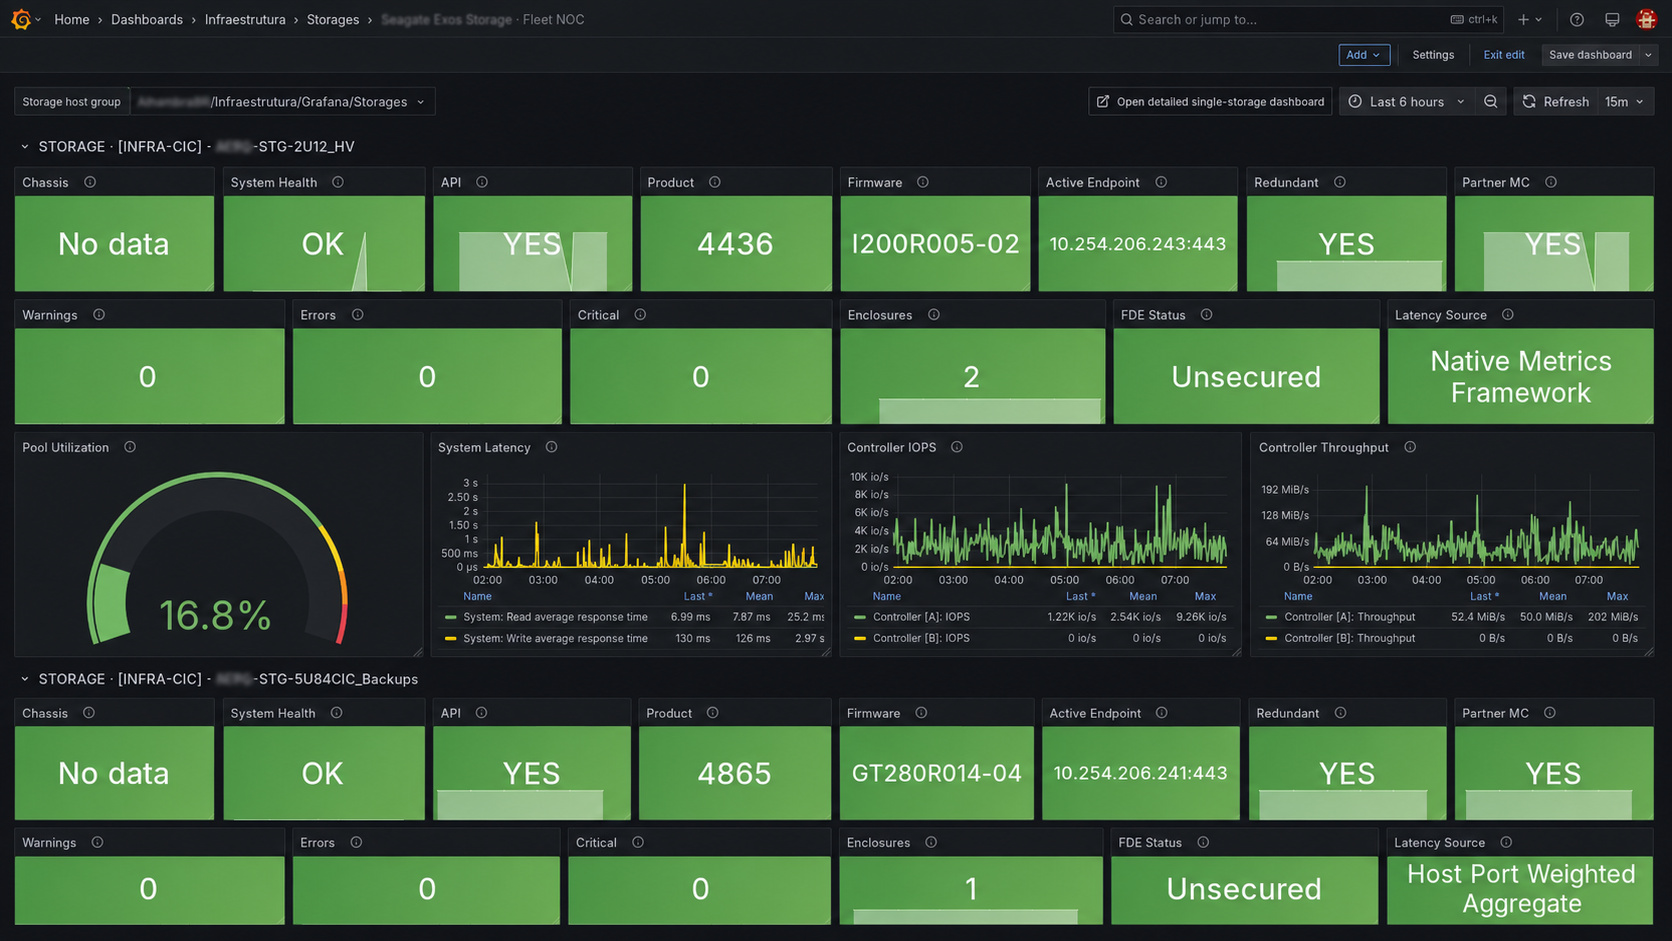
The dashboard provides a fleet-level view of storage health, active problems, API availability, capacity utilization, latency, controller IOPS, controller throughput, firmware, redundancy, management-controller status, and other key operational information.
Monitoring architecture
The dashboard does not communicate directly with the storage systems.
Data is collected by Zabbix through the native Seagate Exos JSON management API and then displayed in Grafana through the Grafana Zabbix data source plugin.
Seagate Exos Storage
        |
        | HTTP/HTTPS JSON API
        v
Zabbix Server or Proxy
        |
        | Seagate Exos Storage by HTTP template
        v
Zabbix history, items, discovery, triggers, and problems
        |
        | Grafana Zabbix data source
        v
Seagate Exos Storage · Fleet NOC
Required Zabbix template
Every storage host must use the Seagate Exos Storage by HTTP template.
Template source and installation documentation:
The template is designed for Zabbix 7.0+ and uses native Zabbix features such as:
- Script master items
- Dependent items
- Low-Level Discovery
- Trigger prototypes
- Graph prototypes
- Value maps
- Host macros
- Read-only HTTP/HTTPS API collection
No Zabbix Agent, SNMP polling, or external script installed on the storage is required.
What the Zabbix template monitors
Depending on the storage generation and available API objects, the template collects and discovers:
- Overall system health
- API availability and response time
- Product and firmware information
- Active management endpoint
- Controller health and performance
- Pools and capacity utilization
- Disk groups
- Volumes
- Physical disks
- Enclosures
- FRUs
- Fans
- Power supplies
- Sensors
- FC, iSCSI, and SAS host ports
- SAS links
- Redundancy state
- FDE status
- Events and alerts
- Host-facing read and write latency
- Controller IOPS and throughput
System latency
For Exos X 4006 systems, the template uses native Metrics Framework response-time values.
For tested 4005/4865 systems that do not expose the same native metrics, the template calculates host-facing latency from I/O-weighted host-port statistics.
The dashboard shows the active method in the Latency Source panel.
Important Zabbix host-group requirement
All storage hosts that should appear together in this dashboard must be placed in the same Zabbix Host Group.
This is required because the dashboard dynamically discovers the storage hosts from the selected Zabbix group.
Example:
Zabbix Host Group: Infrastructure/Storage/Seagate Exos
├── Storage-01
├── Storage-02
├── Storage-03
└── Storage-04
The selected group should preferably contain only Seagate Exos storage hosts monitored by the required template.
A storage host that is not a member of the selected Zabbix Host Group will not appear in the dashboard.
How the dynamic dashboard works
The dashboard uses two Grafana variables:
group
A visible variable used to select the Zabbix Host Group that contains the storage systems.
storage
A hidden, multi-value variable automatically populated with all Zabbix hosts found inside the selected $group.
The dashboard then uses a Grafana repeating row:
Selected Zabbix Host Group
        |
        v
All hosts inside the group
        |
        v
Hidden multi-value $storage variable
        |
        v
One repeated dashboard section per storage
Because of this design, no dashboard editing is required when a new storage is added.
Adding a new storage
To add another storage to the Fleet NOC dashboard:
- Create the storage host in Zabbix.
- Link the Seagate Exos Storage by HTTP template.
- Configure the required API macros.
- Confirm that the host is collecting data under Monitoring > Latest data.
- Add the storage host to the same Zabbix Host Group used by the other storages.
- Reload the Grafana dashboard or reselect the Host Group.
The new storage will automatically receive its own repeated dashboard section.
Dashboard sections
Fleet Overview
The top section provides an aggregated view of all storages in the selected group:
- System health for all storages
- API availability for all storages
- Pool utilization across the fleet
- System latency across the fleet
- Active Zabbix problems for all storages
Per-storage section
Each storage receives a dedicated dynamic row containing:
- Chassis
- System Health
- API
- Product
- Firmware
- Active Endpoint
- Redundant
- Partner MC
- Warnings
- Errors
- Critical alerts
- Enclosures
- FDE Status
- Latency Source
- Pool Utilization
- System Latency
- Controller IOPS
- Controller Throughput
Chassis identification
The dashboard reads the following discovered Zabbix item:
FRU [CHASSIS_MIDPLANE/MID-PLANE SLOT]: Description
Example:
Seagate Channel 2U12 Midplane Indium LX2 iSCSI SFP+
The dashboard maps known descriptions to common enclosure formats such as:
- 2U12
- 2U24
- 5U84
NAT and controller-specific ports
The Zabbix template supports independent API ports for controller A and controller B.
This is useful when both controllers are accessed through the same NAT IP address or DNS name but are published on different TCP ports.
Example:
{$SEAGATE.API.HOST} = storage.example.com
{$SEAGATE.API.HOST.SECONDARY} = storage.example.com
{$SEAGATE.API.PORT.PRIMARY} = 8001
{$SEAGATE.API.PORT.SECONDARY} = 8002
The Active Endpoint panel displays the management endpoint currently selected by the Zabbix collector in host:port format.
Requirements
- Grafana 11.6 or newer recommended
- Grafana Zabbix data source plugin
- Zabbix 7.0 or newer
- Seagate Exos Storage by HTTP template
- API connectivity from the Zabbix Server or Proxy to the storage management interface
- A dedicated Seagate Exos Monitor/read-only API account
Grafana Zabbix plugin:
alexanderzobnin-zabbix-datasource
Zabbix template:
Installation
1. Configure Zabbix
For every storage:
- Create the Zabbix host.
- Link the Seagate Exos Storage by HTTP template.
- Configure the API host, username, password, scheme, and ports when required.
- Verify that the items are supported and receiving data.
- Add the host to the common storage Host Group.
2. Configure Grafana
- Install and configure the Grafana Zabbix data source plugin.
- Confirm that Grafana can query the Zabbix instance.
- Import:
grafana_dashboard_seagate_exos_fleet_noc_v1.0.0.json
- Select the Zabbix data source during import.
- Open the dashboard.
- Select the Zabbix Host Group containing the storage systems.
Grafana will automatically populate and render one row per storage host.
Recommended organization
A dedicated Zabbix Host Group is strongly recommended.
Example:
Infrastructure
└── Storage
    └── Seagate Exos
or:
Customers
└── Customer-A
    └── Storage
The same dashboard can be reused for different sites, customers, or data centers by selecting a different Zabbix Host Group.
Text and numeric values
The dashboard correctly separates numeric and text queries.
Numeric items use the Zabbix Metrics query type.
Text and character items use the Zabbix Text query type and select only the actual Zabbix value field, excluding the returned Time field.
This prevents timestamps from being rendered together with values such as:
- Product
- Firmware
- Active Endpoint
- FDE Status
- Latency Source
Detailed single-storage dashboard
This Fleet NOC dashboard is designed for centralized monitoring of multiple arrays.
For deeper troubleshooting, use the dedicated single-storage dashboard to inspect:
- Individual disks
- Host ports
- Controllers
- Pools
- Disk groups
- Volumes
- Fans
- Power supplies
- Sensors
- Events
- Detailed performance history
Security recommendations
- Use a dedicated Monitor/read-only account.
- Store the API password as a Zabbix secret-text macro.
- Restrict storage API access to trusted Zabbix Server or Proxy addresses.
- Restrict NAT-published API ports to trusted monitoring sources.
- Prefer private management networks, VPNs, or dedicated monitoring paths.
- Do not expose storage-management interfaces broadly to the Internet.
- Grafana only needs access to Zabbix; storage credentials do not need to be stored in Grafana.
Troubleshooting
A storage does not appear
Verify that:
- The Zabbix host exists and is enabled.
- The required template is linked.
- The host is collecting data.
- The host belongs to the same Zabbix Host Group selected in Grafana.
- The Grafana Zabbix data source can query that group.
- The dashboard variables were refreshed.
A text panel shows No data
Verify that the corresponding Zabbix item has recent history and that the dashboard time range includes a stored value.
A numeric panel shows No data
Check the corresponding item under:
Zabbix > Monitoring > Latest data
Also verify that the selected Grafana time range contains recent history.
Dashboard information
Dashboard UID:
seagate-exos-fleet-noc
Release:
v1.0.0
Dashboard SHA-256:
c6944822678a81c999995798faa77552899249b04d253a879a847a0fb2215806
Author
Guilherme Campos — @guicampos21
Data source config
Collector config:
Upload an updated version of an exported dashboard.json file from Grafana
| Revision | Description | Created | |
|---|---|---|---|
| Download |