
LLM Simulation - vLLM Serving Overview
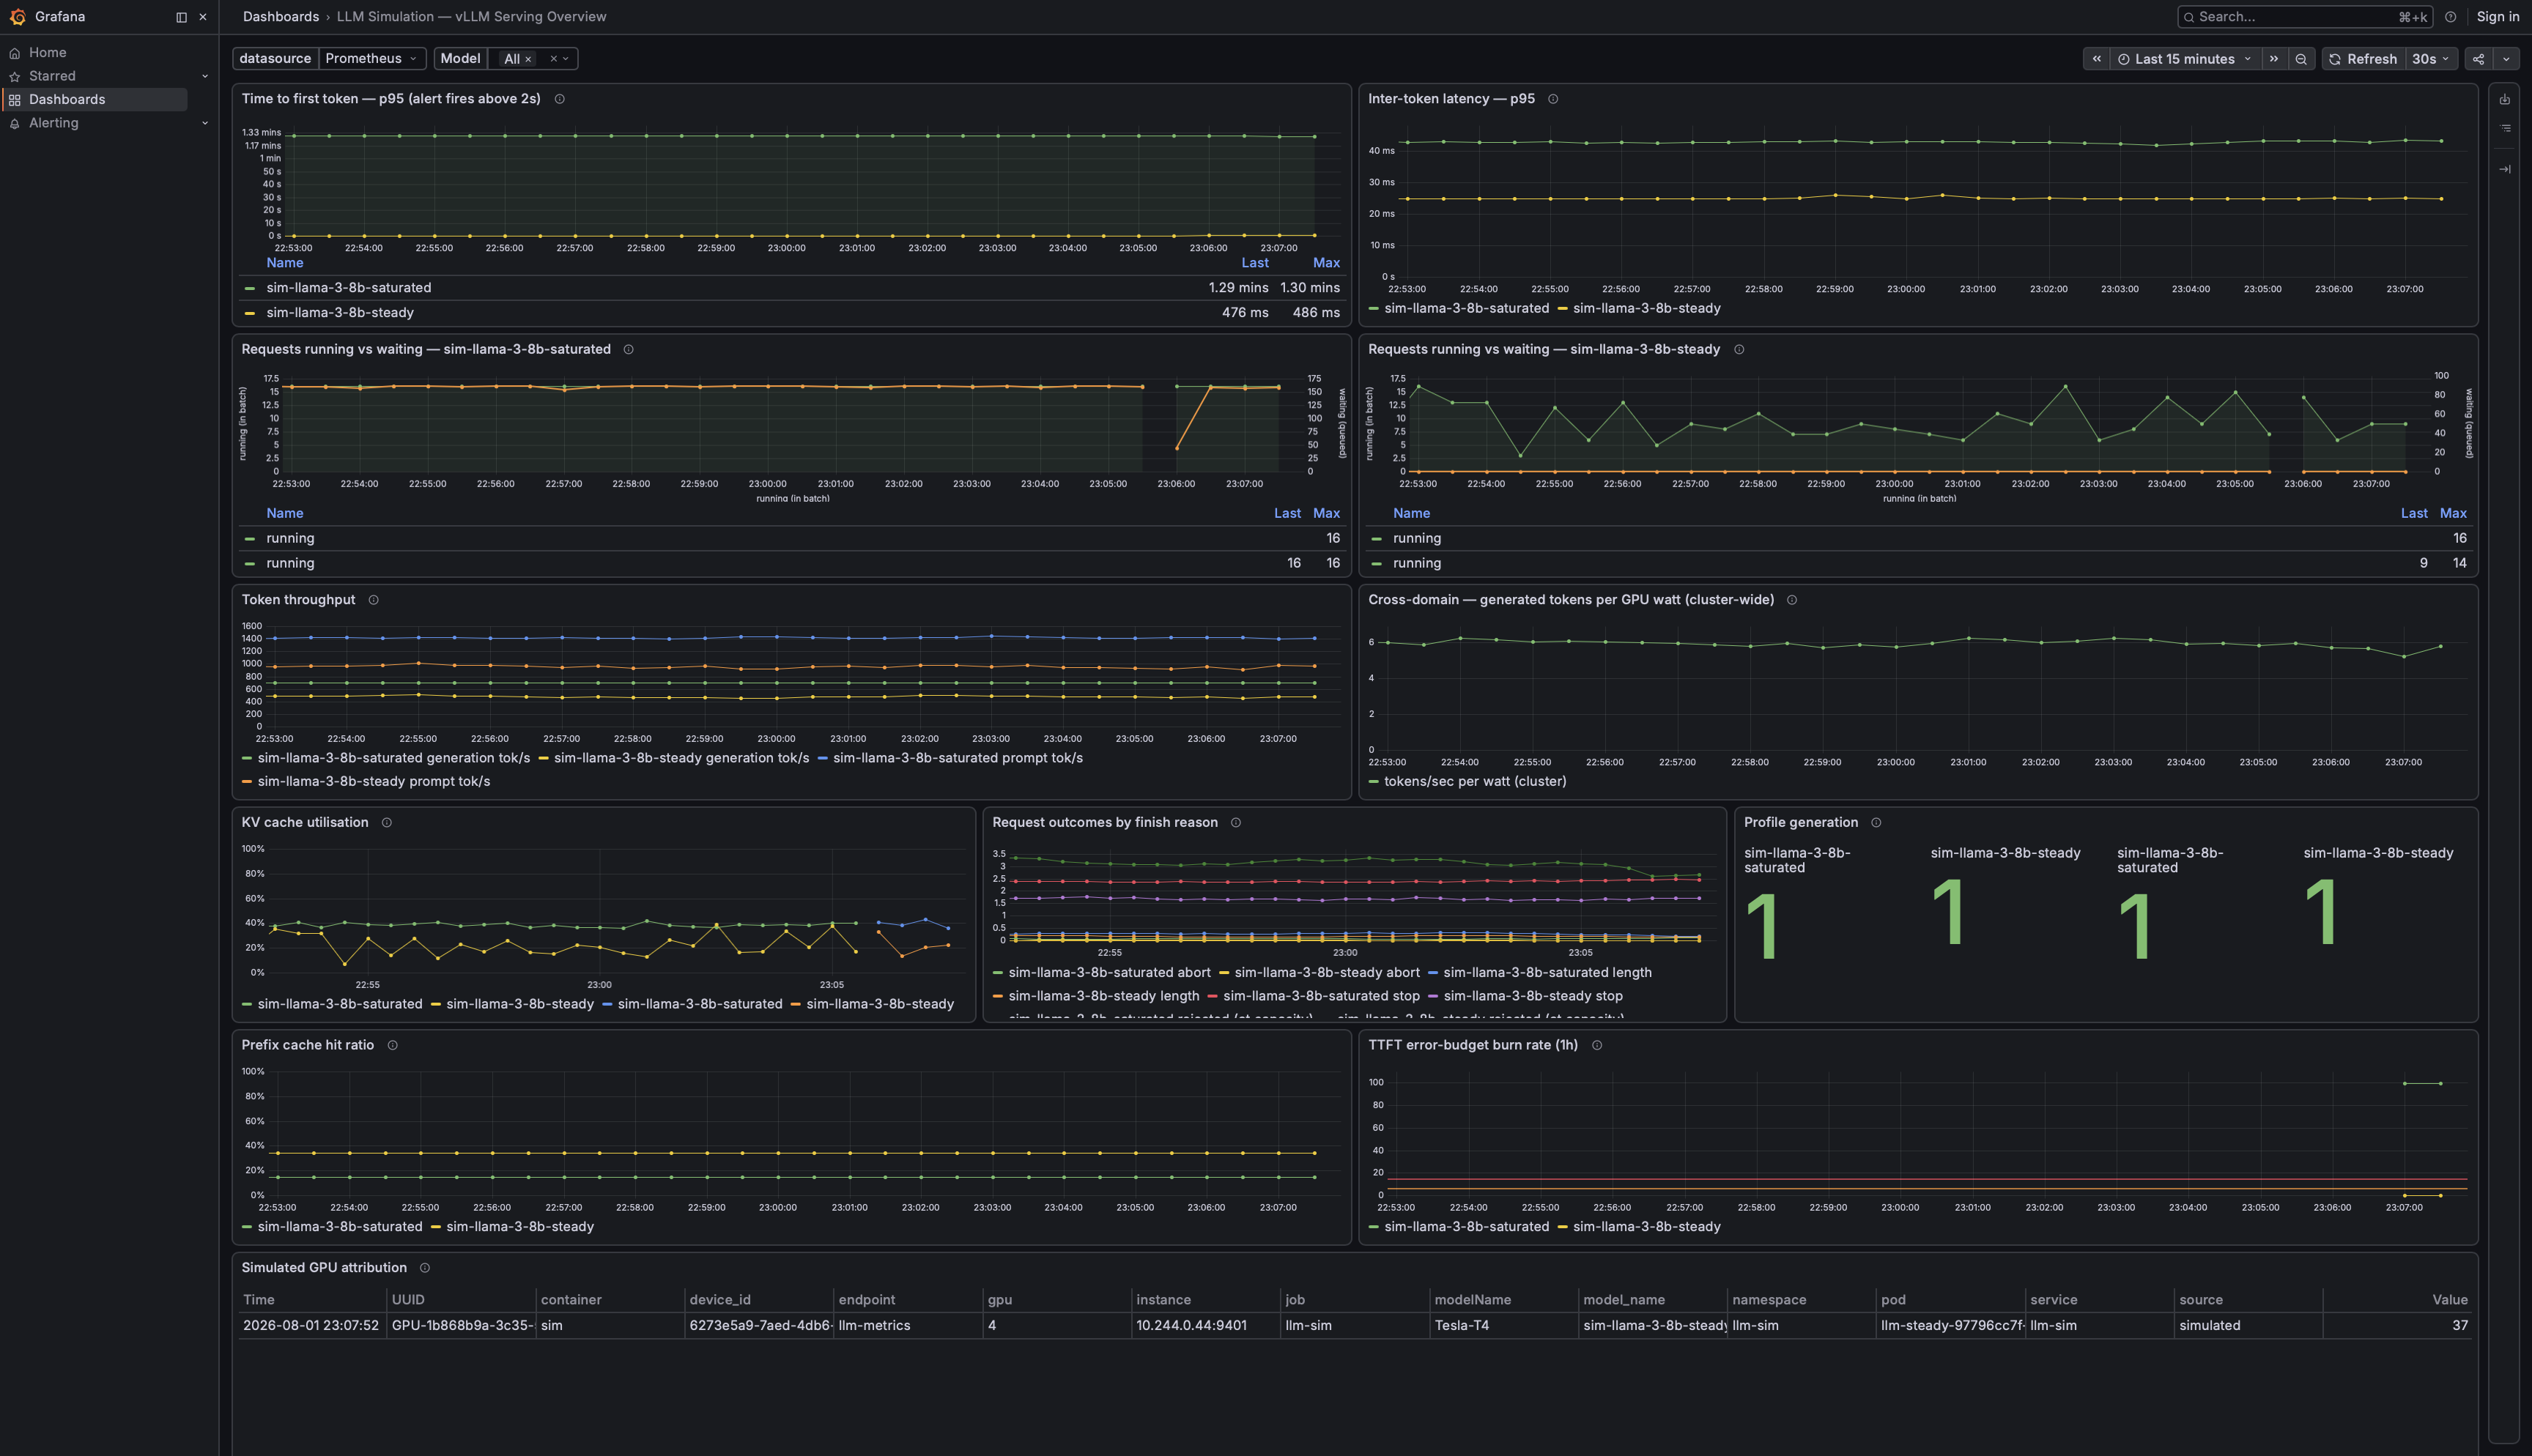
vLLM serving overview: first-token and inter-token latency, throughput, queue depth, KV cache, prefix-cache reuse and a TTFT error budget, every panel by (model_name). V1 metric names; several panels need the llm:* recording rules.
LLM Simulation - vLLM Serving Overview
Time to first token, inter-token latency, throughput, queue depth, KV-cache usage and prefix-cache reuse for vLLM - every panel broken out by (model_name), so a saturated tenant is never averaged into a healthy one.
Built for a simulated vLLM fleet - it ships with k8s-ai-observability, a rig that stands up GPU and LLM observability with no GPU and no model weights - but the queries are plain vLLM PromQL against the V1 metric surface. Build the board and its alerts here, point them at a real deployment afterwards.
The first panel is the whole design: two tenants either side of the 2s alert threshold, identical code, one degraded. A board that summed them would show neither.
Panels
| Panel | Query | Notes |
|---|---|---|
| Time to first token - p95 | llm:ttft:p95_5m | red threshold line at 2s |
| Inter-token latency - p95 | llm:tpot:p95_5m | read the caveat below before setting an SLO |
| Requests running vs waiting | vllm:num_requests_running, vllm:num_requests_waiting | repeats per model, waiting on the right axis |
| Token throughput | llm:tokens:generation_rate5m, llm:tokens:prompt_rate5m | prefill and decode, separately |
| Generated tokens per GPU watt | llm:tokens_per_watt:5m | cross-domain, needs DCGM - see below |
| KV cache utilisation | vllm:kv_cache_usage_perc | fraction 0–1, axis pinned |
| Request outcomes by finish reason | rate(vllm:request_success_total[5m]), rate(llmsim_requests_rejected_total[5m]) | rejections are counted apart from successes |
| Profile generation | llmsim_profile_generation | simulator-only |
| Prefix cache hit ratio | llm:prefix_cache:hit_ratio5m | fraction 0–1 - plot the ratio, never either counter |
| Simulated GPU attribution | llmsim_gpu_binding_info joined to DCGM_FI_DEV_GPU_UTIL | simulator-only |
| Request phase breakdown | llm:queue:mean5m, llm:prefill:mean5m, llm:decode:mean5m, llm:e2e:mean5m | repeats per model, stacked; means, not percentiles - read the caveat below |
| Decode latency - p95 | llm:decode:p95_5m | the only phase these buckets resolve; there is deliberately no prefill or e2e p95 |
| TTFT error-budget burn rate | llm:ttft:slo_ratio1h | the SLO panel - a ratio at a bucket boundary, not a percentile - see below |
Running vs waiting repeats per model rather than sharing one panel, because the two tenants operate at different scales: a saturated tenant queues ~160 against a running batch of 16, and on one shared axis the running series flattens to nothing. Waiting is on the right axis for the same reason. A healthy tenant should sit near zero waiting; a plateau means arrival has exceeded capacity.
⚠️ Do not read the prefix-cache panel's levels off a screenshot of the rig. The query transfers unchanged, and both counters are real vLLM V1 series in real units - but the simulated hit rates are set per load profile and are invented, chosen so the two tenants draw distinguishable lines. Your own reuse depends on how much prompt prefix your traffic shares, which no simulator can tell you. The panel is worth building here; the number on it is not worth quoting.
What it needs - read this before importing
Unlike a pure vllm:* board, eight panels read recording rules rather than raw series, and two more read simulator-only metrics. Import without them and you get an empty board and no explanation.
| Tier | Series | Against real vLLM |
|---|---|---|
| vLLM V1 | vllm:num_requests_running, _waiting, kv_cache_usage_perc, prompt_tokens_total, generation_tokens_total, request_success_total, prefix_cache_queries_total, prefix_cache_hits_total, and the time_to_first_token_seconds / inter_token_latency_seconds / e2e_request_latency_seconds / request_queue_time_seconds / request_prefill_time_seconds / request_decode_time_seconds histograms | emitted directly - nothing to do |
| recording rules | llm:ttft:p95_5m, llm:tpot:p95_5m, llm:decode:p95_5m, llm:tokens:generation_rate5m, llm:tokens:prompt_rate5m, llm:prefix_cache:hit_ratio5m, llm:tokens_per_watt:5m, the four phase means llm:queue:mean5m / llm:prefill:mean5m / llm:decode:mean5m / llm:e2e:mean5m, and the four SLO ratios llm:ttft:slo_ratio5m / 30m / 1h / 6h | you must apply these (below), or inline the expressions into the panels |
| simulator-only | llmsim_profile_generation, llmsim_requests_rejected_total, llmsim_gpu_binding_info | never emitted by vLLM - those panels stay blank, see trimming |
⚠️ The two prefix-cache counters are V1-only. On an older engine they do not exist at all - v0 published a single gauge instead - so that panel is blank rather than wrong. See V1 metric names.
The recording rules
Quantiles are recorded once rather than repeated in every panel and alert, so a dashboard and the alert firing beside it can never disagree about what "p95 TTFT" means:
- record: llm:ttft:p95_5m
expr: histogram_quantile(0.95, sum by (model_name, le) (rate(vllm:time_to_first_token_seconds_bucket[5m])))
- record: llm:tpot:p95_5m
expr: histogram_quantile(0.95, sum by (model_name, le) (rate(vllm:inter_token_latency_seconds_bucket[5m])))
- record: llm:tokens:generation_rate5m
expr: sum by (model_name) (rate(vllm:generation_tokens_total[5m]))
- record: llm:tokens:prompt_rate5m
expr: sum by (model_name) (rate(vllm:prompt_tokens_total[5m]))
- record: llm:prefix_cache:hit_ratio5m
expr: sum by (model_name) (rate(vllm:prefix_cache_hits_total[5m])) / clamp_min(sum by (model_name) (rate(vllm:prefix_cache_queries_total[5m])), 1e-9)
The cross-domain rule. CLUSTER-AGGREGATE on purpose - power is per GPU, not
per model, so this is the one rule here that is deliberately not by (model_name).
Needs DCGM in the same Prometheus; without it the panel is blank.
- record: llm:tokens_per_watt:5m
expr: sum(rate(vllm:generation_tokens_total[5m])) / sum(DCGM_FI_DEV_POWER_USAGE)
The request phase breakdown. MEANS - see the caveat below for why not p95s.
- record: llm:queue:mean5m
expr: sum by (model_name) (rate(vllm:request_queue_time_seconds_sum[5m])) / clamp_min(sum by (model_name) (rate(vllm:request_queue_time_seconds_count[5m])), 1e-9)
- record: llm:prefill:mean5m
expr: sum by (model_name) (rate(vllm:request_prefill_time_seconds_sum[5m])) / clamp_min(sum by (model_name) (rate(vllm:request_prefill_time_seconds_count[5m])), 1e-9)
- record: llm:decode:mean5m
expr: sum by (model_name) (rate(vllm:request_decode_time_seconds_sum[5m])) / clamp_min(sum by (model_name) (rate(vllm:request_decode_time_seconds_count[5m])), 1e-9)
- record: llm:e2e:mean5m
expr: sum by (model_name) (rate(vllm:e2e_request_latency_seconds_sum[5m])) / clamp_min(sum by (model_name) (rate(vllm:e2e_request_latency_seconds_count[5m])), 1e-9)
Decode is the ONE phase these buckets resolve tolerably. There is deliberately
no prefill p95 (3.03x overstated) and no e2e p95 (1.71x under saturation).
- record: llm:decode:p95_5m
expr: histogram_quantile(0.95, sum by (model_name, le) (rate(vllm:request_decode_time_seconds_bucket[5m])))
The SLI, four windows of it. A RATIO AT A BUCKET BOUNDARY, not a percentile -
see "Building an SLO on this" below for why that distinction is the whole point.
le="2.5" is a real member of TTFT_BUCKETS and le="2" is not: a matcher that
misses returns nothing, and the burn alerts then never fire.
⚠️ Each rule uses ITS OWN window in BOTH range vectors. A slo_ratio6h built on
[5m] returns a plausible number under the wrong name and nothing catches it.
- record: llm:ttft:slo_ratio5m
expr: sum by (model_name) (rate(vllm:time_to_first_token_seconds_bucket{le="2.5"}[5m])) / clamp_min(sum by (model_name) (rate(vllm:time_to_first_token_seconds_count[5m])), 1e-9)
- record: llm:ttft:slo_ratio30m
expr: sum by (model_name) (rate(vllm:time_to_first_token_seconds_bucket{le="2.5"}[30m])) / clamp_min(sum by (model_name) (rate(vllm:time_to_first_token_seconds_count[30m])), 1e-9)
- record: llm:ttft:slo_ratio1h
expr: sum by (model_name) (rate(vllm:time_to_first_token_seconds_bucket{le="2.5"}[1h])) / clamp_min(sum by (model_name) (rate(vllm:time_to_first_token_seconds_count[1h])), 1e-9)
- record: llm:ttft:slo_ratio6h
expr: sum by (model_name) (rate(vllm:time_to_first_token_seconds_bucket{le="2.5"}[6h])) / clamp_min(sum by (model_name) (rate(vllm:time_to_first_token_seconds_count[6h])), 1e-9)
⚠️ llm:e2e:mean5m looks redundant and is not. It is the right-hand side of does the breakdown add up, and the three phase means only mean something against it. It also has to be a rule rather than an inlined rate(_sum)/rate(_count) if you carry a source-style label on your recorded series: mixing a labelled left-hand side with an unlabelled right-hand side matches nothing, and the obvious repair (on(model_name)) then drops the label from the result - right arithmetic, wrong labels, reading as an arithmetic bug.
⚠️ Aggregate by (model_name), not globally. A global quantile merges every tenant into one number that describes none of them, and hides the degraded one - which is the tenant the alert exists to catch. The p50 and p99 variants are in the source file if you want them.
Three traps worth inheriting, all encoded above:
The prefix-cache denominator is clamped at an epsilon, not at 1.
clamp_min(x, 1)is the usual divide-by-zero guard and it is wrong for a rate: a low-traffic deployment can genuinely sit below one queried token per second, and flooring there quietly under-reports the hit ratio of exactly the deployments least likely to notice. At an epsilon, an idle tenant reads0/1e-9 = 0- a flat line at zero rather than aNaN. Both counters are in tokens, andhits ≤ queriesby construction, so the numerator can never be positive while the denominator is zero.Do not point
llm:tpot:p95_5matvllm:request_time_per_output_token_seconds, which current vLLM also exposes. That is a per-request mean, not a per-token histogram, and the quantile means something different.The rule name says
tpotwhile the series saysinter_token_latencyon purpose. V1 renamed the metric; TPOT is what people call the measurement, and renaming the recorded series would break every dashboard and alert built on it for no gain.
Ready to apply as a PrometheusRule, reasoning included: manifests/alerts/llm-prometheusrule.yaml.
Because these are recording rules, the panels fill in going forward from when the rules were applied, and rate() over [5m] under-reads until the window fills - expect a few minutes of climb on a fresh install rather than a jump to the true value.
⚠️ V1 metric names - check yours before blaming the board
Two series were spelled differently before the V1 engine, and this board uses the new names:
| Older vLLM | V1, used here |
|---|---|
vllm:gpu_cache_usage_perc | vllm:kv_cache_usage_perc |
vllm:time_per_output_token_seconds | vllm:inter_token_latency_seconds |
Nothing errors when this is wrong - that is the problem. A renamed metric fails silently: the panel goes blank and the alert stops firing while everything else stays green. On an older engine, rewrite those two names in the JSON.
Prefix caching is not a rename, and cannot be fixed by rewriting a name. Older vLLM published a single gauge, vllm:gpu_prefix_cache_hit_rate; V1 replaced it with two counters. The shape changed, so the repair is a different query:
| Older vLLM | V1, used here |
|---|---|
vllm:gpu_prefix_cache_hit_rate (gauge, already a ratio) | rate(vllm:prefix_cache_hits_total[5m]) / rate(vllm:prefix_cache_queries_total[5m]) |
If you are on an older engine, point that panel at the gauge directly and drop the recording rule - there is nothing to take a ratio of.
Read the phase breakdown as MEANS - and never build a prefill SLO on a p95
The breakdown panel plots _sum / _count per phase rather than percentiles. That is not a shortcut, and swapping it back to histogram_quantile breaks the panel in two independent ways - both measured, and the second one transfers to your deployment.
1. Quantiles are not additive, so a p95 breakdown does not add up. Measured on the steady tenant with perfect resolution, no bucket error involved at all:
p95:   queue 0.000 + prefill 0.094 + decode 7.379 = 7.473   vs p95(e2e) 7.468   DOES NOT ADD UP
mean:  queue 0.001 + prefill 0.080 + decode 5.020 = 5.101   vs mean(e2e) 5.101  ADDS UP EXACTLY
Expectation is linear; the 95th percentile is not. A stacked breakdown whose segments do not reach the total reads as a bug in the rig, forever, to everyone who looks at it.
2. ⚠️ These buckets cannot resolve prefill, and that is upstream's layout rather than this rig's. The first request_latency_buckets boundary is 0.3, and modelled prefill here is 0.08s - so every prefill observation lands in the first bucket and histogram_quantile interpolates from zero across it. Measured over ~1000 completed requests on each shipped tenant:
| steady | saturated | |
|---|---|---|
| prefill | 3.03x (0.095s reported as 0.285s) | 3.03x |
| decode | 1.26x | 1.12x |
| e2e | 1.25x | 1.71x (67.97s reported as 116.26s) |
For scale, the inter-token latency caveat below - which has its own section on this page - is a 1.08x effect. Prefill is three times worse than that, on both tenants.
This transfers. Real vLLM declares these same boundaries, so a real deployment with sub-300ms prefill reads exactly as high. It is not a simulation artefact you can ignore. Do not derive a prefill SLO from a p95 over these buckets, and do not "fix" it by substituting a finer low-end bucket list - the boundaries are what make a query built here work unchanged against your engine.
A histogram mean carries no bucket dependence at all (_sum and _count are exact), so it is immune to the second problem, and it is additive, so it is immune to the first. That is why the breakdown is means.
The one recorded percentile is llm:decode:p95_5m, scoped to decode because it is the only phase these buckets resolve tolerably (1.12x-1.26x). There is deliberately no llm:prefill:p95_5m and no llm:e2e:p95_5m - a recorded series is exactly how a wrong number acquires an air of authority, and e2e is the worst of the three on the saturated tenant, which is the tenant this board exists to show.
Building an SLO on this: a ratio at a bucket boundary, not a percentile
Everything above says don't — don't set a prefill SLO on a p95, don't set an ITL SLO from a number in a wide bucket, don't ship the 2s threshold as an objective. Here is the other half, because the constraint that makes those warnings true is also the one that says how to build an objective that works.
Every caveat on this page is a property of histogram_quantile interpolating inside a bucket. That is where the 3.03x on prefill and the 1.71x on e2e come from. A ratio evaluated at a boundary does no interpolation and carries no bucket-width dependence at all:
sum by (model_name) (rate(vllm:time_to_first_token_seconds_bucket{le="2.5"}[5m]))
/ clamp_min(sum by (model_name) (rate(vllm:time_to_first_token_seconds_count[5m])), 1e-9)
That is "the proportion of requests that reached a first token within 2.5s", and it is exact. The bucket layout is not an obstacle to an SLO. It is the design constraint: your threshold must be a boundary.
The board ships this as llm:ttft:slo_ratio5m / 30m / 1h / 6h against a 99% objective, with the standard fast/slow burn-rate pair over it — > 14.4x on the 1h and 5m windows, > 6x on the 6h and 30m. Both are in manifests/alerts/llm-prometheusrule.yaml.
⚠️ le="2" matches nothing. TTFT_BUCKETS steps … 1.0, 2.5, 5.0 … — there is no 2.0 boundary. A matcher that misses returns an empty vector, the ratio evaluates to nothing, and the burn alerts never fire: green forever, on a rule that reads correctly. Check the boundary you are asking for is in the list.
Four things this technique costs you
1. Your threshold is constrained to the boundaries you have. If your business wants 2s, this method cannot express it. The honest options are to move the objective to a real boundary, to accept an interpolated percentile and carry its error bar, or to change the bucket list — which forfeits the transferability that made the query worth building here. This belongs to the approach, not to this rig, so you inherit it against real vLLM too.
2. "Exact" has a condition. It holds because numerator and denominator are the same histogram, on the same target, at the same scrape timestamps — so rate()'s extrapolation factor is common to both and cancels. Sum across replicas whose scrapes are out of phase and the cancellation stops being exact. One pod per model here; if you run four, know why it might not hold.
3. It is a latency objective, not an availability one — a total stall reads as healthy. A request that never reaches a first token contributes no observation at all: not a slow one, not a failed one. So a tenant whose queue has stopped draining produces nothing of either kind, and the burn alerts carry a traffic guard that then suppresses them by design. LLMQueueBacklog is what fires when requests arrive and never complete; LLMMetricsAbsent when the series stop entirely. An SLO whose scope is unstated gets read as covering availability. This one does not.
⚠️ That guard is also a trade rather than a free win: it stops pages for idle models, and it stops a burned budget alerting once traffic stops. Its window must match each alert's own short window — 5m on the fast one, 30m on the slow — because a guard narrower than the alert it protects silences a real burn.
4. The 6h window is not exercised on this rig, which lives minutes. The slow-burn alert transfers but cannot be watched moving here; it is covered on both sides by promtool tests instead, which synthesise six hours in about a second. To watch it on the rig, shorten both windows in a fork of the rule.
Finally: Prometheus native histograms would dissolve limit 1 entirely — exponential buckets with configurable resolution mean any threshold is expressible. The constraint above is a property of classic histograms, not a law of nature. Real vLLM emits classic histograms today, which is why this board is built on them.
Read the inter-token latency panel carefully
The p95 there is dominated by bucket resolution, not by load, and this is one caveat that transfers to real hardware rather than being a simulation artifact - real vLLM uses the same bucket boundaries.
Worked through on the rig: a full batch models ITL at 22.5 ms, which falls inside the wide (10ms, 25ms] bucket, so histogram_quantile interpolates across a 15 ms gap and reports ~24 ms. The panel is not wrong and neither is the histogram; the resolution simply is not there. Do not set an ITL SLO from a number that lands in a wide bucket - check which bucket your operating point falls into first.
The same effect moved TTFT's reported numbers when V1 replaced its entire tail above 10s (15/20/30/45/60/90/120 became 20/40/80/160/640/2560), with the saturated tenant sitting at ~58s, inside the part that changed. If a screenshot of this board disagrees with what your own deployment reports, bucket resolution is the first thing to check, not the board.
The cross-domain panel
llm:tokens_per_watt:5m is sum(rate(vllm:generation_tokens_total[5m])) / sum(DCGM_FI_DEV_POWER_USAGE) - cluster-aggregate, and it needs DCGM metrics in the same Prometheus. Without the recording rule above, or without a GPU exporter behind it, the panel is blank; that is expected, not a fault.
⚠️ On this rig the two signals are driven independently: GPU load comes from pod annotations, LLM load from simulator profiles, and nothing makes one follow the other. The panel demonstrates the query pattern and the wiring across two metric families - it does not show causation. Against real hardware it becomes meaningful, provided you are honest about which GPUs are actually serving the model.
Variables
| Variable | Query | |
|---|---|---|
| Prometheus datasource | - | prompted for at import |
Model | label_values(vllm:num_requests_running, model_name) | multi-select, defaults to All |
The model query works against real vLLM unchanged. $model filters every panel and drives the repeat on running-vs-waiting, so a fleet of ten models yields ten of those panels at two per row - narrow the selection if that is more than you want.
Import
Grafana Dashboards → New → Import, by id or by uploading the JSON. It prompts for a Prometheus datasource; the model variable populates itself.
| Grafana | 10.0 or newer (schemaVersion 39) |
| Datasource | Prometheus, prompted for on import |
| Panel plugins | timeseries, stat, table - all core |
| Default window | last 15 minutes, refresh 30s |
The 15-minute default suits a rig that has been up for minutes. On a 30-minute window a short history is squeezed into the right-hand third with the rest of the canvas blank, which reads as "the panels never populated" when the data was there all along. With real retention behind you, widen it.
Trimming it for a real deployment
Two panels and one series are rig-specific. Delete them and the rest stands on its own:
- Profile generation -
llmsim_profile_generationticks when a simulator reloads its load profile. No analogue in vLLM. - Simulated GPU attribution - joins simulator pods to the GPUs they hold. The join itself is worth stealing even though the panel is not: it goes
on (namespace, pod), neveron (UUID), because the device plugin's allocation id and DCGM's UUID come from different code paths and never match. Anon (UUID)join returns nothing, silently and forever. - The rejected series on request outcomes -
llmsim_requests_rejected_totalcounts arrivals refused at the in-flight cap. A rejected request never ran, so it is deliberately not a vLLM "success" of anyfinished_reason; real vLLM leaves that accounting to whatever sits in front of it.
Also reconsider the 2s TTFT threshold line. It is placed between this rig's two tenants (~0.1s and ~60s) to make the demonstration legible. It is not an SLO, and a threshold tuned against synthetic latency is not one to ship.
Matching alerts
The rules that ship alongside the board, unit-tested with promtool on both sides of every threshold:
| Alert | Expression | For |
|---|---|---|
LLMHighTTFT | llm:ttft:p95_5m > 2 | 2m |
LLMQueueBacklog | vllm:num_requests_waiting > 50 | 5m |
LLMKVCacheSaturated | vllm:kv_cache_usage_perc > 0.9 | 5m |
LLMMetricsAbsent | absent(vllm:num_requests_running) | 5m |
LLMTTFTErrorBudgetFastBurn | burn > 14.4 on llm:ttft:slo_ratio1h and slo_ratio5m | - |
LLMTTFTErrorBudgetSlowBurn | burn > 6 on llm:ttft:slo_ratio6h and slo_ratio30m | - |
The two burn alerts carry no for:, and that is a decision rather than an omission: the long window already provides the smoothing a for: would add, and stacking both would delay a genuine fast burn by the for: on top of an hour of averaging. Both also carry a traffic guard whose window matches the alert's own short window - without it, an idle tenant reads 0/1e-9 = 0 and they fire hardest on a model serving nothing at all.
vllm:kv_cache_usage_perc is a fraction (0–1), so > 0.9 is correct and > 90 can never fire - an easy one to get wrong, and it fails by staying silent forever.
Source
Original to k8s-ai-observability, not derived from another catalog board. MIT licensed.
The repo runs two simulated tenants - one healthy, one deliberately overloaded - from a dependency-free Python file that emits real vLLM names, types and histogram buckets, with both the boundaries and the metric set drift-checked weekly against vllm/v1/metrics/loggers.py. It can also emit the superseded v0 surface alongside the V1 one, which turns it into an upgrade rehearsal: point your existing dashboard at it and every panel still bound to an old name is a panel your engine upgrade will break - including prefix caching, where the fix is a different query rather than a different name. On kind, EKS, GKE, or docker compose up with no Kubernetes at all.
Data source config
Collector config:
Upload an updated version of an exported dashboard.json file from Grafana
| Revision | Description | Created | |
|---|---|---|---|
| Download |

TensorFlow Serving

Monitor TensorFlow Serving with Grafana. Easily keep tabs on your instance with Grafana Cloud's out-of-the-box monitoring solution.
Learn more