
GPU Simulation - DCGM Overview
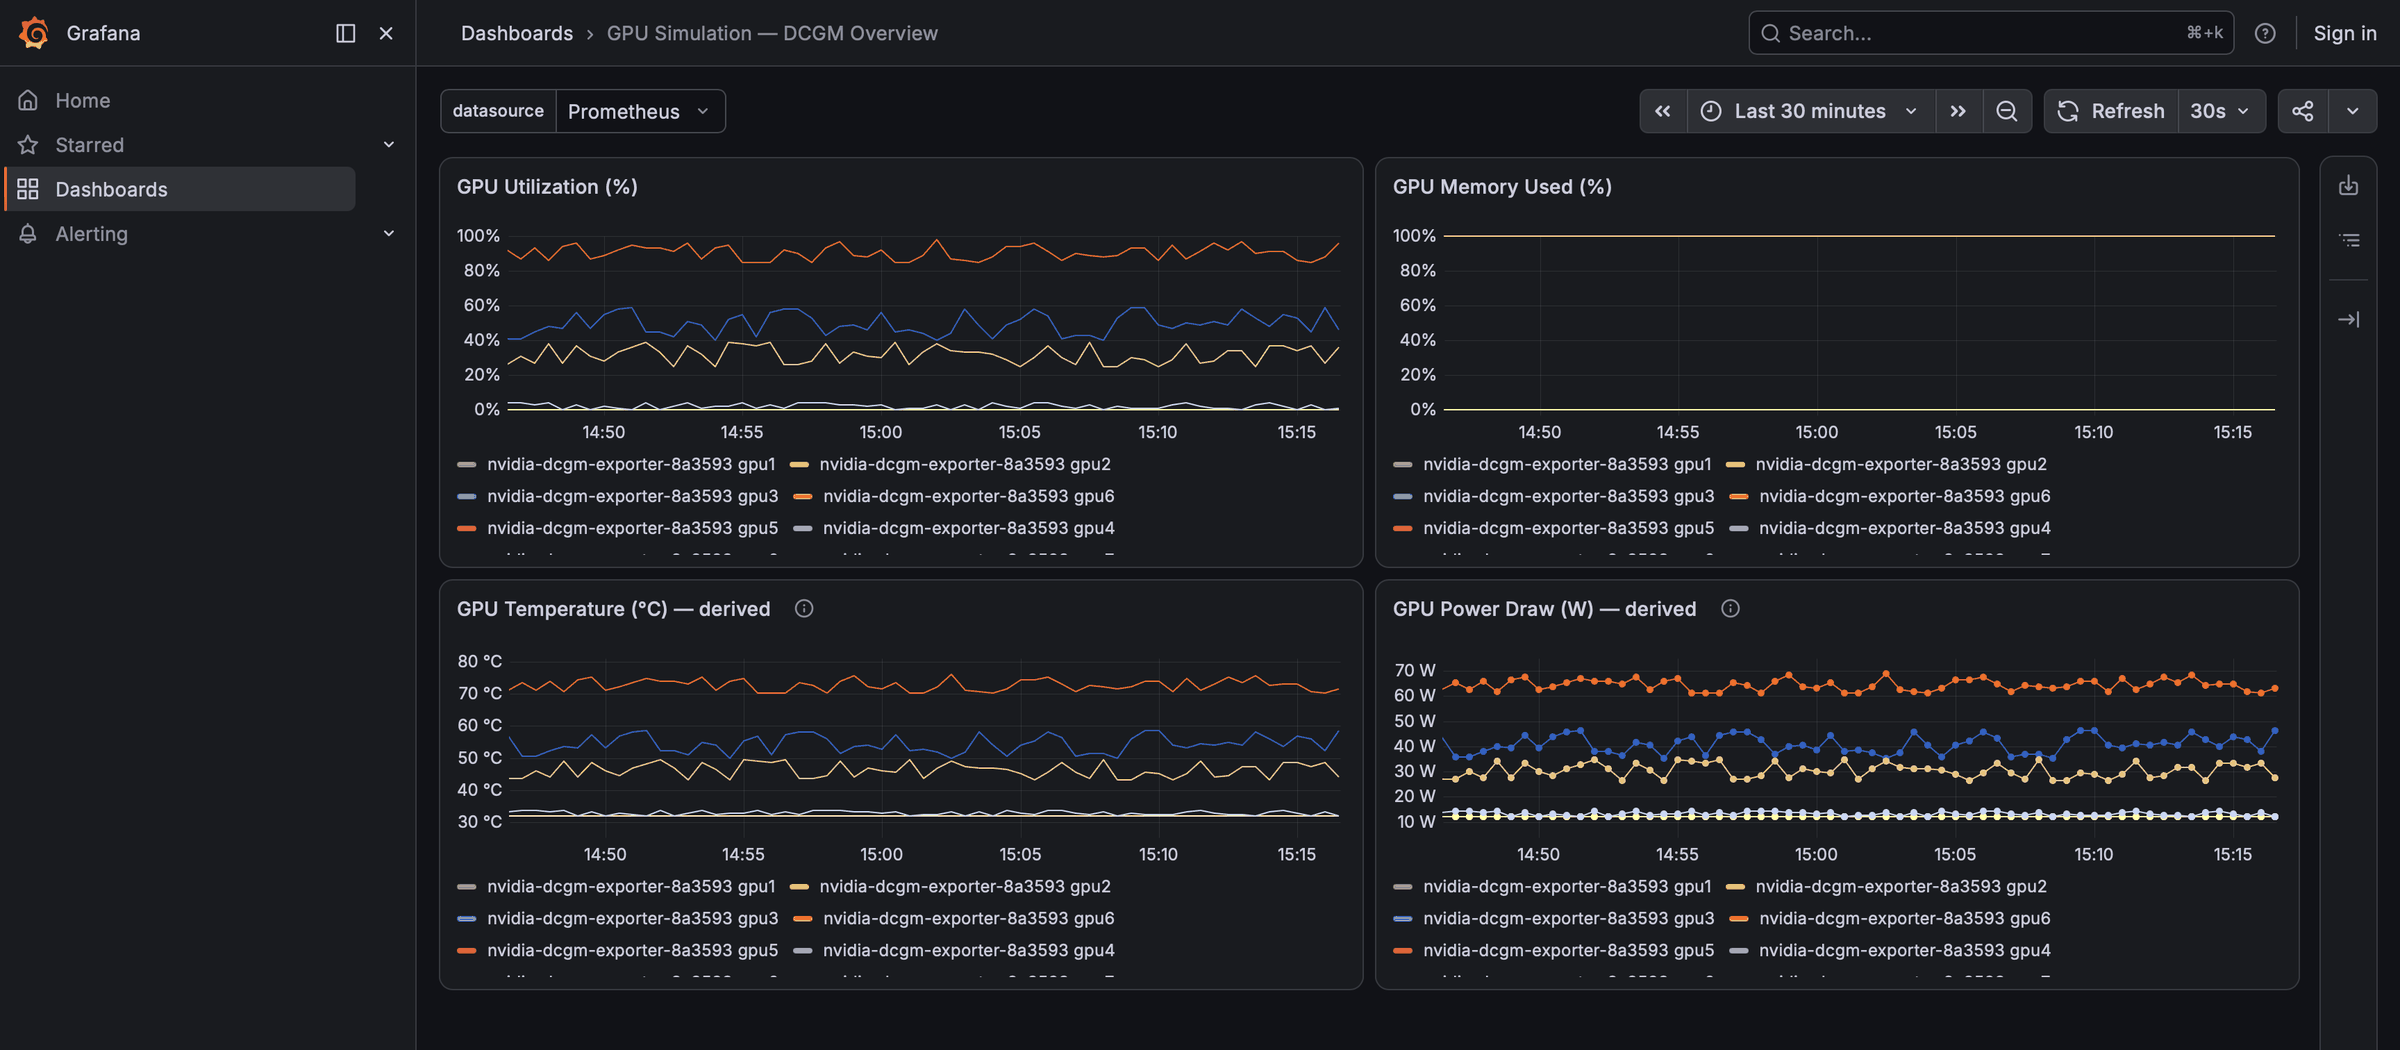
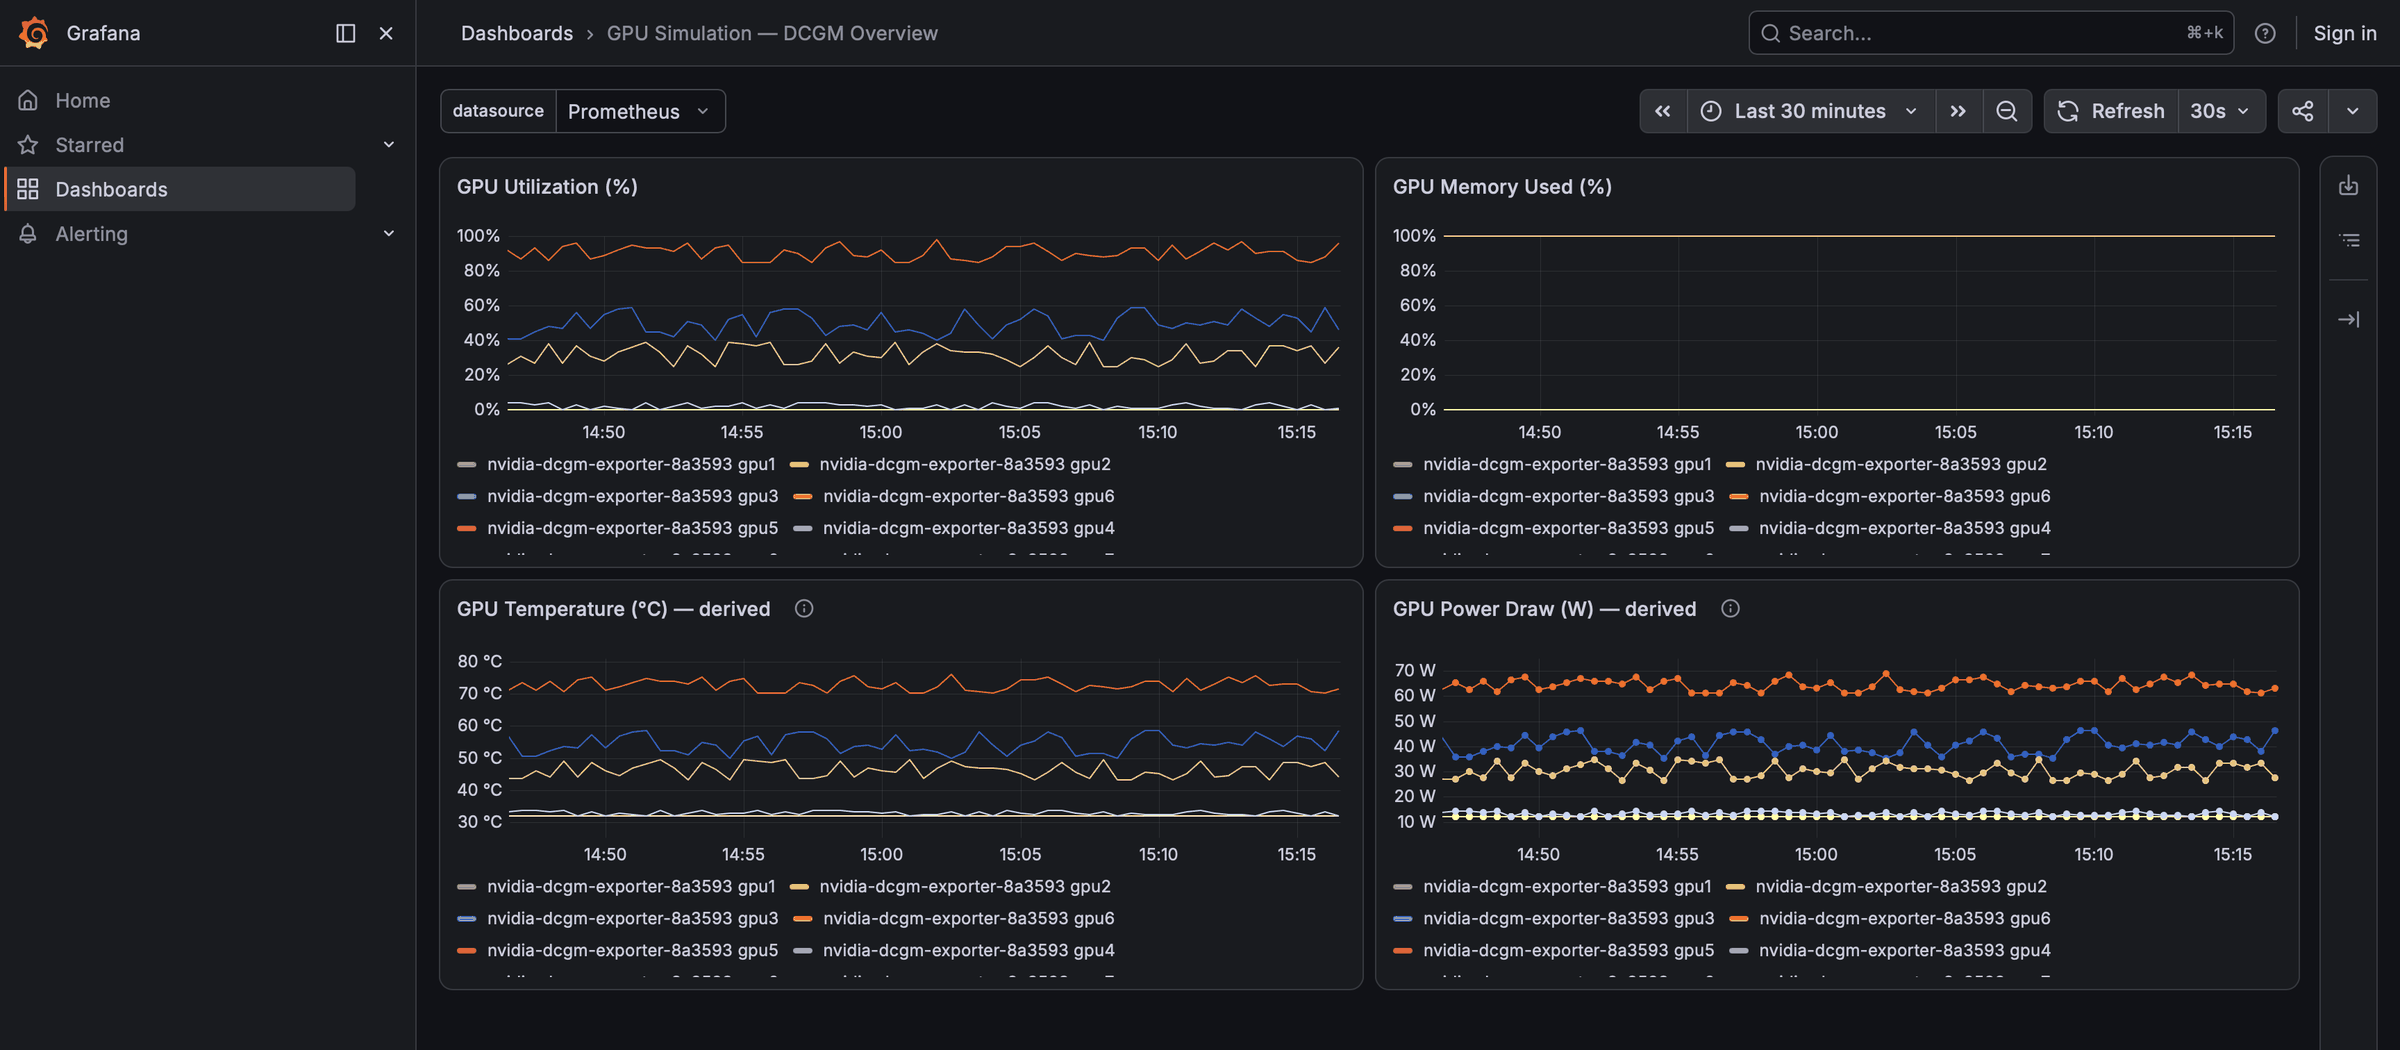
NVIDIA GPU overview from DCGM metrics: utilisation, framebuffer memory, temperature and power, one series per GPU. Works against a real dcgm-exporter unchanged; temperature and power ship as recording rules.
GPU Simulation - DCGM Overview
Utilisation, memory, temperature and power across NVIDIA GPUs, from DCGM-format metrics. Four time-series panels, one series per GPU, no filtering to set up first.
Built for a simulated GPU fleet - the board ships with
k8s-ai-observability, a rig that stands up GPU and LLM observability with no GPU - but every query is plain DCGM PromQL, so it works against a real dcgm-exporter unchanged. That is the point of it: build the board without hardware, keep it when the hardware arrives.
Panels
| Panel | Query | Unit |
|---|---|---|
| GPU Utilization (%) | DCGM_FI_DEV_GPU_UTIL | percent, axis pinned 0–100 |
| GPU Memory Used (%) | 100 * DCGM_FI_DEV_FB_USED / clamp_min(DCGM_FI_DEV_FB_USED + DCGM_FI_DEV_FB_FREE, 1) | percent, axis pinned 0–100 |
| GPU Temperature (°C) | DCGM_FI_DEV_GPU_TEMP | celsius |
| GPU Power Draw (W) | DCGM_FI_DEV_POWER_USAGE | watt |
Memory is computed from FB_USED and FB_FREE rather than FB_TOTAL, which not every exporter build emits; clamp_min(..., 1) keeps the panel blank rather than NaN when a GPU reports both as zero. The axes are pinned to 0–100 so an idle fleet reads as a flat line at the bottom of the panel rather than a full-height wander through noise.
Every panel legends as {{Hostname}} gpu{{gpu}} - both labels come from a stock dcgm-exporter. If yours is relabelled (some Helm charts rewrite Hostname to node), edit the four legend formats or the traces come out unnamed.
Metrics it needs
| Metric | Panel | Emitted by a real dcgm-exporter? |
|---|---|---|
DCGM_FI_DEV_GPU_UTIL | utilisation | yes |
DCGM_FI_DEV_FB_USED / DCGM_FI_DEV_FB_FREE | memory | yes |
DCGM_FI_DEV_GPU_TEMP | temperature | yes |
DCGM_FI_DEV_POWER_USAGE | power | yes |
Against real hardware that is the whole dependency list - scrape dcgm-exporter, import, done. Against a simulated source, read the next section first.
⚠️ Temperature and power, against a simulated GPU
run-ai/fake-gpu-operator - the usual way to get DCGM metrics without a GPU - emits only three series: DCGM_FI_DEV_GPU_UTIL, _FB_USED and _FB_FREE. There is no temperature and no power, and no chart knob to add them. Import this board against it and the bottom two panels stay permanently blank.
The fix is two recording rules that synthesise both from utilisation on a Tesla-T4 curve and record them under the real DCGM names, so this board - and any stock DCGM board - finds the series it expects:
- record: DCGM_FI_DEV_GPU_TEMP
expr: (32 + 0.45 * DCGM_FI_DEV_GPU_UTIL) unless on (UUID) DCGM_FI_DEV_GPU_TEMP{source!="derived"}
labels: { source: derived }
- record: DCGM_FI_DEV_POWER_USAGE
expr: (12 + 0.58 * DCGM_FI_DEV_GPU_UTIL) unless on (UUID) DCGM_FI_DEV_POWER_USAGE{source!="derived"}
labels: { source: derived }
32 °C idle → ~77 °C at full load, 12 W → 70 W (T4 TDP). Two properties are worth keeping if you adapt them:
source="derived"on every sample, so a synthesised reading is always distinguishable from an exporter oneDCGM_FI_DEV_GPU_TEMP{source!="derived"}gives you genuine data only.- the
unless on (UUID)clause, which makes the rules self-disabling: if your exporter ever starts emitting the real series for a GPU, the derived sample for that GPU stops instead of double-plotting alongside it. The{source!="derived"}matcher inside it is load-bearing - without it the rule reads back its own output and cancels itself on alternate evaluations.
Ready to apply as a PrometheusRule, with the reasoning in full:
manifests/alerts/gpu-prometheusrule.yaml.
Because they are recording rules, the two panels fill in going forward from when the rules were applied - expect an empty left-hand edge on a fresh install.
Import
Grafana Dashboards → New → Import, by id or by uploading the JSON. It prompts for a Prometheus datasource; nothing else needs configuring.
| Grafana | 10.0 or newer (schemaVersion 39) |
| Datasource | Prometheus, prompted for on import |
| Panel plugins | timeseries only — core, nothing to install |
| Default window | last 15 minutes, refresh 30s |
The 15-minute default is deliberate, and the first thing to change if you point this at a long-lived cluster. It suits a rig that has been up for minutes: on a 30-minute window a short history is squeezed into the right-hand third with the rest of the canvas blank, which reads as "the panels never populated" when the data was there all along. With weeks of retention behind you, widen it.
What it deliberately does not do
- No filter variables. One series per GPU, no node or GPU picker. That is right for a fleet you can see at a glance and wrong past a few dozen GPUs - add a
label_values(DCGM_FI_DEV_GPU_UTIL, Hostname)variable and a{Hostname=~"$node"}matcher to each query if you need one. - No per-pod attribution panel. DCGM labels an allocated GPU with its consumer, but Prometheus renames those to
exported_namespace/exported_podbecause the scrape target's own labels win the collision - a trap worth meeting deliberately rather than inside a panel. The query ismax by (exported_namespace, exported_pod, gpu (DCGM_FI_DEV_GPU_UTIL{exported_pod!=""}). - No clocks, PCIe throughput or ECC counters. They would be blank against every simulated source. Board 12239 covers that ground for real hardware.
Reading the memory panel
Against real hardware this tracks load: FB_USED follows model weights and KV-cache growth and moves continuously.
Against fake-gpu-operator it does not. Allocation there is all-or-nothing - a GPU with a pod on it reports FB_USED=15360, FB_FREE=0, an unallocated one the reverse - so the panel shows two bands with nothing between them, and tracks allocation rather than load. This is the one panel whose shape does not transfer. Worth knowing before you tune a memory threshold against it.
Matching alerts
If you want alerting to agree with the board, these are the three rules that ship alongside it, unit-tested with promtool:
| Alert | Expression | For |
|---|---|---|
GPUHighUtilization | DCGM_FI_DEV_GPU_UTIL > 80 | 1m |
GPUHighMemoryUsage | 100 * used / clamp_min(used + free, 1) > 90 | 2m |
GPUMetricsAbsent | absent(DCGM_FI_DEV_GPU_UTIL) | 5m |
Note that GPUHighMemoryUsage fires permanently against a simulated source, for the all-or-nothing reason above — the expression is correct, the input is degenerate.
Source
Original to k8s-ai-observability, not derived from another catalog board. MIT licensed.
The repo has this board wired up end to end - the exporter, the recording rules, the alerts and their tests, and a companion vLLM serving board - on kind, EKS, GKE, or docker compose up with no Kubernetes at all. If the panels here are empty and you want to see them populated first, that takes about a minute.
Data source config
Collector config:
Upload an updated version of an exported dashboard.json file from Grafana
| Revision | Description | Created | |
|---|---|---|---|
| Download |