
NVIDIA GPU Operator & DCGM Observability
Live NVIDIA GPU Operator and DCGM exporter observability. Covers all 23 active DCGM metric families and GPU Operator health metrics; every panel has a Grafana hover-info description.
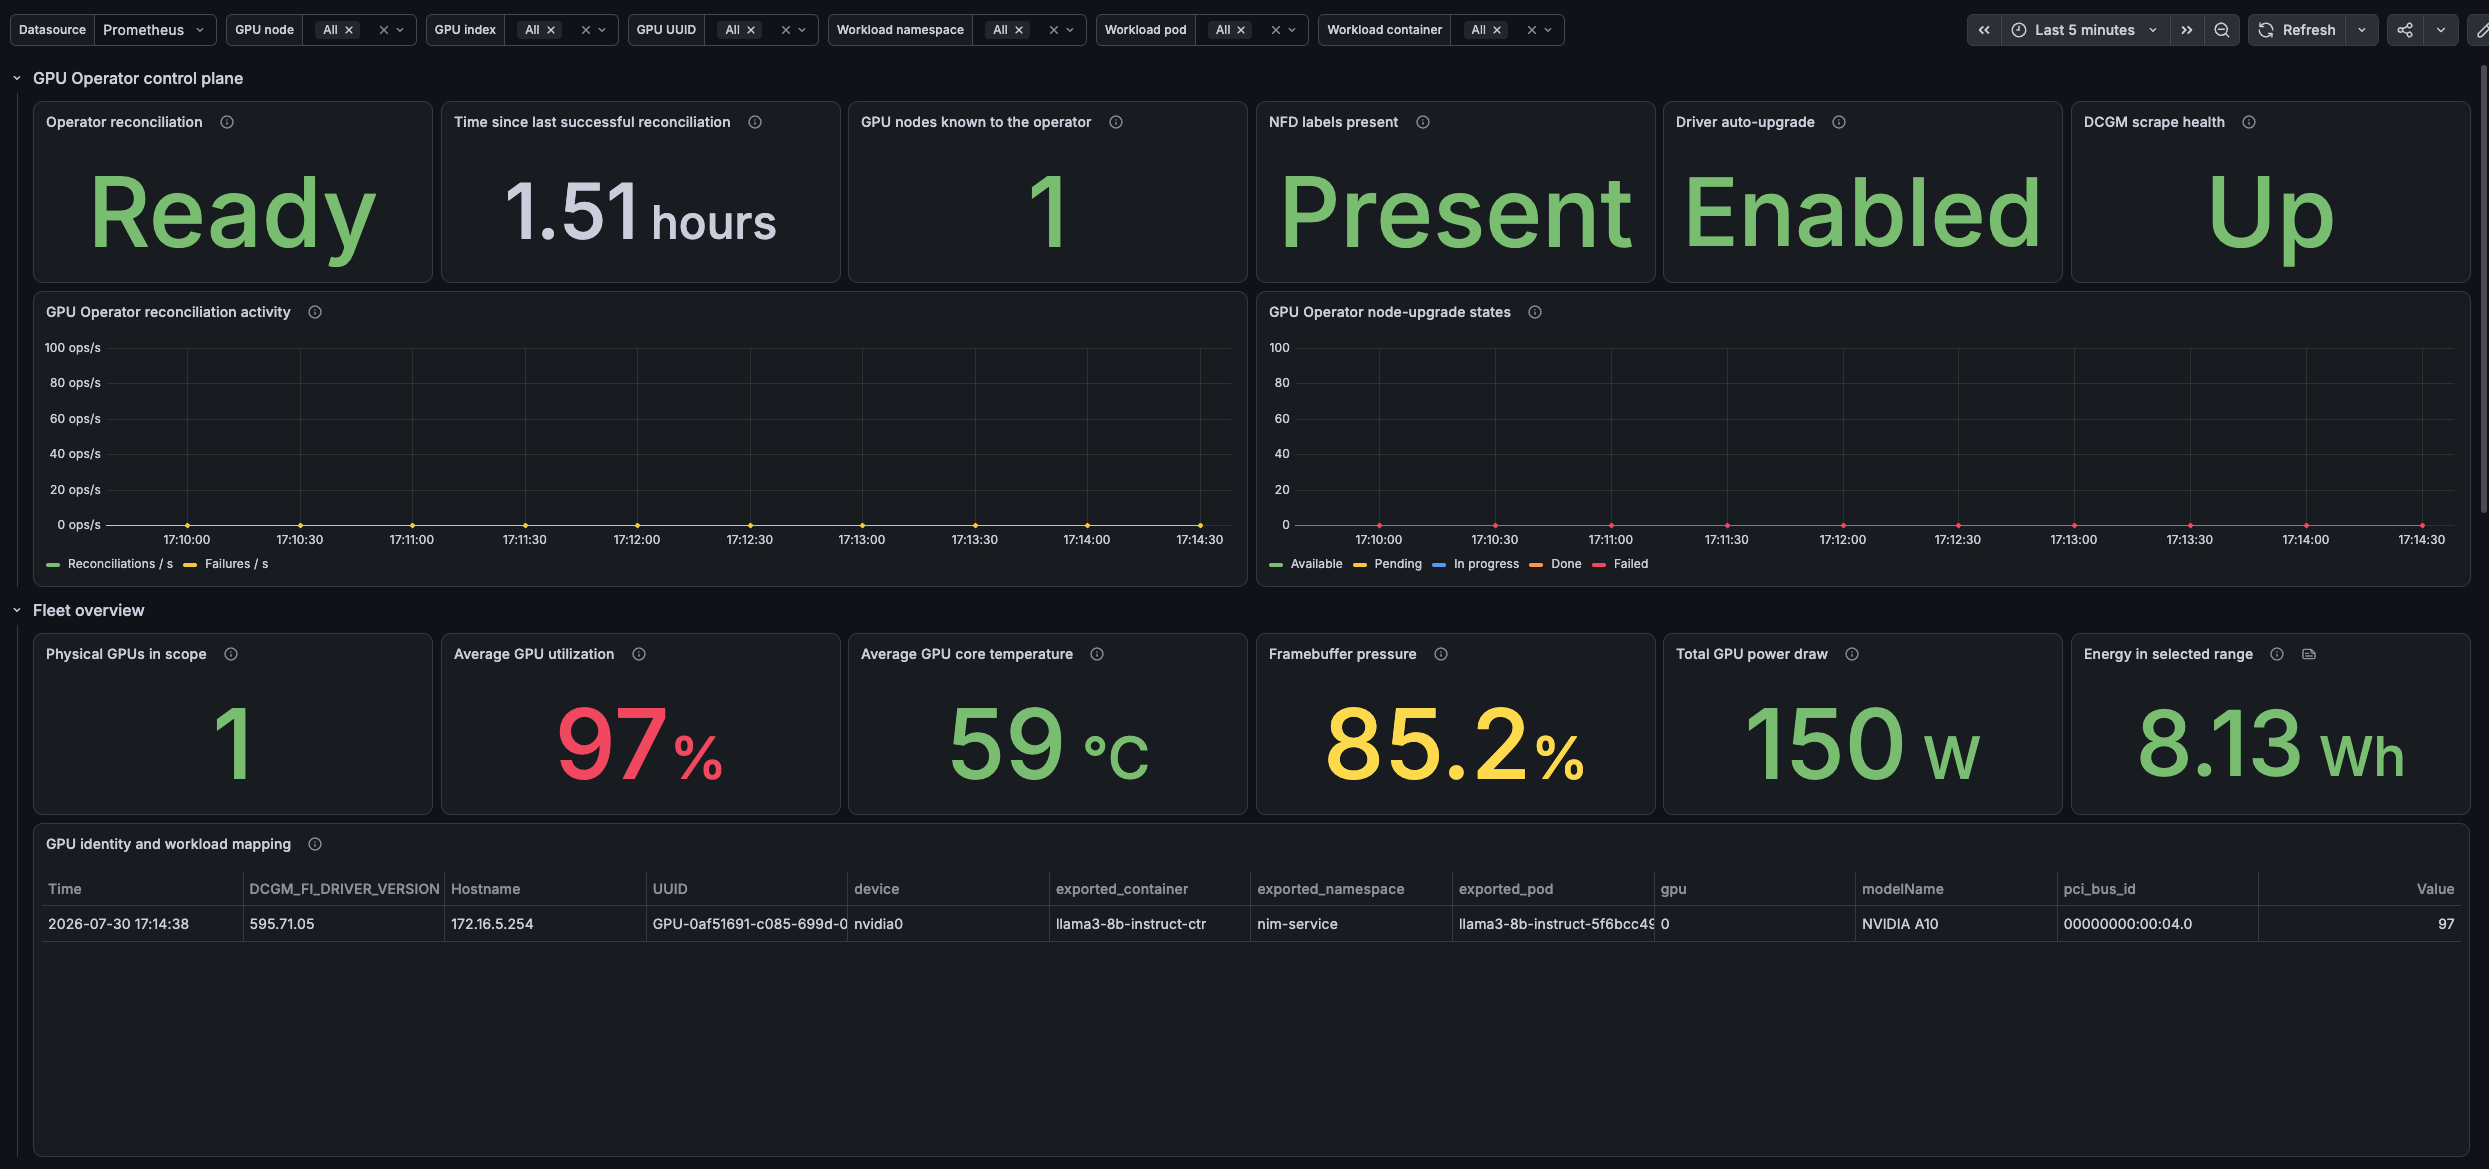
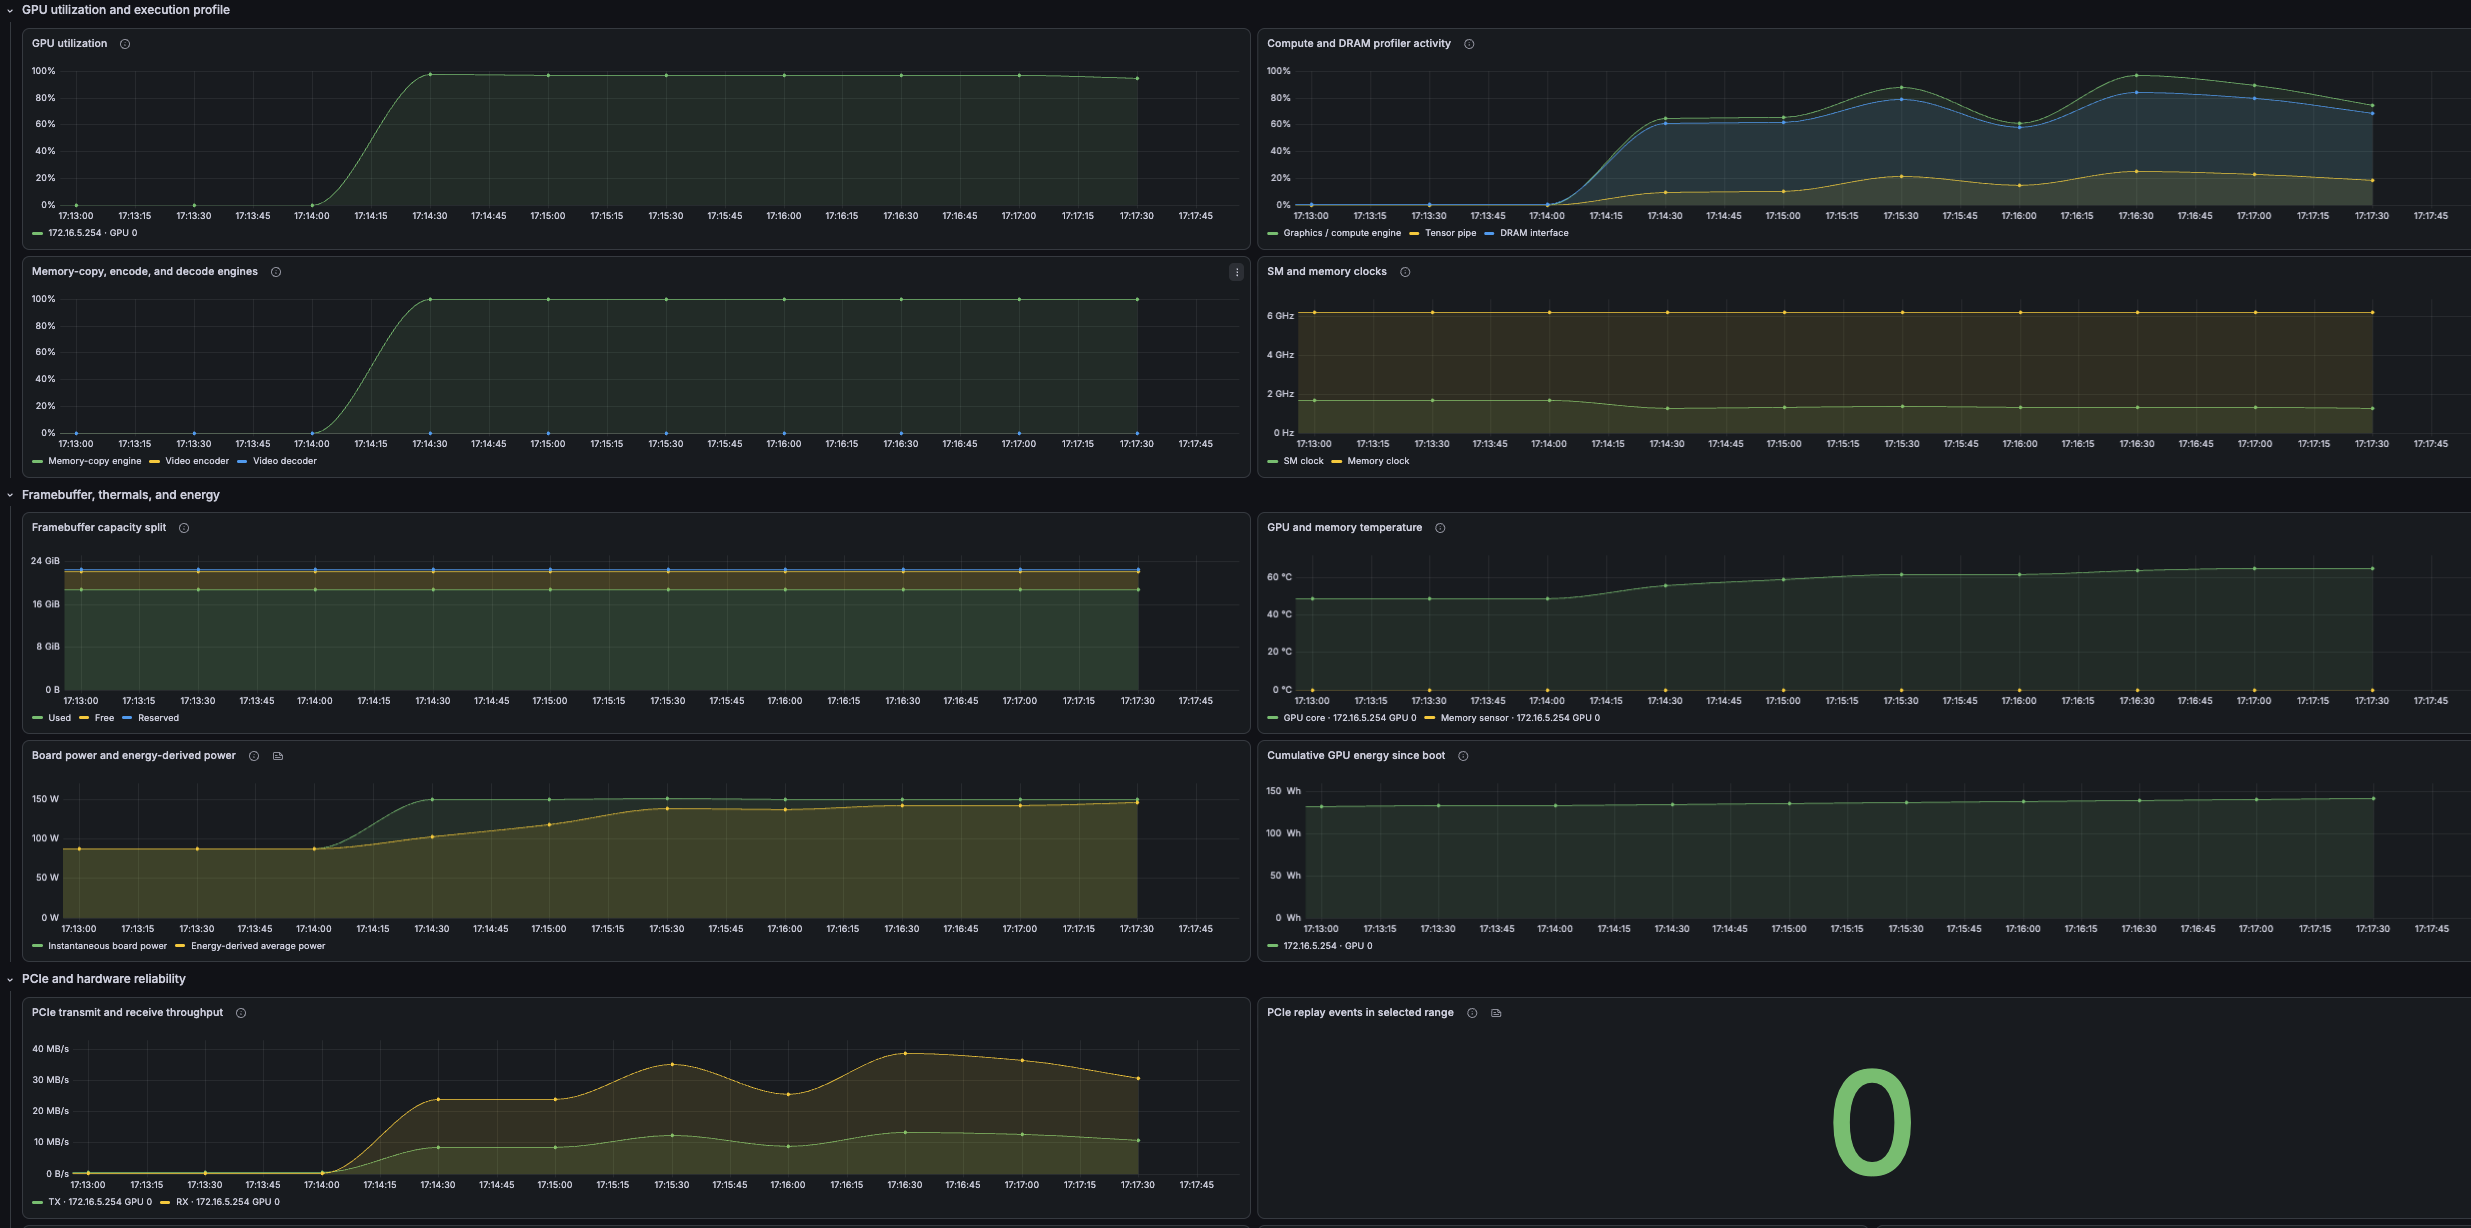
OKE NVIDIA GPU Operator & DCGM Dashboard
Classic Grafana dashboard for NVIDIA GPU Operator and DCGM Exporter telemetry on OKE or Kubernetes.
Import
- In Grafana, choose Dashboards → New → Import and select dashboard.json.
- Bind the Prometheus datasource when prompted.
- Select a GPU node, GPU, or workload using the dashboard filters.
Requirements
- Prometheus must scrape the DCGM exporter and GPU Operator.
- The default scrape jobs are nvidia-dcgm-exporter and gpu-operator. If yours differ, edit the job selectors after import.
- DCGM workload attribution requires the labels Hostname, UUID, gpu, exported_namespace, exported_pod, and exported_container.
The dashboard includes the DCGM metric families emitted by the reference GPU Operator configuration. Metrics unsupported by your GPU or collector version may show No data.
For Grafana.com sharing, upload dashboard.json as a Classic JSON dashboard. Do not upload dashboard.v2-spec.original.json.
Data source config
Collector type:
Collector plugins:
Collector config:
Revisions
Upload an updated version of an exported dashboard.json file from Grafana
| Revision | Description | Created | |
|---|---|---|---|
| Download |