
GitLab Operations — Community
Portable GitLab operations dashboard for Prometheus, Kubernetes, and optional Loki events. Configure the datasource, namespace, job, database, and container-metric variables for your environment.
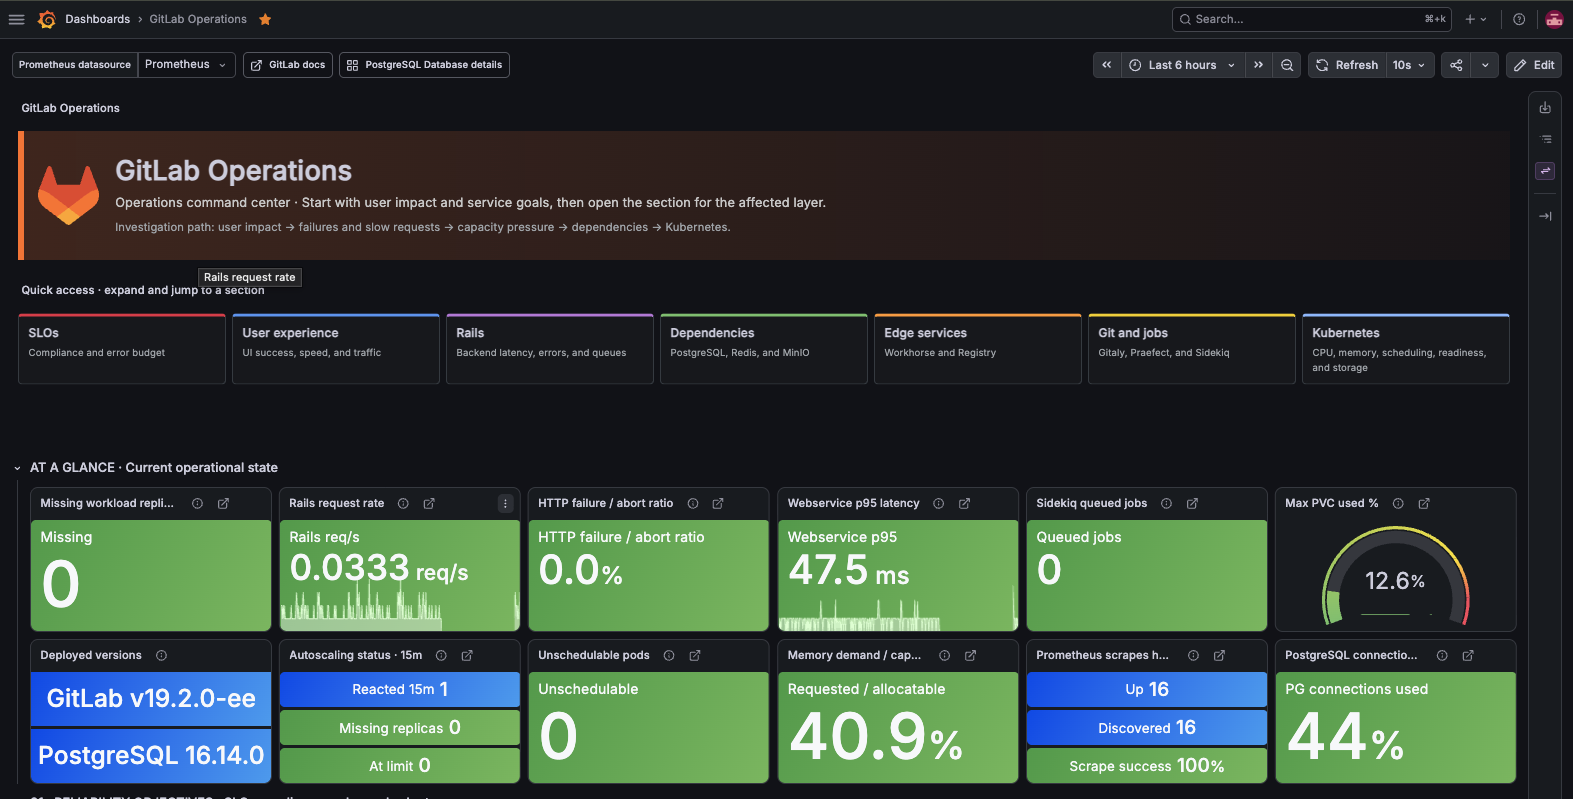
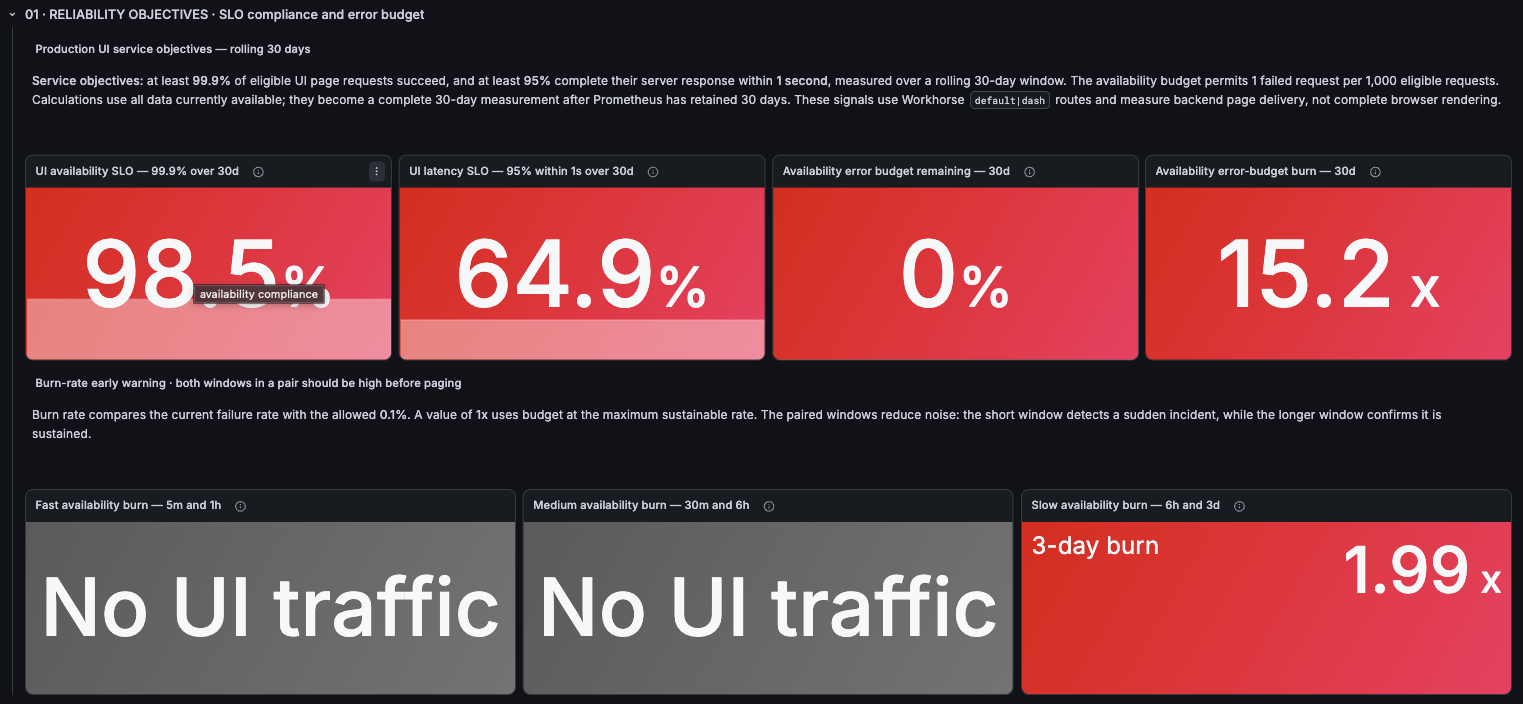
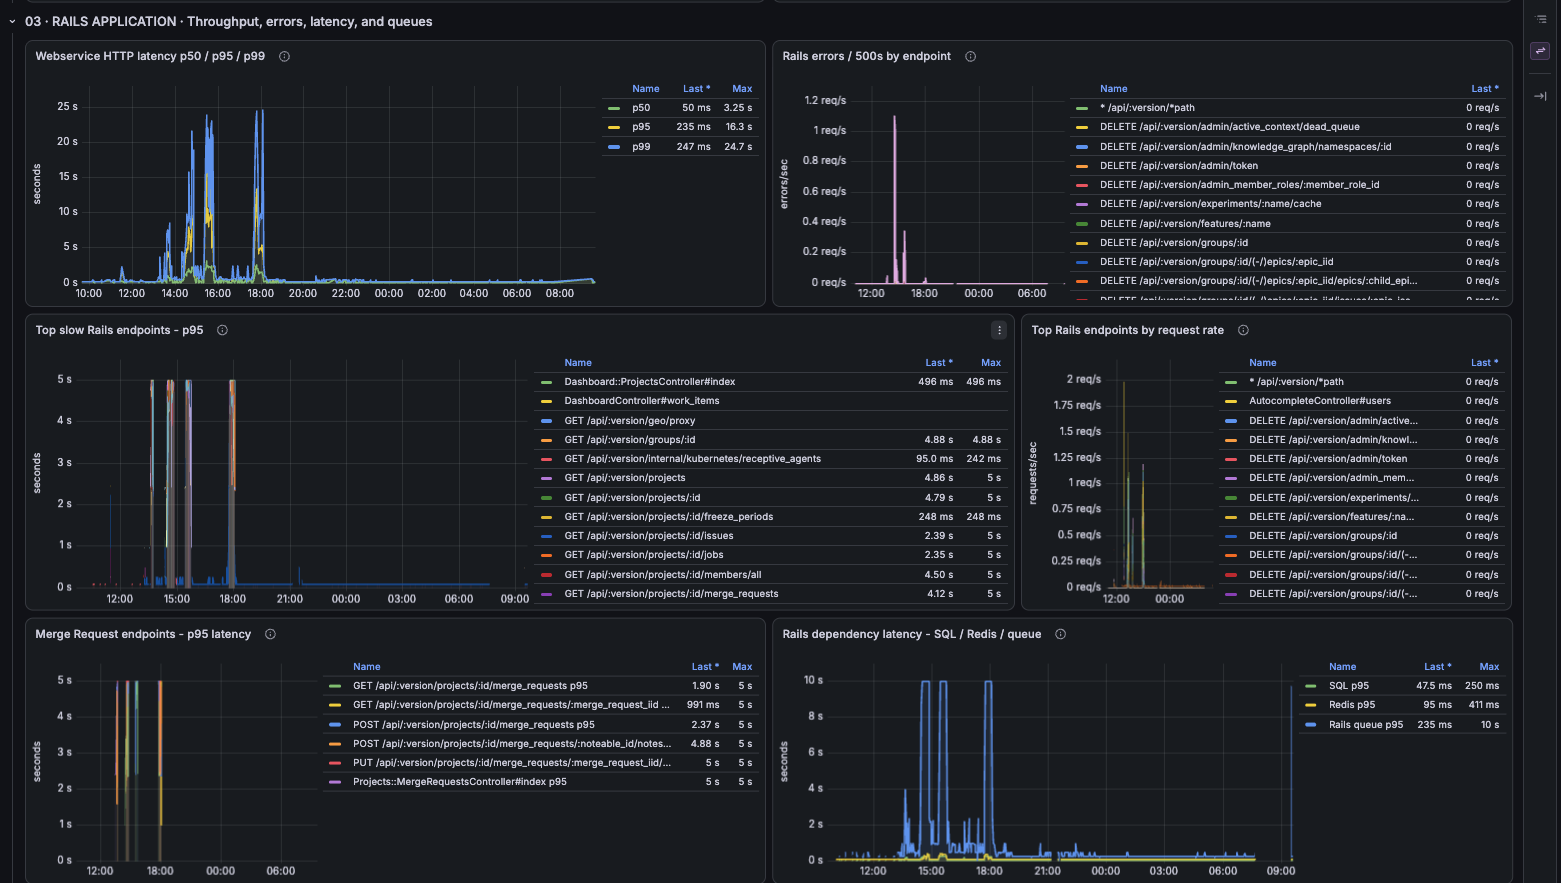
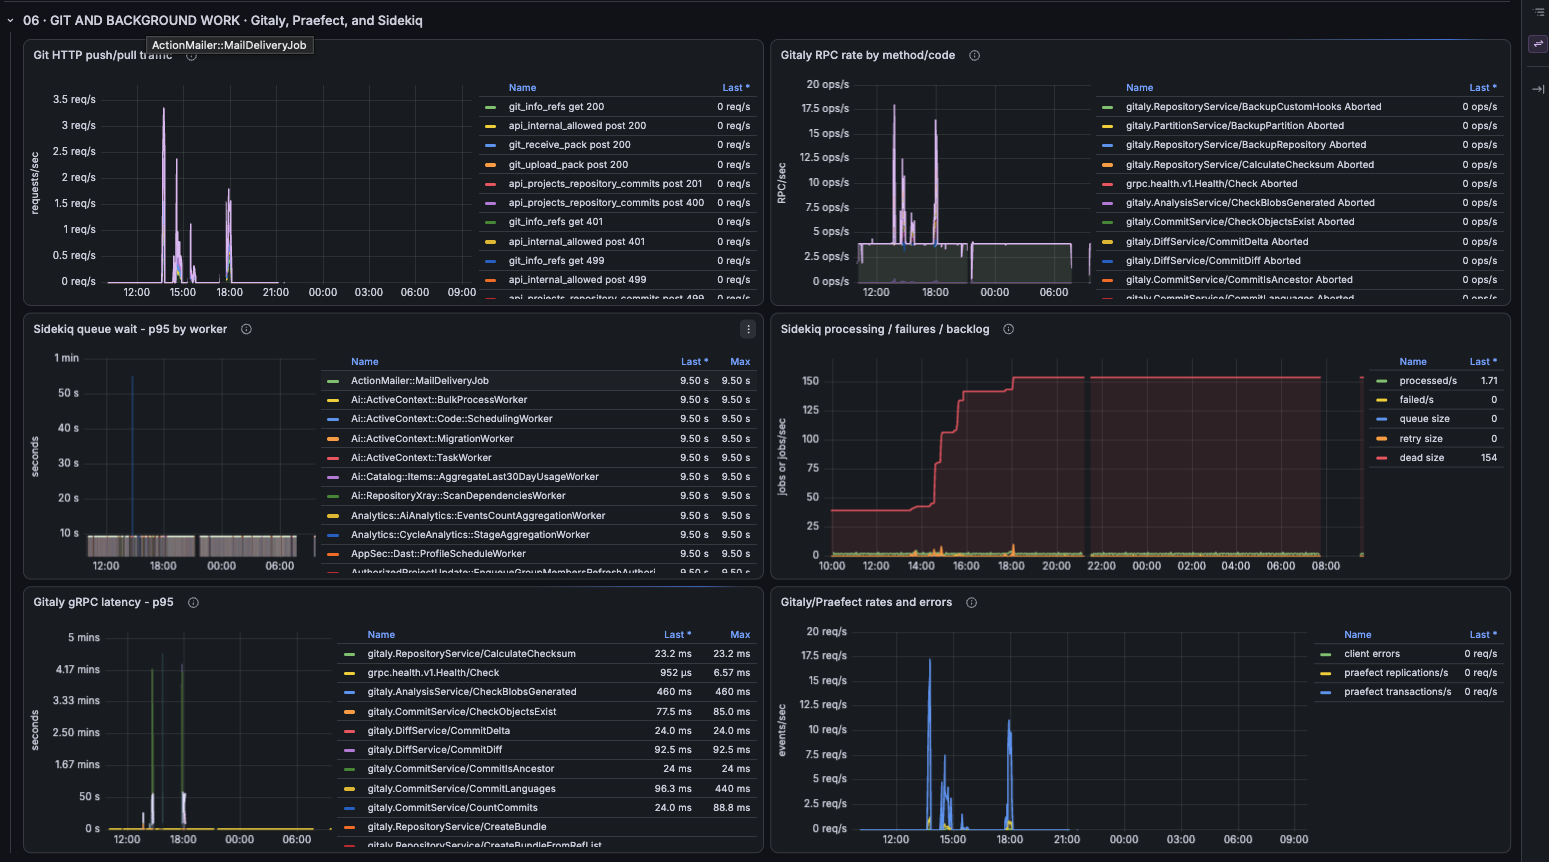
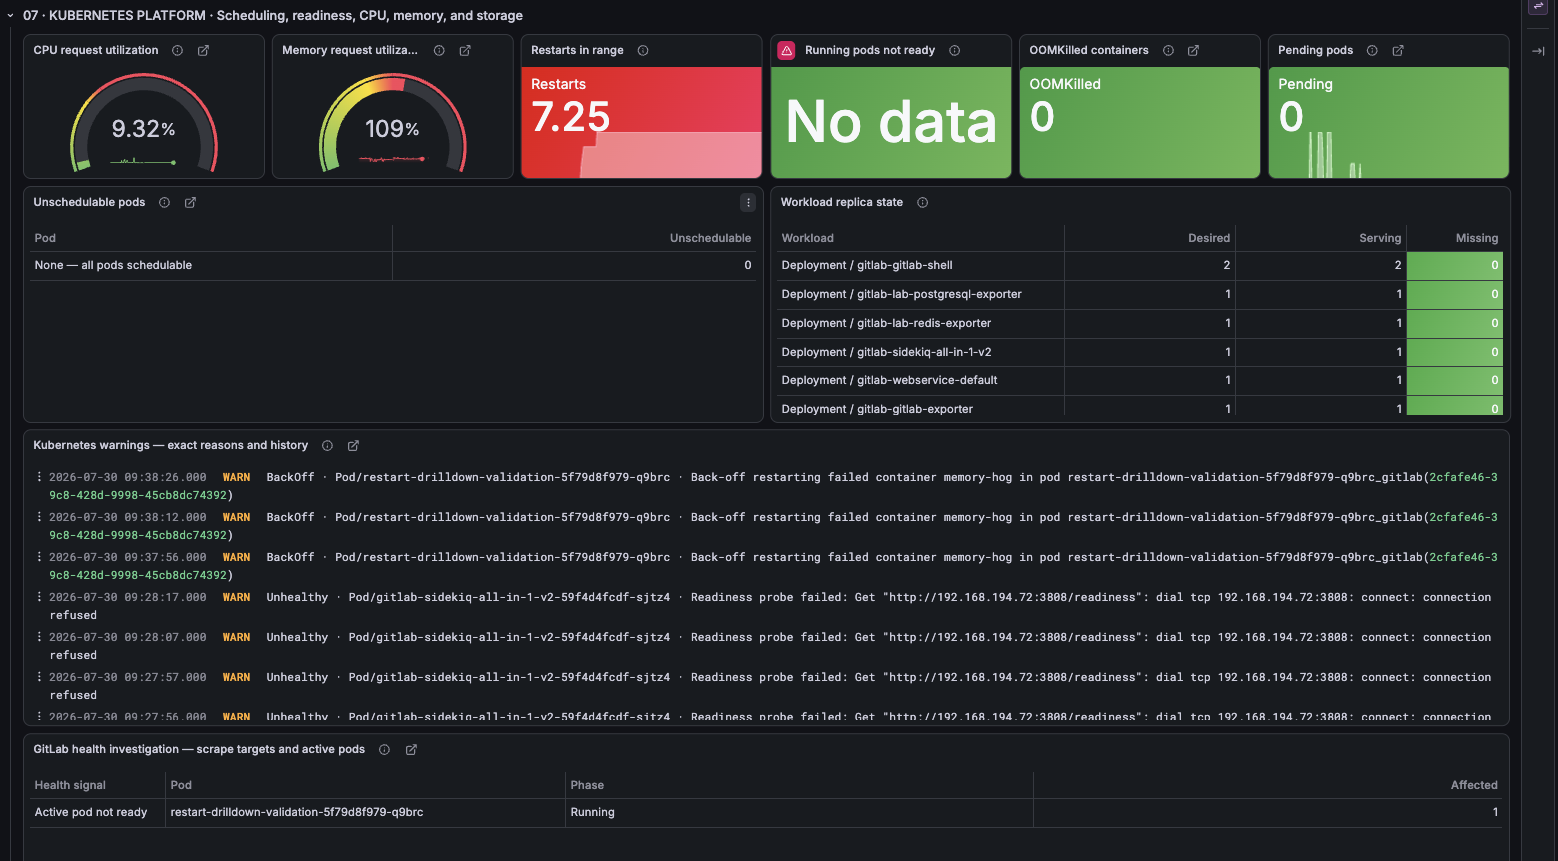
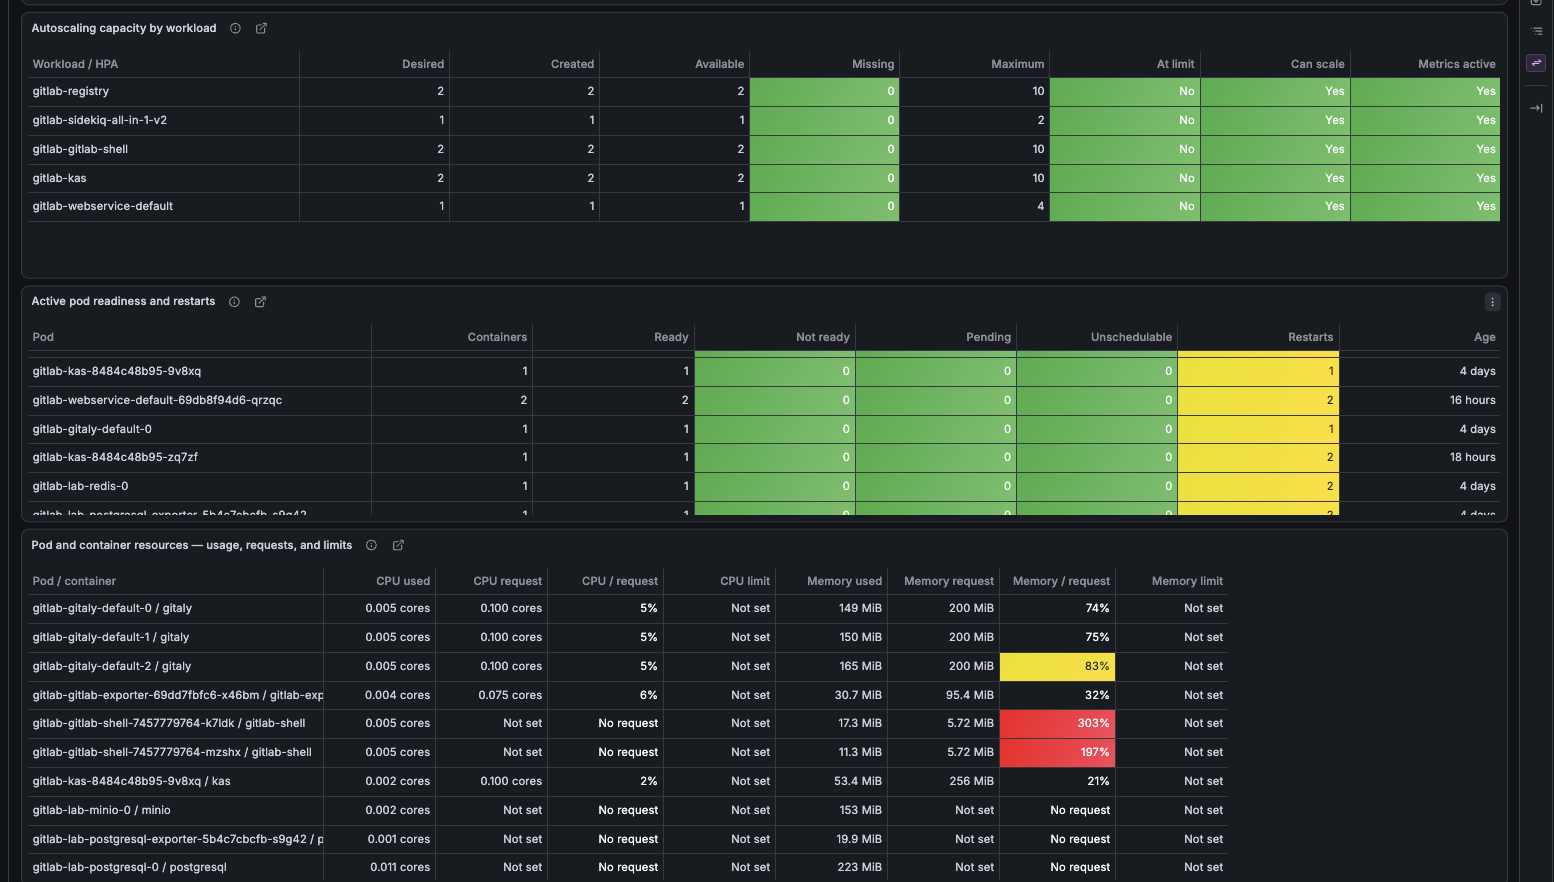
GitLab Operations Dashboard
The GitLab Operations dashboard provides a consolidated operational view of GitLab services running on Kubernetes.
It is designed to help platform engineers and operators:
- Assess the health and availability of GitLab components.
- Identify unavailable or degraded workloads.
- Review application traffic, latency, errors, and resource usage.
- Troubleshoot problems across GitLab, Kubernetes, PostgreSQL, Redis, object storage, and related services.
- Distinguish application problems from missing or incorrectly configured telemetry.
The dashboard includes an Operator setup banner that summarizes telemetry requirements, optional integrations, and expected behavior when data is unavailable. This banner provides guidance only and does not perform live prerequisite checks.
Dashboard Configuration
The dashboard uses variables to support different GitLab environments and monitoring conventions.
Common configuration values include:
| Variable | Purpose |
|---|---|
| Prometheus datasource | Datasource used for GitLab and Kubernetes metrics |
| Loki datasource | Optional datasource used for Kubernetes warning events |
| Namespace | Kubernetes namespace containing GitLab |
| Webservice job | Prometheus scrape job for GitLab Webservice and Workhorse |
| Registry job | Prometheus scrape job for the GitLab Container Registry |
| Gitaly job | Prometheus scrape job for Gitaly |
| PostgreSQL job | Prometheus scrape job for the PostgreSQL exporter |
| PostgreSQL databases | Regular expression matching GitLab-related databases |
| UI route filter | Workhorse route identifiers representing interactive UI traffic |
| Event job | Loki job label used for Kubernetes events |
| Container namespace label | Namespace label used on container-level metrics |
| Resource metrics path | Metrics path used for kubelet or cAdvisor resource metrics |
| PostgreSQL dashboard UID | Optional link to a detailed PostgreSQL dashboard |
Job names, labels, scrape paths, database names, and route identifiers vary between environments and should be reviewed during setup.
Telemetry Requirements
The dashboard does not install or configure monitoring components. Prometheus, exporters, collectors, and Kubernetes monitoring integrations must already be available.
Core requirements
The primary GitLab and Kubernetes sections require:
- A Grafana Prometheus datasource with access to GitLab and Kubernetes telemetry.
- Prometheus scrape targets for the GitLab components running in the environment.
- GitLab Webservice and Workhorse metrics.
- Sidekiq metrics.
- Gitaly metrics.
- GitLab Exporter metrics.
kube-state-metrics.- Kubelet or cAdvisor-compatible container metrics.
- Consistent labels for namespace, job, container, and metrics path.
Registry and Praefect panels require those components to be enabled and scraped.
Prometheus target discovery alone is not sufficient. The expected metric families and labels must also be present.
The Prometheus scrape-health panels indicate whether telemetry can be collected. They do not prove that GitLab is available, ready, or functioning correctly for users.
Optional Integrations
Some dashboard sections depend on optional services or exporters.
| Integration | Dashboard coverage | Behavior when unavailable |
|---|---|---|
| PostgreSQL exporter | Connections, transactions, cache activity, tuples, locks, and version information | PostgreSQL panels display no data |
| Redis exporter | Redis health, clients, memory, commands, and evictions | Redis panels display no data |
| MinIO metrics | MinIO capacity, nodes, drives, requests, and errors | MinIO panels display no data |
| Loki and Kubernetes Event collector | Kubernetes warning-event history | The warning-event panel is unavailable |
| GitLab Registry | Registry traffic, errors, and latency | Registry panels display no data |
| Praefect | Praefect traffic, latency, and availability | Praefect panels display no data |
A missing optional integration should affect only the panels that depend on it.
Missing core GitLab metrics, kube-state-metrics, or kubelet and cAdvisor metrics will remove broad portions of the dashboard and should be treated as incomplete monitoring coverage.
Object Storage
The object-storage section monitors MinIO when MinIO metrics are available.
Empty MinIO panels are expected when GitLab uses another object-storage provider, such as:
- Amazon S3
- Google Cloud Storage
- Azure Blob Storage
- Another S3-compatible service
Empty MinIO panels do not indicate that GitLab object storage has failed.
Cloud-provider bucket health, capacity, throttling, availability, and request metrics must be monitored using the provider's native monitoring services or a compatible exporter.
Kubernetes Warning Events
The Kubernetes warning-history panel requires Kubernetes Event records to be collected in Loki.
Event records should include fields representing:
- Event type
- Reason
- Resource kind
- Resource name
- Event message
Without a compatible event collector and field structure, the warning-event panel will not return usable results.
Understanding No data
No data should not automatically be interpreted as healthy.
When a panel displays no data, verify:
- The related component, exporter, or integration is installed and enabled.
- Prometheus has discovered the target and reports it as reachable.
- The expected metric exists for the installed component or exporter version.
- The selected datasource, namespace, job, labels, and metrics path match the environment.
- The selected time range contains relevant activity.
- The operation represented by the metric has occurred.
Some metrics are created only after a specific type of request or operation takes place.
Operational Definitions
Desired
The number of replicas requested by a Kubernetes controller.
Created
The number of replicas created by the controller. This may include Pending, starting, or unready replicas.
Serving
The number of replicas currently capable of serving traffic:
- Available replicas for Deployments
- Ready replicas for StatefulSets
Missing
The number of desired replicas that are not currently serving:
max(Desired - Serving, 0)
Resource Utilization
CPU-to-request and memory-to-request panels compare actual resource usage with Kubernetes scheduler requests.
Values above 100% mean that usage has exceeded the configured request.
This does not automatically indicate an outage. It may indicate that:
- Resource requests are set too low.
- The workload is experiencing increased demand.
- The workload is using available node capacity beyond its reservation.
- Resource configuration should be reviewed.
Resource limits, throttling, memory pressure, pod health, latency, and errors should be evaluated alongside these values.
Availability and Latency Objectives
The dashboard may include calculated availability and latency indicators for interactive GitLab UI traffic.
Any included targets should be treated as starting points rather than automatically accepted organizational SLOs.
Before adopting them, review:
- User expectations
- Historical performance
- Business impact
- Current platform capabilities
- Maintenance and release patterns
- The GitLab operations represented by the metrics
A dashboard target does not become an SLO until it has been reviewed, approved, documented, and supported by an operational response process.
Dashboard Scope
The dashboard provides:
- Raw operational metrics
- Kubernetes workload health
- Application traffic and latency signals
- Resource utilization
- Database and cache signals
- Storage signals
- Calculated service-level indicators
The dashboard does not:
- Install monitoring integrations
- Validate all prerequisites automatically
- Create alert rules
- Enforce SLOs
- Manage error budgets
- Replace detailed component-specific dashboards
- Prove end-to-end user availability based solely on scrape health
Dashboard data should be used alongside alerts, logs, traces, runbooks, and component-specific troubleshooting views.
Data source config
Collector config:
Upload an updated version of an exported dashboard.json file from Grafana
| Revision | Description | Created | |
|---|---|---|---|
| Download |

GitLab

Monitor GitLab with Grafana. Easily monitor your GitLab Enterprise Edition with Grafana Cloud's out-of-the-box monitoring solution.
Learn more