
Seagate Exos Storage · NOC
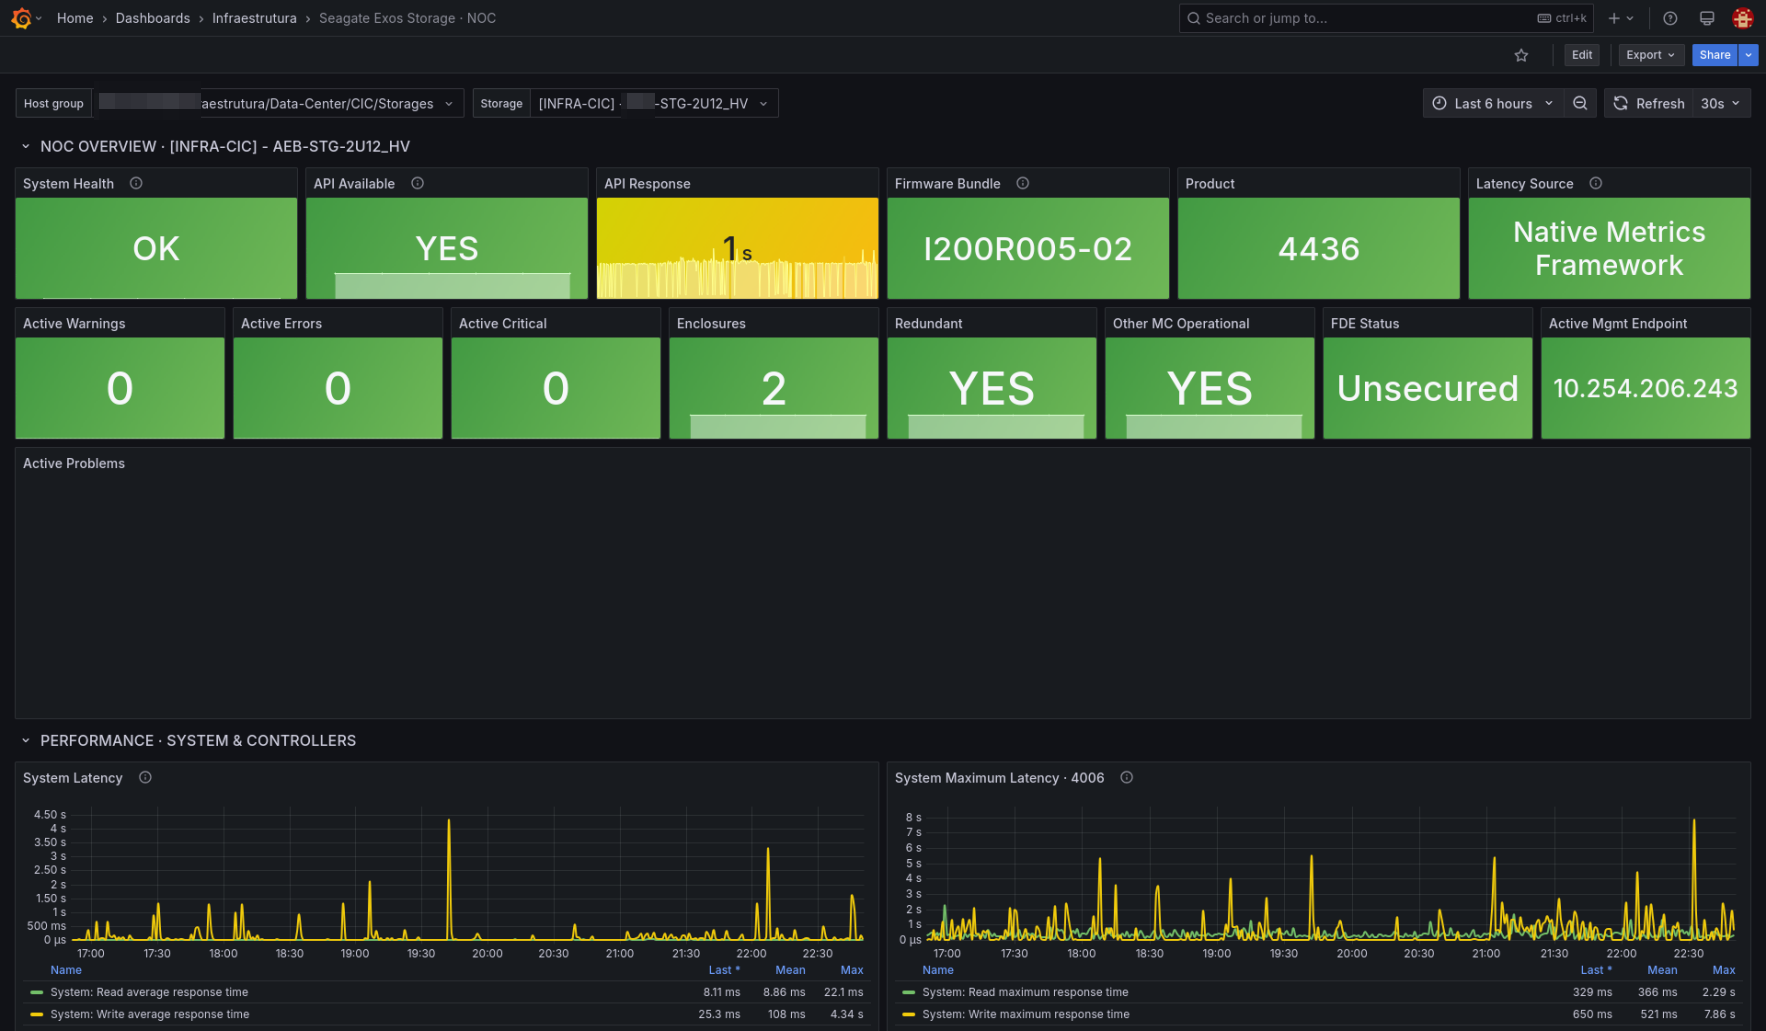
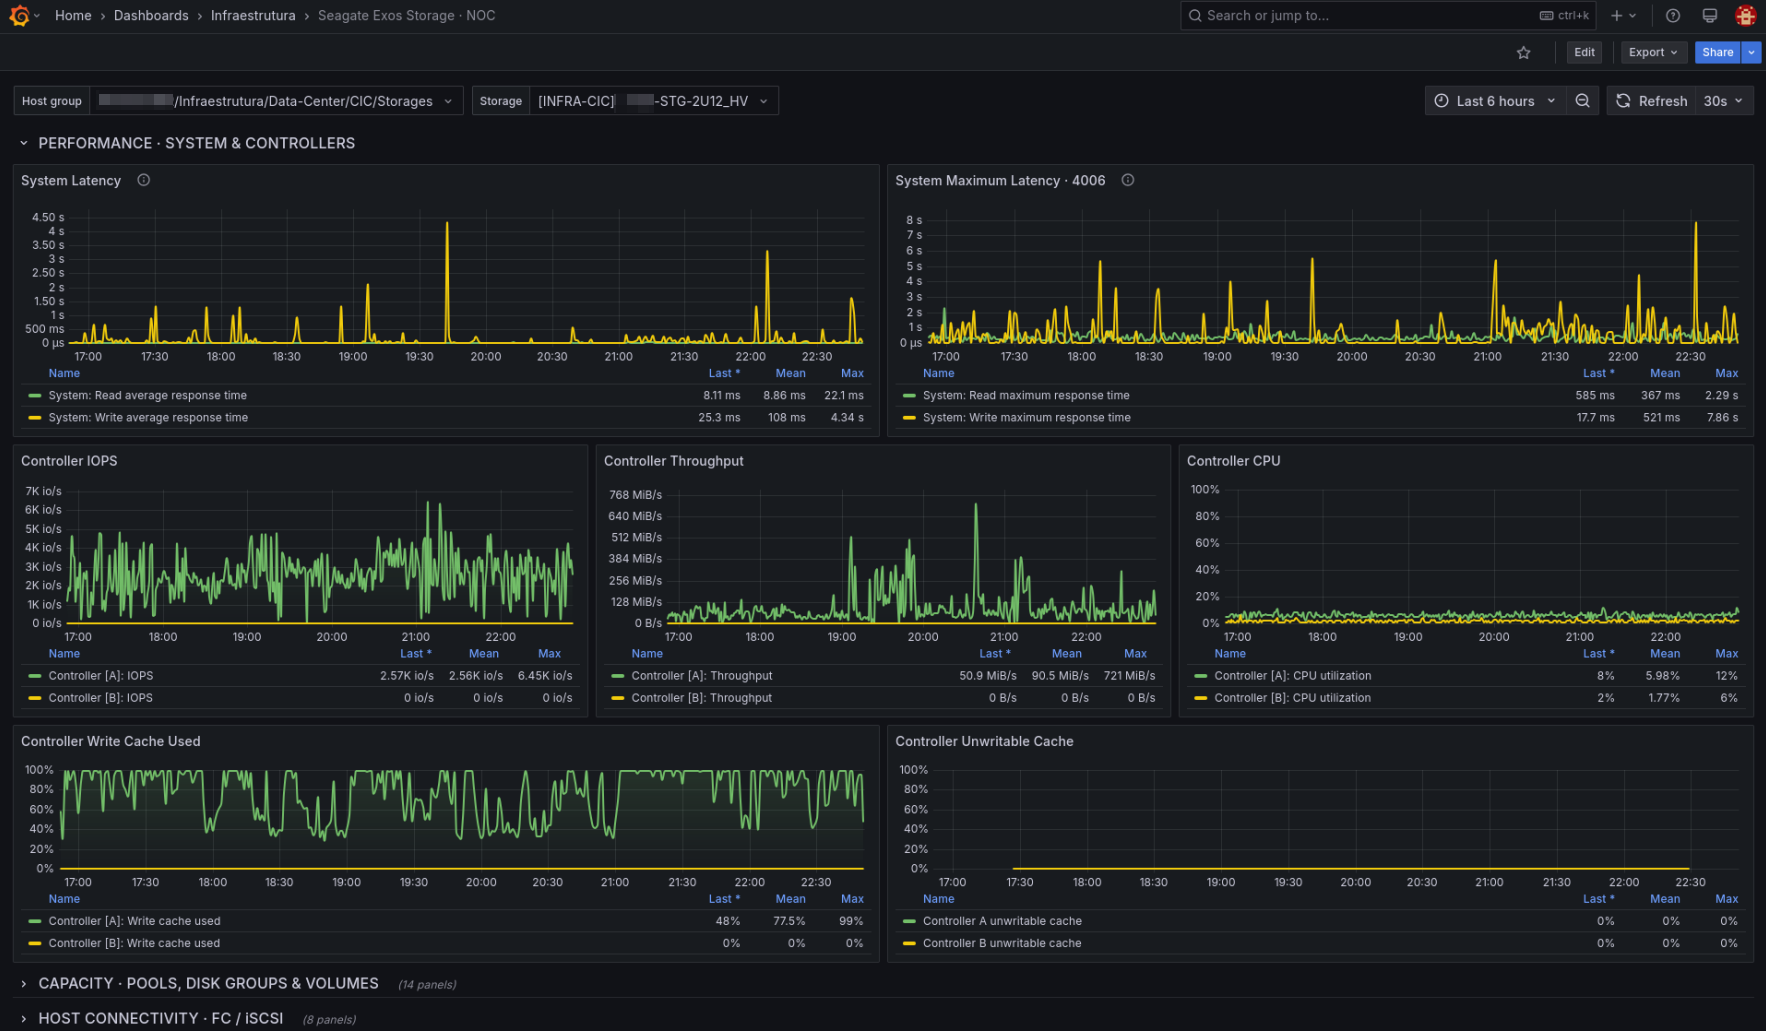
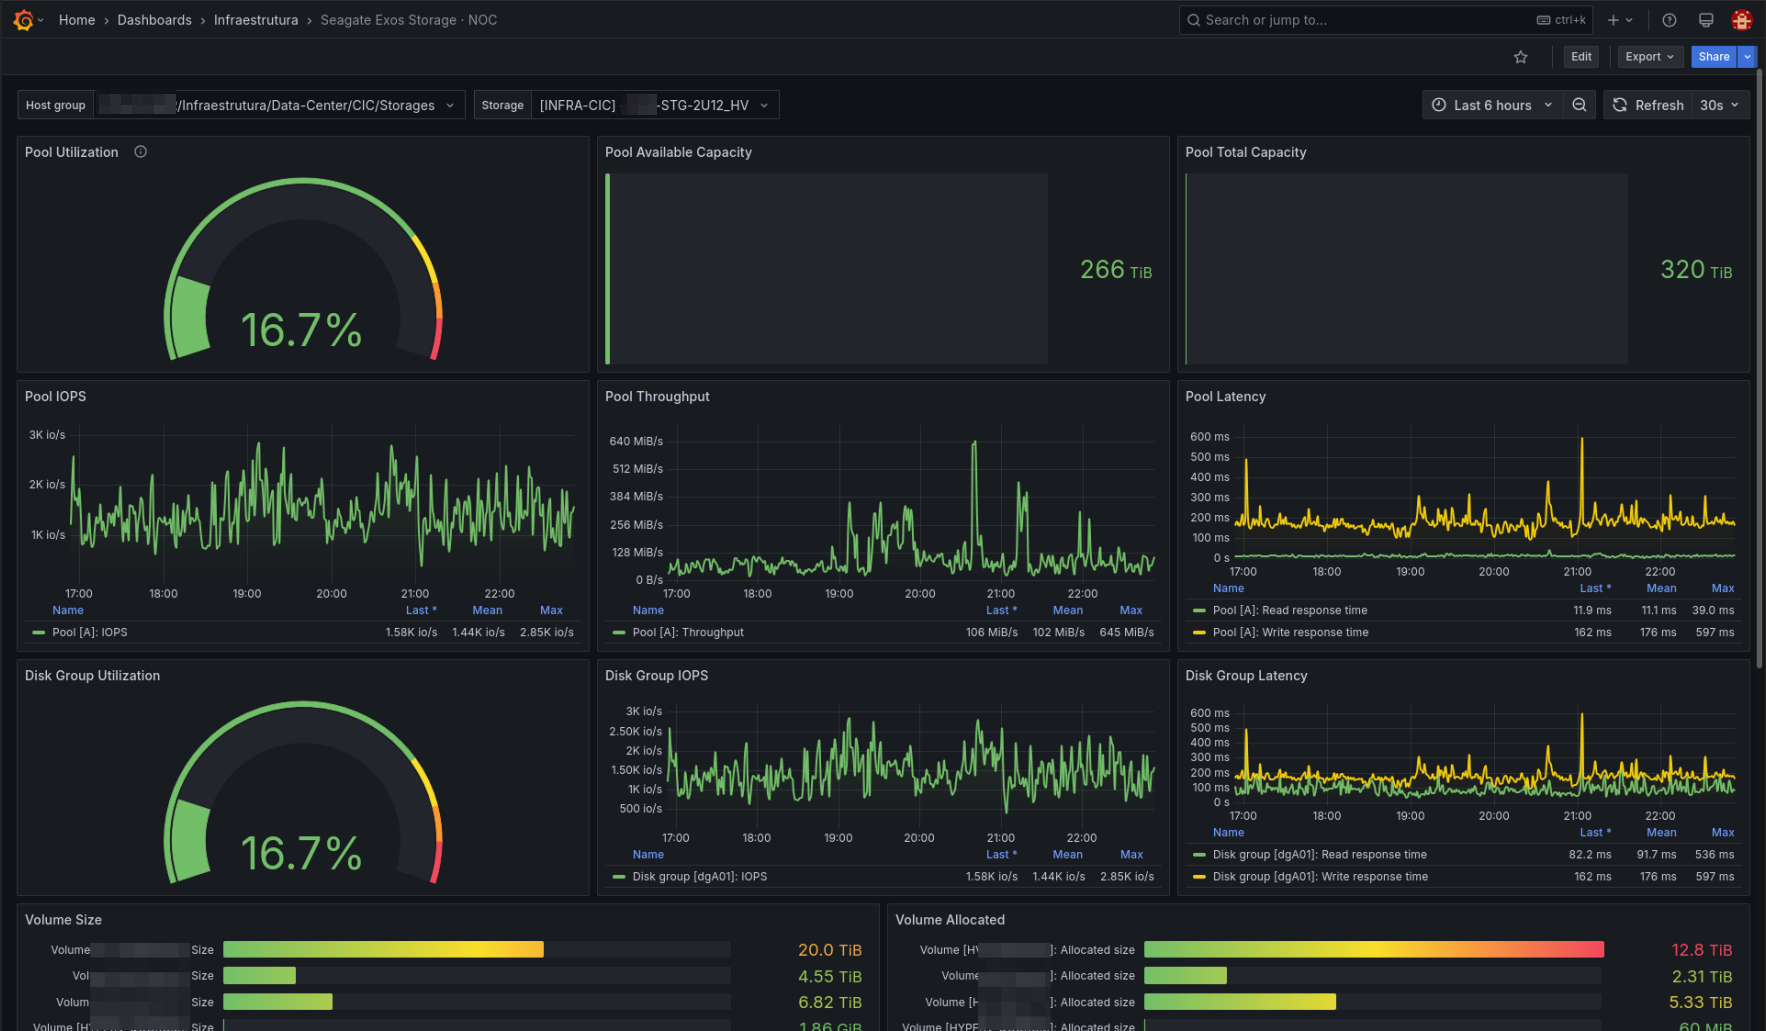
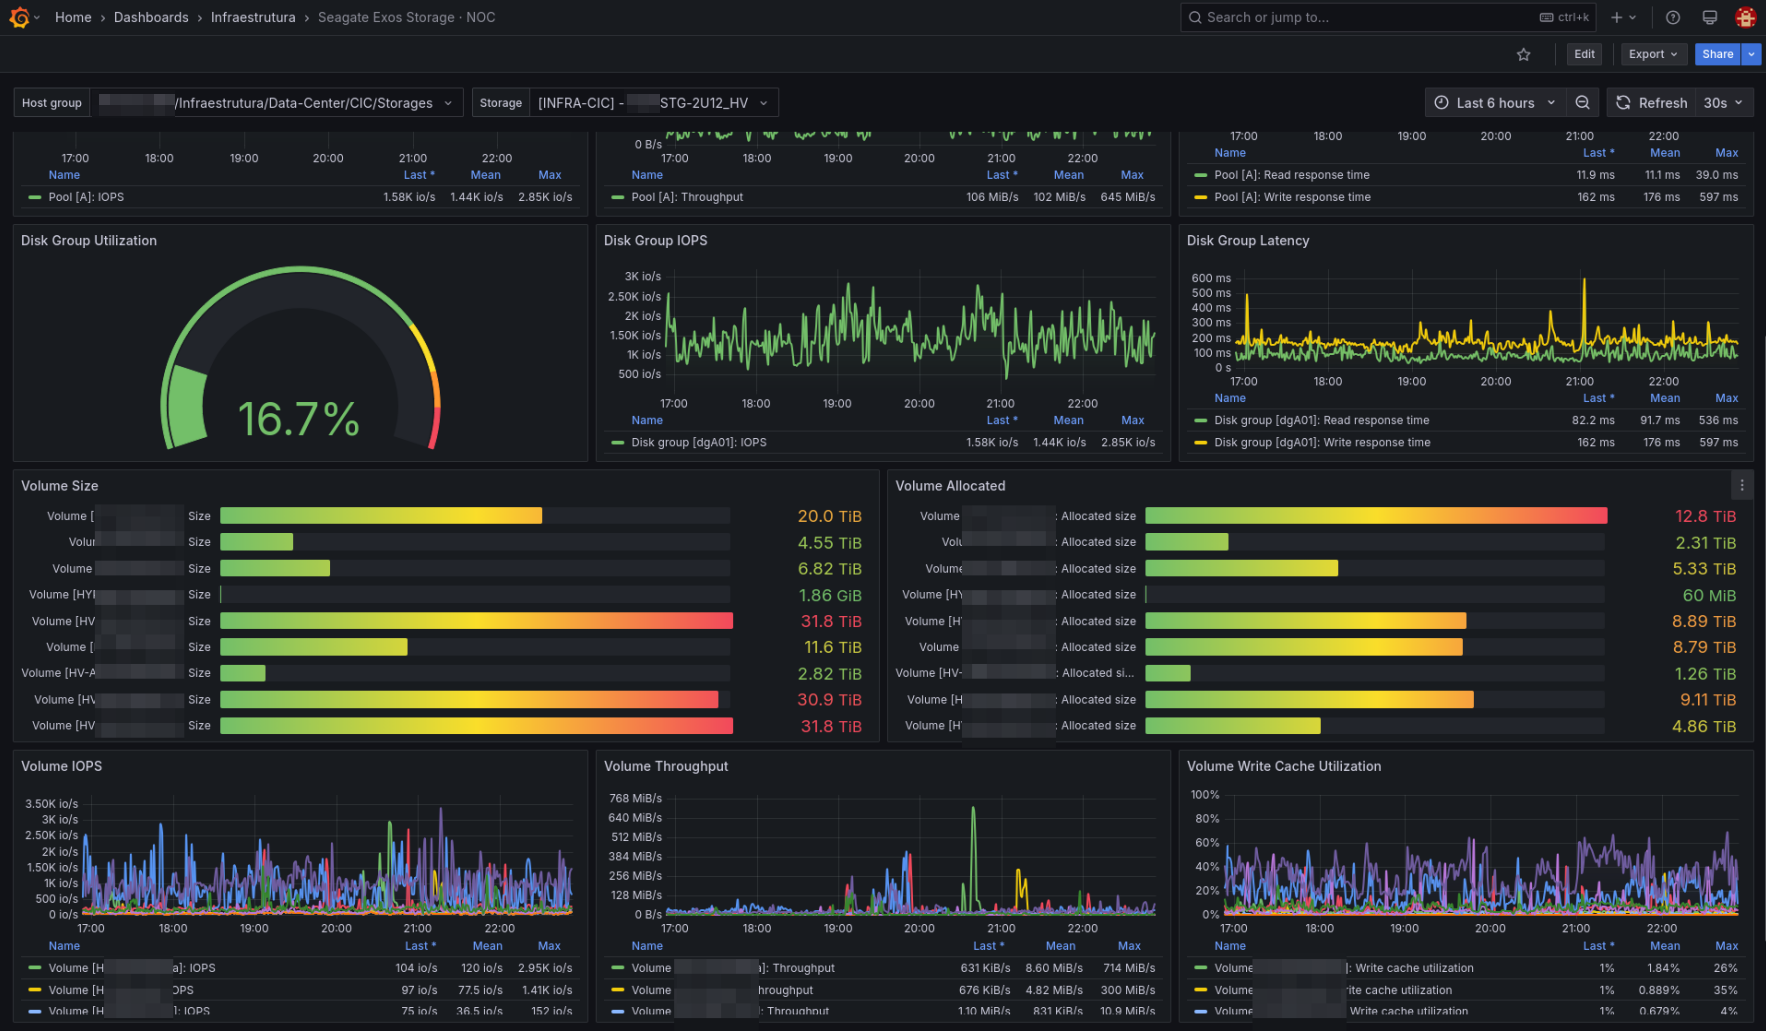
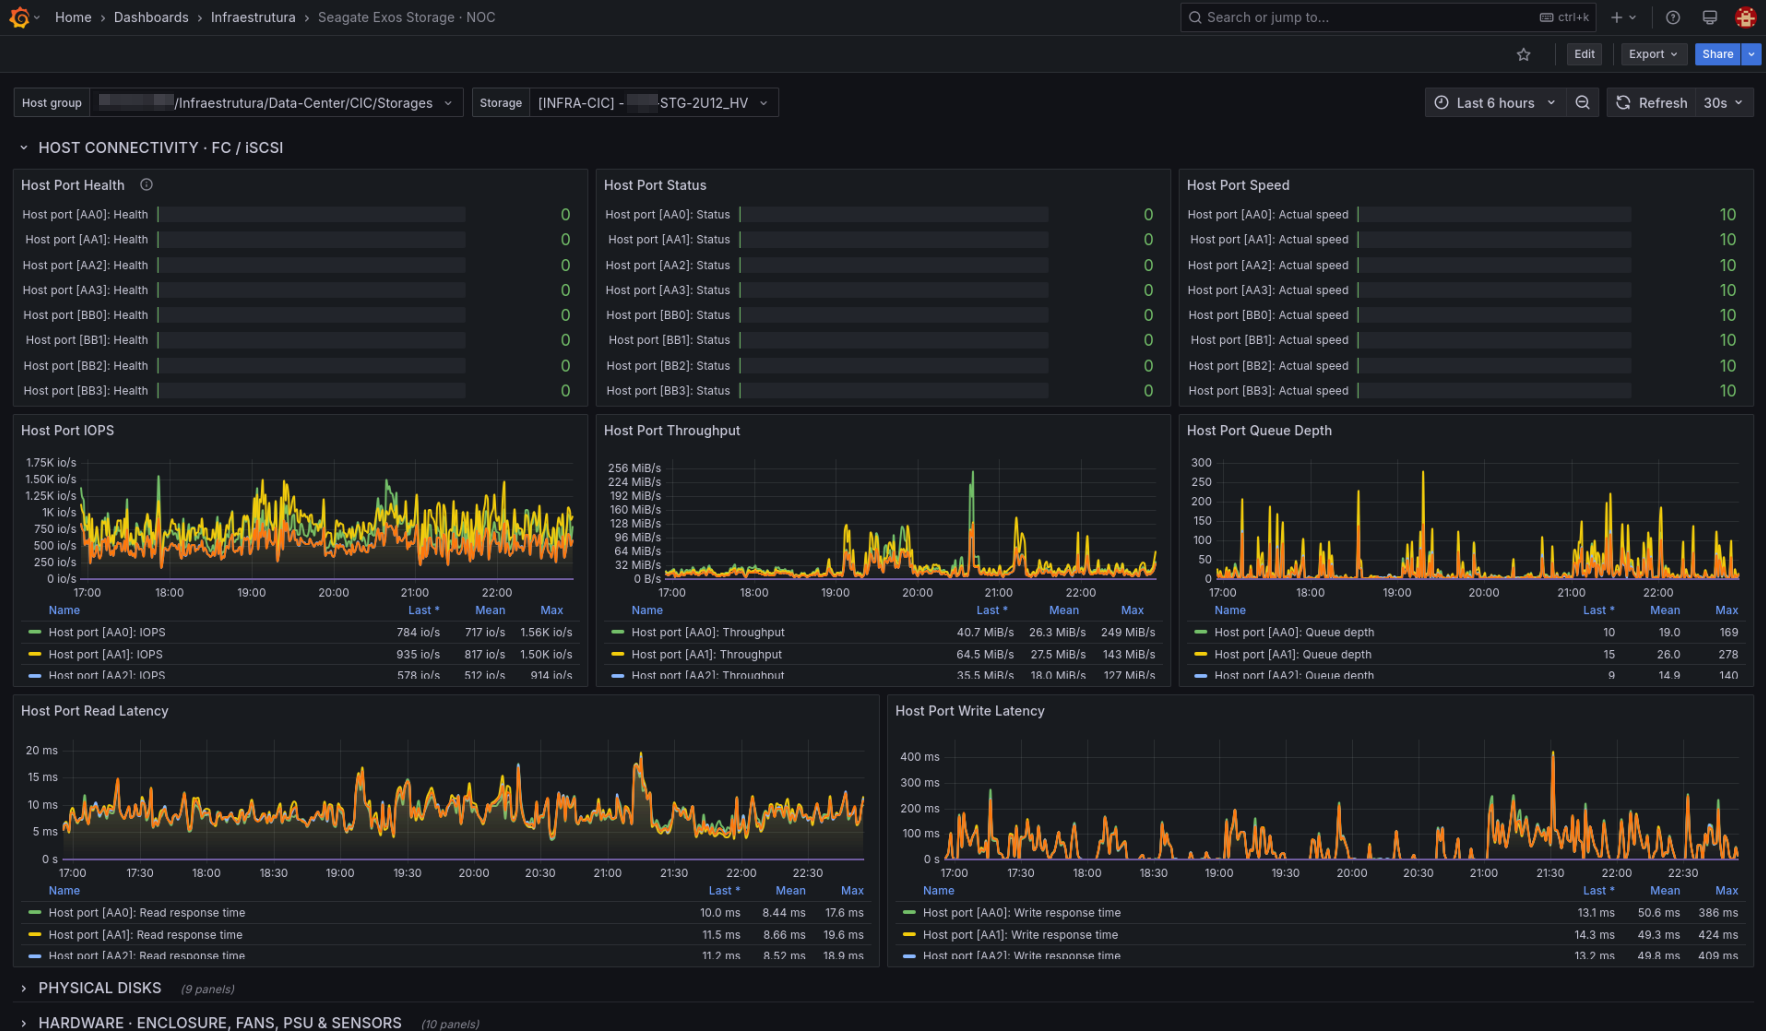
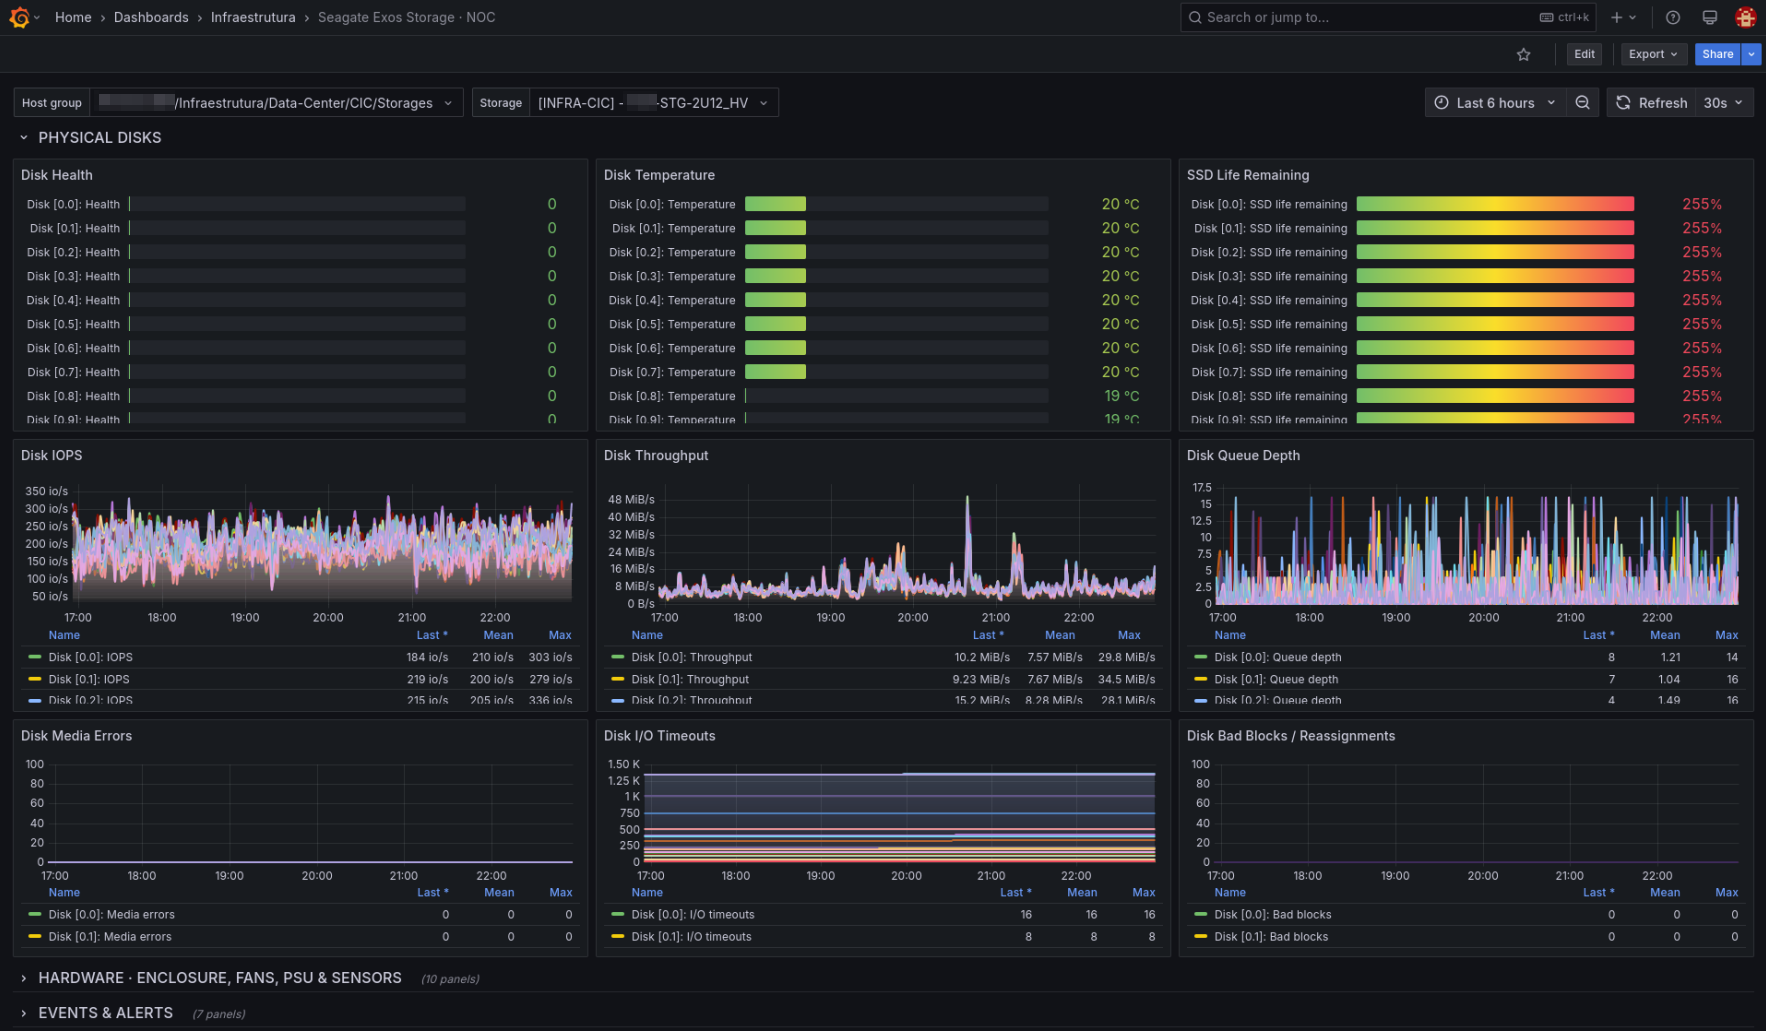
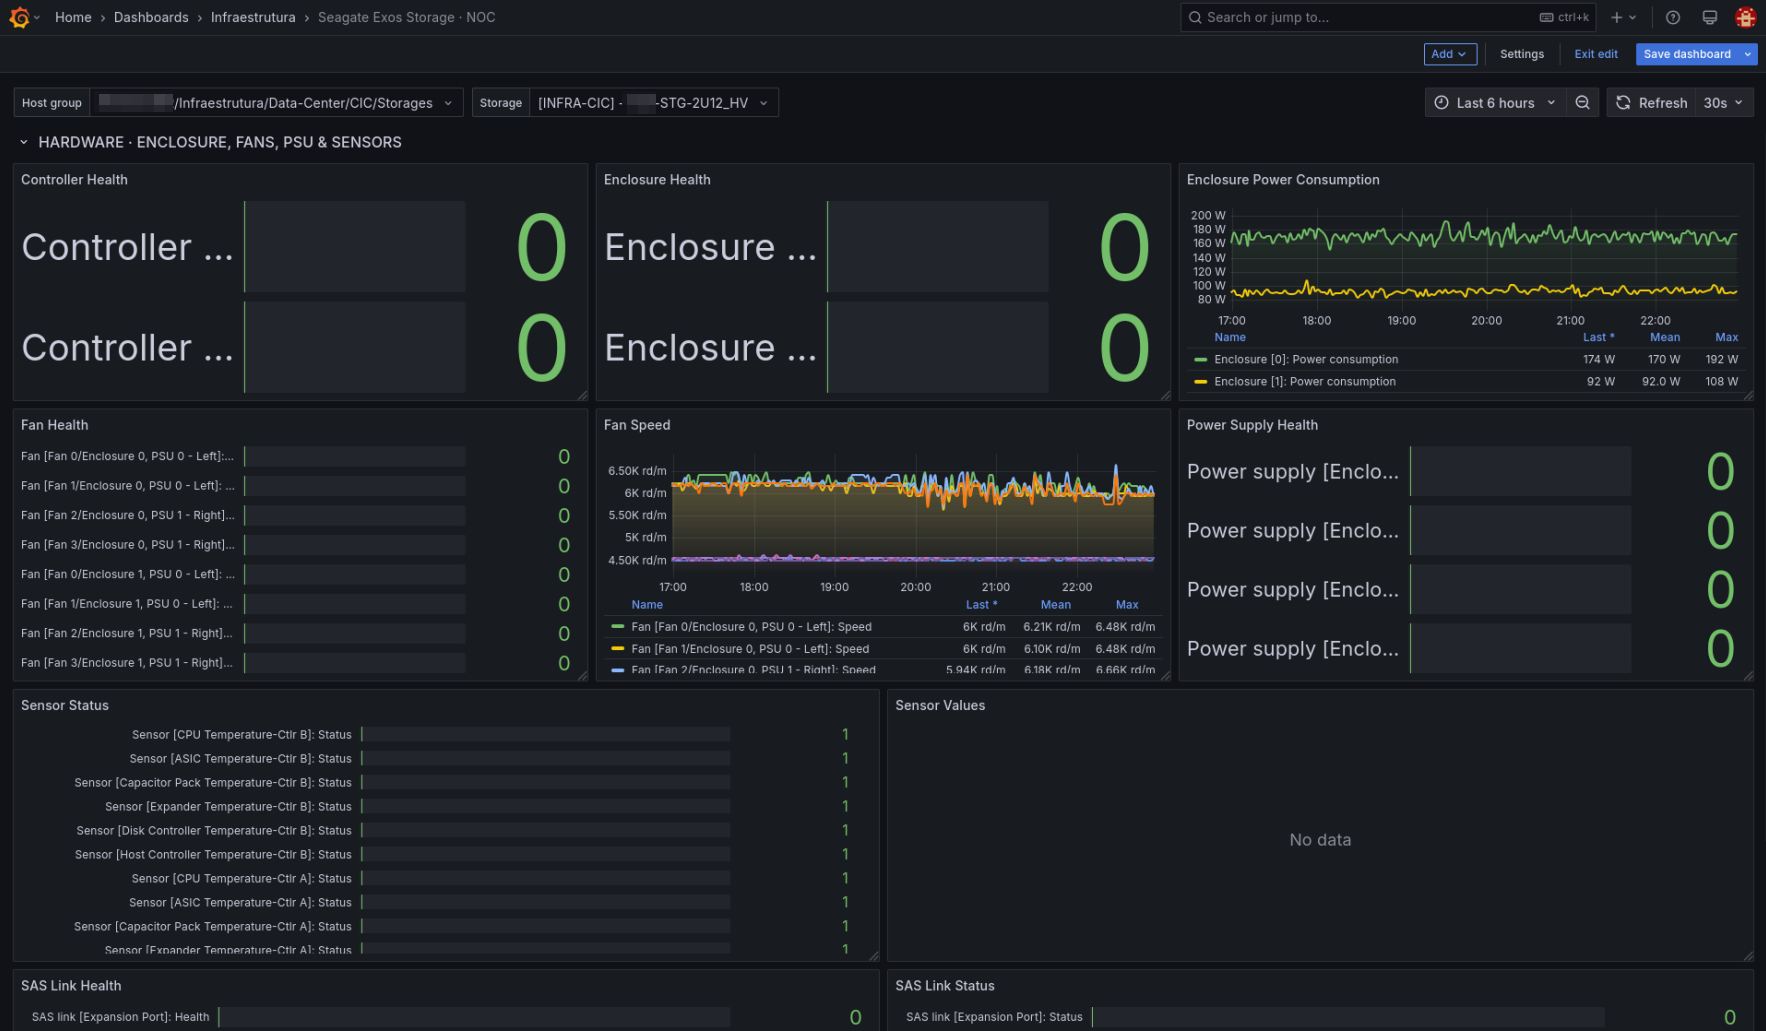
Seagate Exos Storage · NOC Dashboard
A NOC-focused Grafana dashboard for monitoring Seagate Exos X storage systems through Zabbix.
Designed for operational monitoring and troubleshooting, the dashboard provides a centralized view of storage health, performance, capacity, host connectivity, physical disks, controllers, enclosures, fans, power supplies, sensors, SAS links, events, alerts, and active Zabbix problems.
Data Collection
This dashboard does not communicate directly with the storage system.
Metrics are collected by Zabbix using the Seagate Exos Storage by HTTP template, which communicates with the native Seagate Exos JSON management API over HTTP/HTTPS.
Monitoring architecture:
Seagate Exos Storage → HTTPS/JSON API → Zabbix Server/Proxy → Grafana Zabbix Data Source → Dashboard
No Zabbix Agent, SNMP polling, or external scripts are required on the storage system.
Required Zabbix Template
Download and configure the Zabbix template before using this dashboard:
Seagate Exos Storage by HTTP
https://github.com/guicampos21/zabbix-templates/tree/main/templates/storage/seagate-exos-x-4005-4006
The template supports Zabbix 7.0+ and dynamically discovers storage components using Zabbix Low-Level Discovery.
Supported Systems
Designed and tested with:
- Seagate Exos X 4005 family
- Seagate 4865
- Seagate Exos X 4006
- Gallium and Indium controller platforms
- 2U12, 2U24, and 5U84 enclosure formats
Support may vary depending on firmware version and installed hardware.
Dashboard Overview
NOC Overview
Provides immediate operational status including:
- System health
- API availability and response time
- Firmware version
- Product identification
- Controller redundancy
- Management controller status
- Full Disk Encryption status
- Active management endpoint
- Warning, Error, and Critical alert counters
- Active Zabbix problems
Performance
Includes:
- System read/write latency
- Maximum read/write latency on supported 4006 systems
- Controller IOPS
- Controller throughput
- Controller CPU utilization
- Cache utilization
- Host-port IOPS, throughput, queue depth, and latency
Capacity
Provides visibility into:
- Pool total, available, and used capacity
- Pool utilization
- Disk group capacity
- Volume allocation
- Pool, disk group, and volume performance
Multiple pools and volumes are discovered automatically.
Physical Disks
Includes per-drive monitoring for:
- Health
- Temperature
- IOPS
- Throughput
- Queue depth
- Media errors
- I/O timeouts
- Bad blocks
- Block reassignments
- SSD remaining life where available
Hardware
Monitors dynamically discovered:
- Controllers
- Enclosures
- Fans and fan speed
- Power supplies
- Hardware sensors
- FRUs
- SAS links
- Expansion connectivity
Events and Alerts
Displays:
- Latest Warning events
- Latest Error events
- Latest Critical events
- Active alert counters
- Active Zabbix problems
Structured alerts are used when supported by the storage generation.
System Latency
The dashboard provides a unified host-facing System Latency view across supported storage generations.
Exos X 4006
Uses native Seagate Metrics Framework values:
system.read-avg-response-timesystem.write-avg-response-timesystem.read-max-response-timesystem.write-max-response-time
Exos 4005 / 4865
These systems do not expose the same native Metrics Framework.
The Zabbix template therefore calculates host-facing system latency using an I/O-weighted aggregation of the discovered host ports.
The dashboard automatically displays the appropriate latency source for the selected storage system.
Pool latency is displayed separately because it represents a different layer of the storage I/O path and can be useful when troubleshooting backend performance.
Dashboard Variables
The dashboard uses two selectors:
- Host Group
- Storage
Select a Zabbix host group and then the desired Seagate Exos storage host.
All dashboard panels automatically update for the selected array, allowing a single dashboard to be reused across multiple storage systems.
Requirements
- Grafana
- Grafana Zabbix plugin (
alexanderzobnin-zabbix-datasource) - Zabbix 7.0 or newer
- Seagate Exos Storage by HTTP Zabbix template
- Network connectivity from the Zabbix Server or Proxy to the storage management API
- A dedicated Seagate Exos Monitor/read-only API account
Recommended Settings
- Dashboard refresh: 30 seconds
- Default time range: Last 6 hours
- Dedicated read-only monitoring account on the storage system
Credentials are stored only in Zabbix and are not exposed to Grafana.
Zabbix Template and Documentation
Full installation instructions, supported objects, macros, compatibility information, monitoring architecture, and troubleshooting documentation are available at:
https://github.com/guicampos21/zabbix-templates/tree/main/templates/storage/seagate-exos-x-4005-4006
Data source config
Collector config:
Upload an updated version of an exported dashboard.json file from Grafana
| Revision | Description | Created | |
|---|---|---|---|
| Download |