
Multi Clusters Health-Prometheus
This dashboard aggregates multi-cluster metrics into a single unified table, displaying immediate cluster reachability (`UP` / `DOWN` status) alongside historical availability SLAs expressed as percentage uptime.
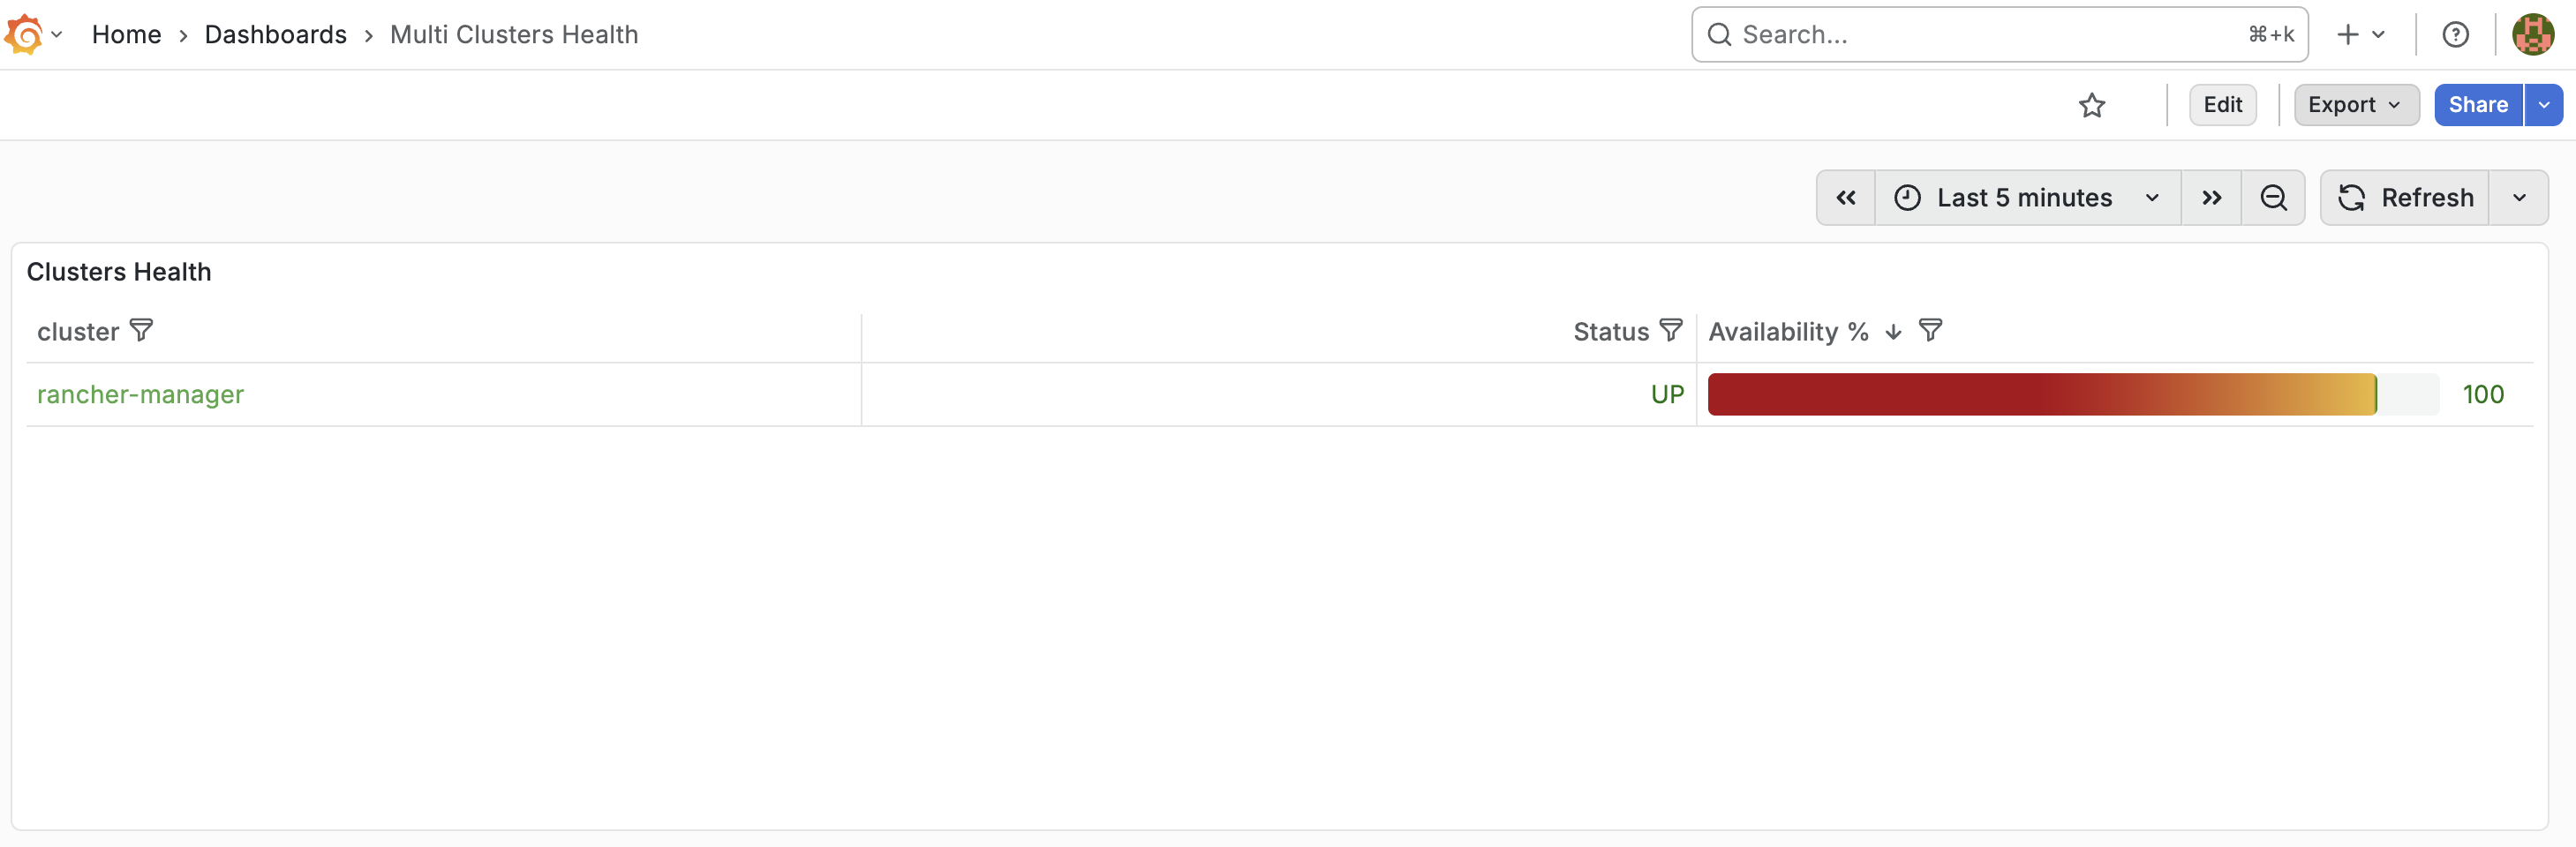
This dashboard aggregates multi-cluster metrics into a single unified table, displaying immediate cluster reachability (UP / DOWN status) alongside historical availability SLAs expressed as percentage uptime.
Data source config
Collector type:
Collector plugins:
Collector config:
Revisions
Upload an updated version of an exported dashboard.json file from Grafana
| Revision | Description | Created | |
|---|---|---|---|
| Download |

Metrics Endpoint (Prometheus)

Easily monitor any Prometheus-compatible and publicly accessible metrics URL with Grafana Cloud's out-of-the-box monitoring solution.
Learn more