
Selectel baremetal IPMI
Monitoring baremetal servers within Selectel.
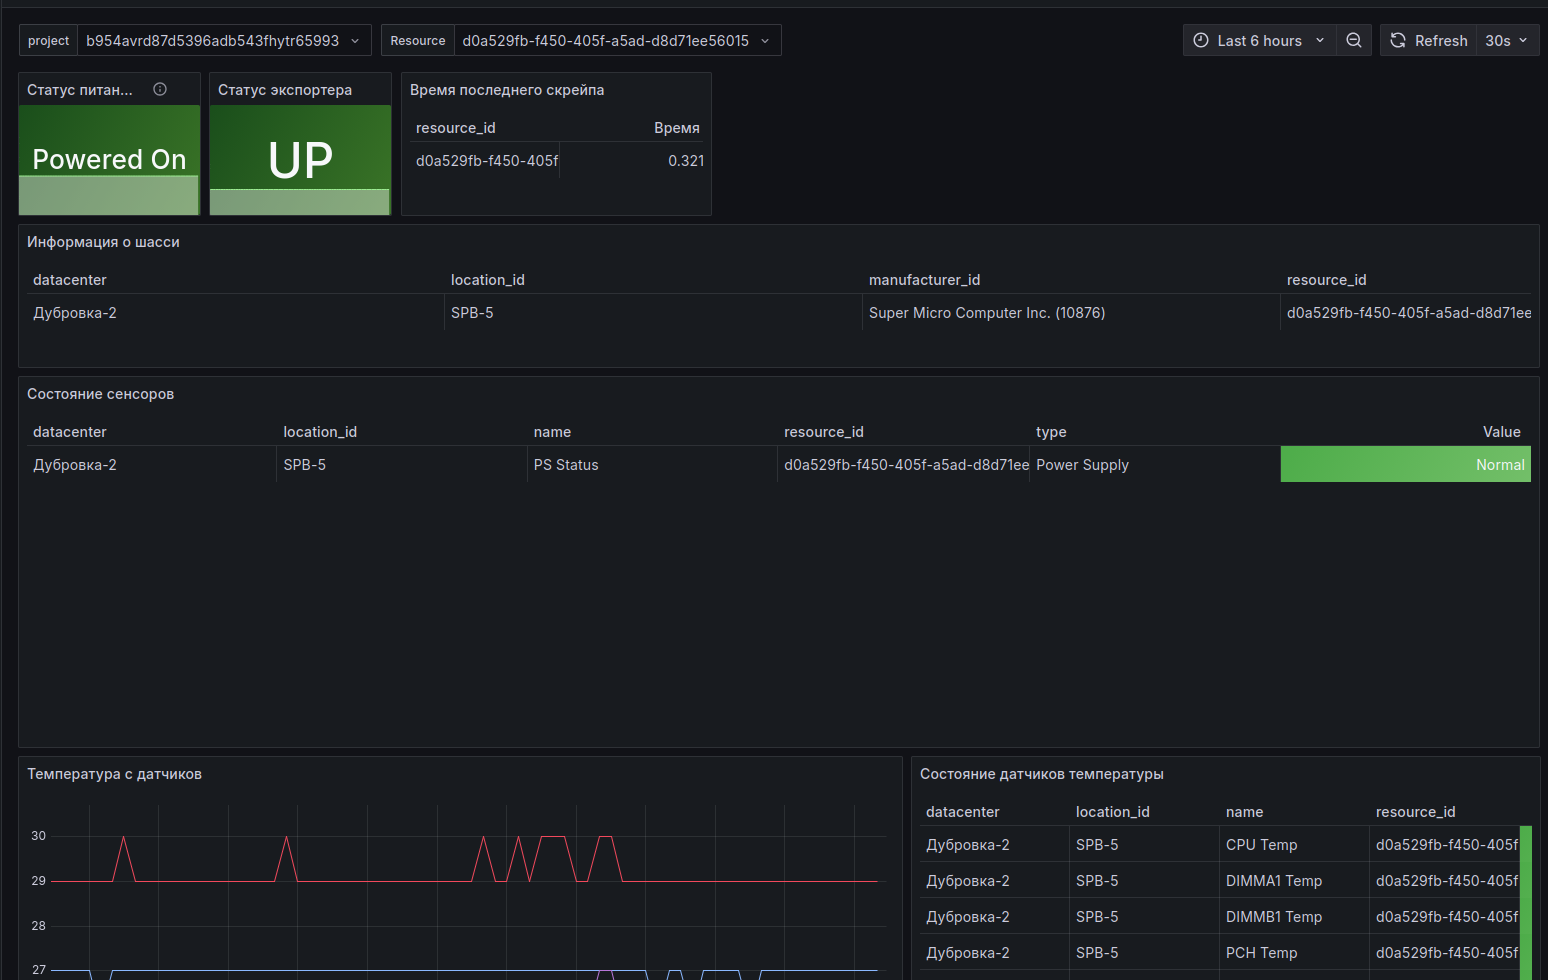
Selectel Bare Metal IPMI Dashboard
Overview
This dashboard is designed for monitoring Selectel Bare Metal servers.
It visualizes hardware health and sensor metrics collected from the server's Baseboard Management Controller (BMC), which is integrated into the server's motherboard. The dashboard uses IPMI metrics exposed by the BMC.
Installation
Import the dashboard into your Grafana instance.
Configure the data source:
- It is recommended to name the data source after the UUID of the project whose metrics you are connecting.
- Set Interval behaviour → Scrape interval to 5m.
- For the remaining configuration, follow the Selectel Knowledge Base guide: https://docs.selectel.ru/metrics/tools/grafana/#configure-data-source
Open the dashboard and select:
- the configured data source for the Project variable;
- the resource UUID (server UUID) for the Resource variable.
Data source config
Collector type:
Collector plugins:
Collector config:
Revisions
Upload an updated version of an exported dashboard.json file from Grafana
| Revision | Description | Created | |
|---|---|---|---|
| Download |