
Advance Remnawave Panel
Complete Remnawave VPN panel monitoring: users, node status & traffic, per-tag inbound/outbound, node resources, and backend Node.js processes.
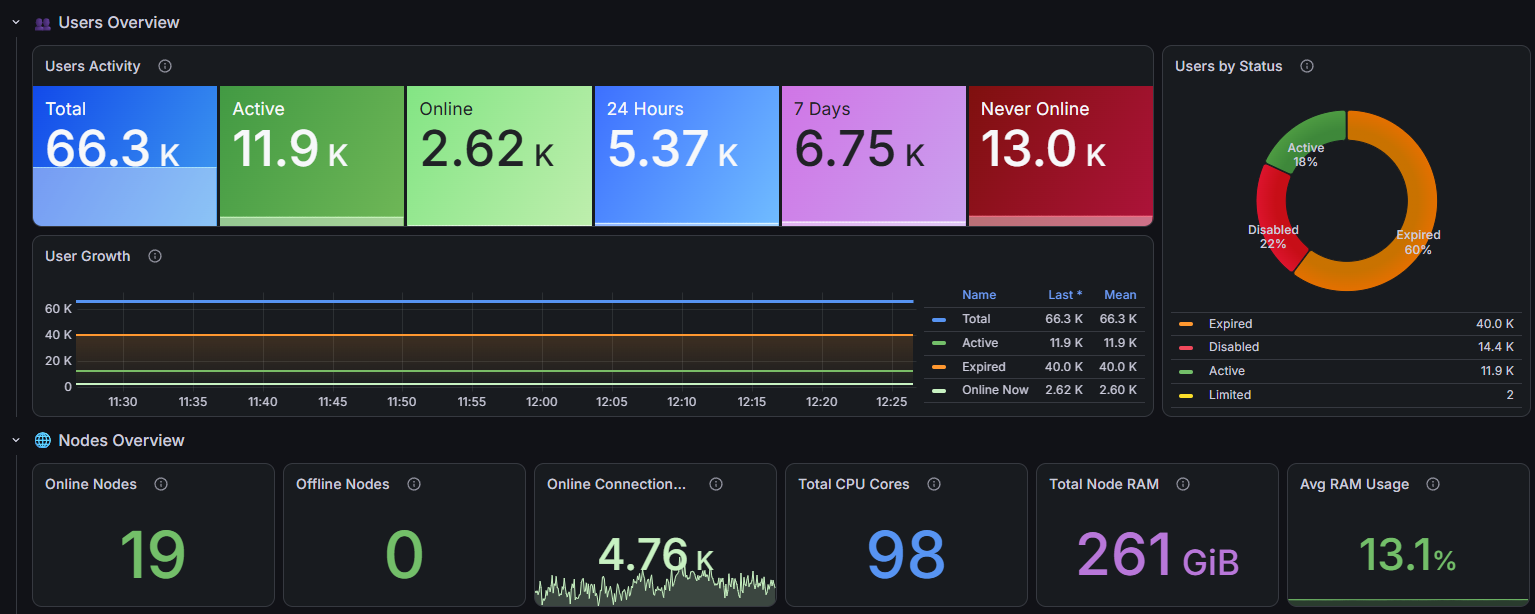
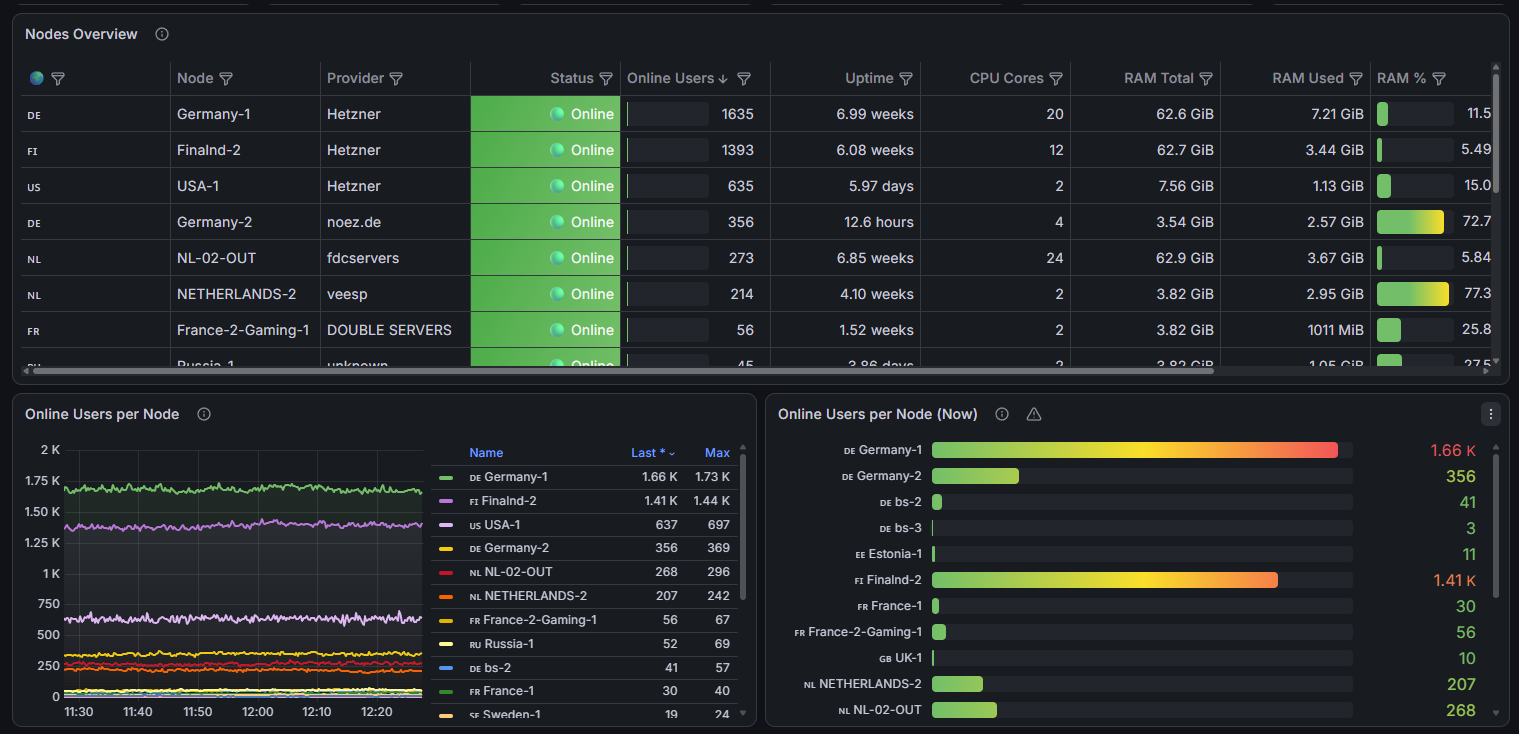
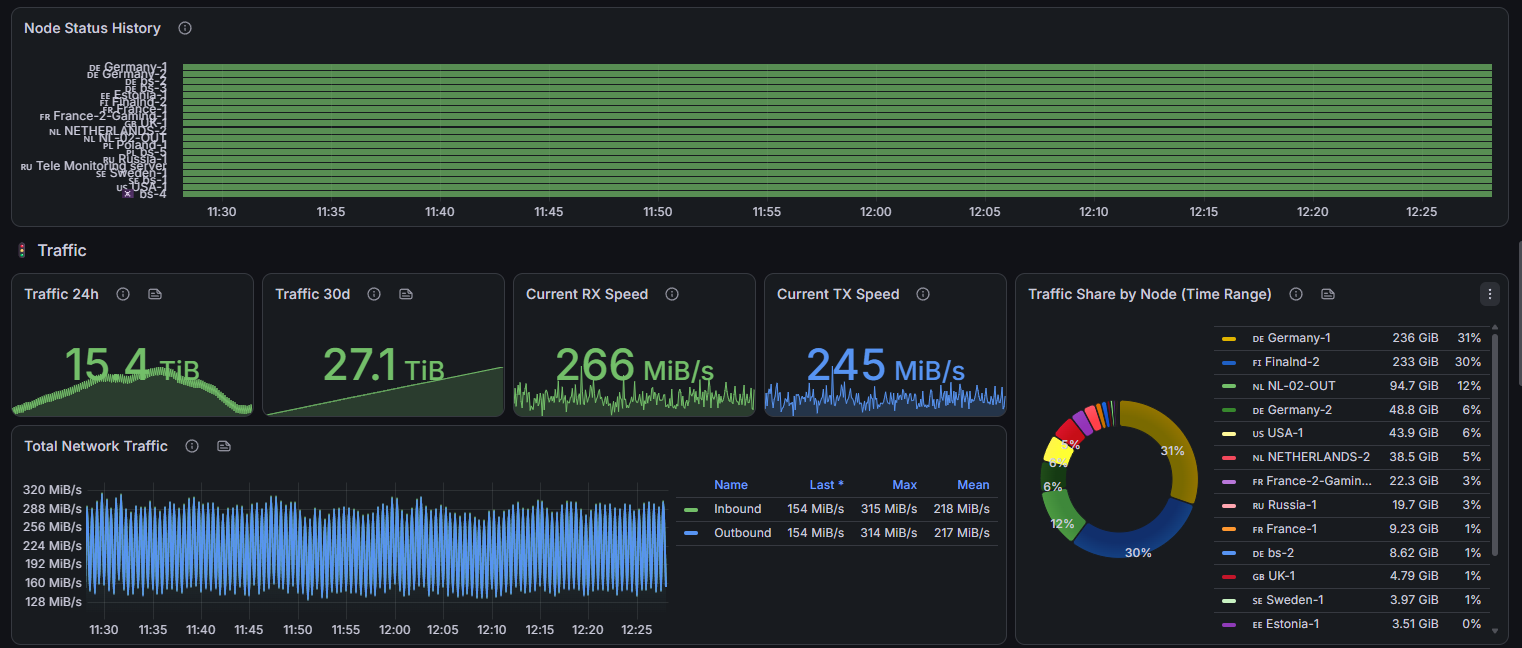
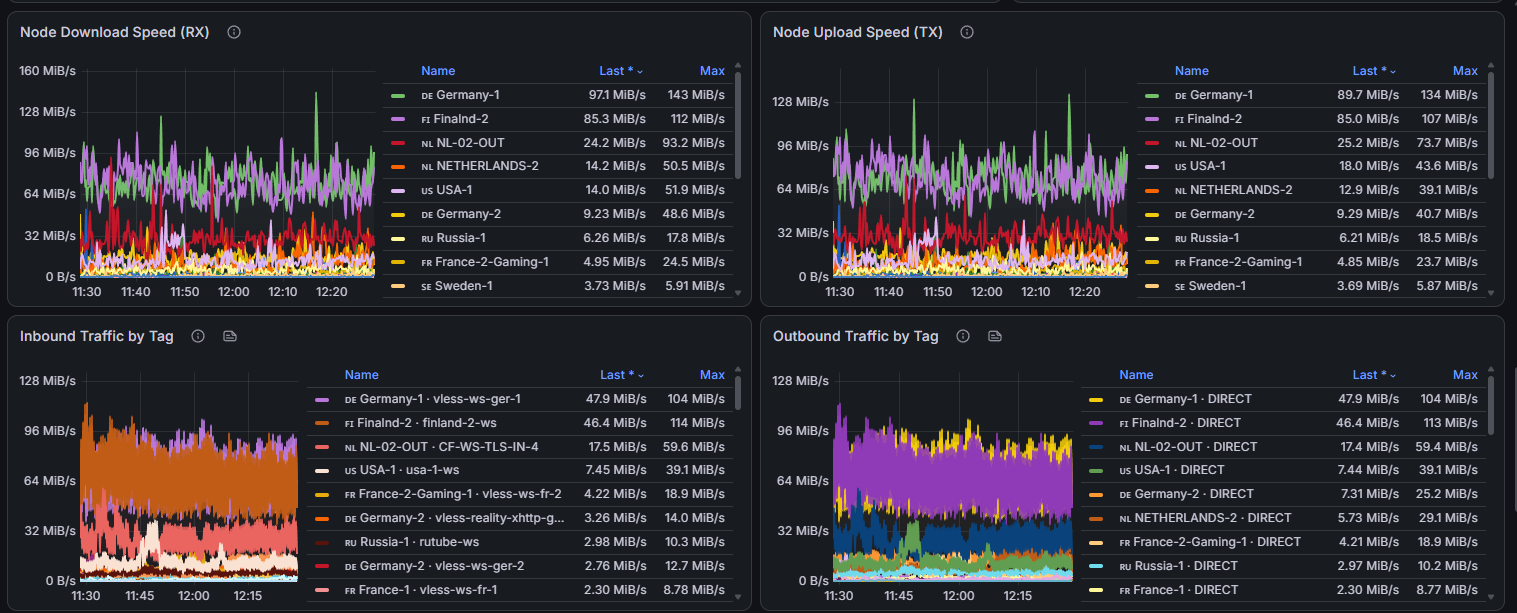
Remnawave Panel Dashboard
Complete monitoring dashboard for Remnawave — a VPN panel built on Xray-core.
Source & issues: https://github.com/tayden1990/RemnaWave-Grafana
What it shows
- 👥 Users Overview — total/active/expired/disabled/limited users, distinct online users (now / 24h / 7d / never), user growth over time
- 🌐 Nodes Overview — online/offline node counts, per-node status table (status, online users, uptime, CPU cores, RAM usage, live RX/TX speed), online users per node, node connect/disconnect history timeline
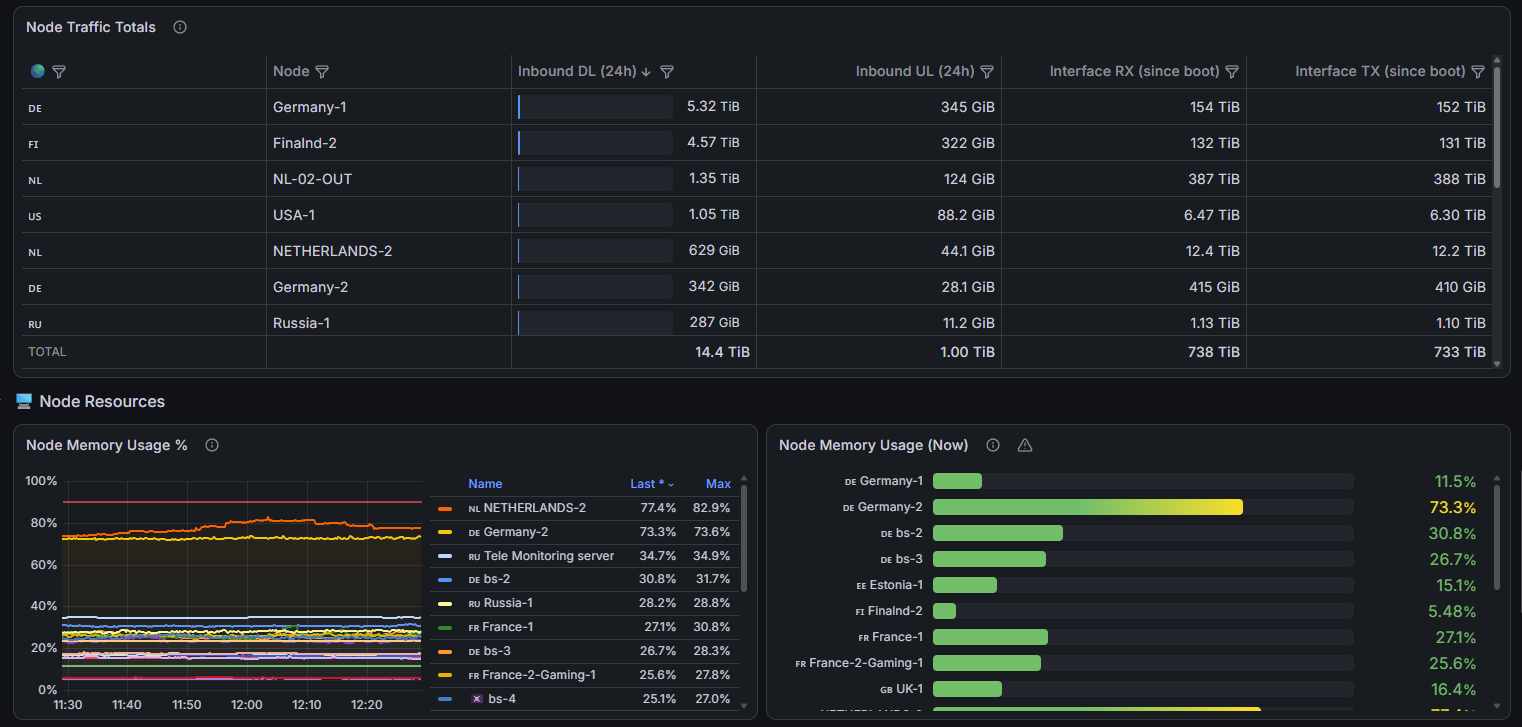
- 🚦 Traffic — 24h/30d totals, current RX/TX speed, traffic share by node, inbound traffic per tag, outbound traffic per tag (DIRECT / warp / BLOCK), per-node traffic totals table
- 🖥️ Node Resources — memory usage per node, hardware & OS inventory (CPU model, cores, arch, kernel, uptime)
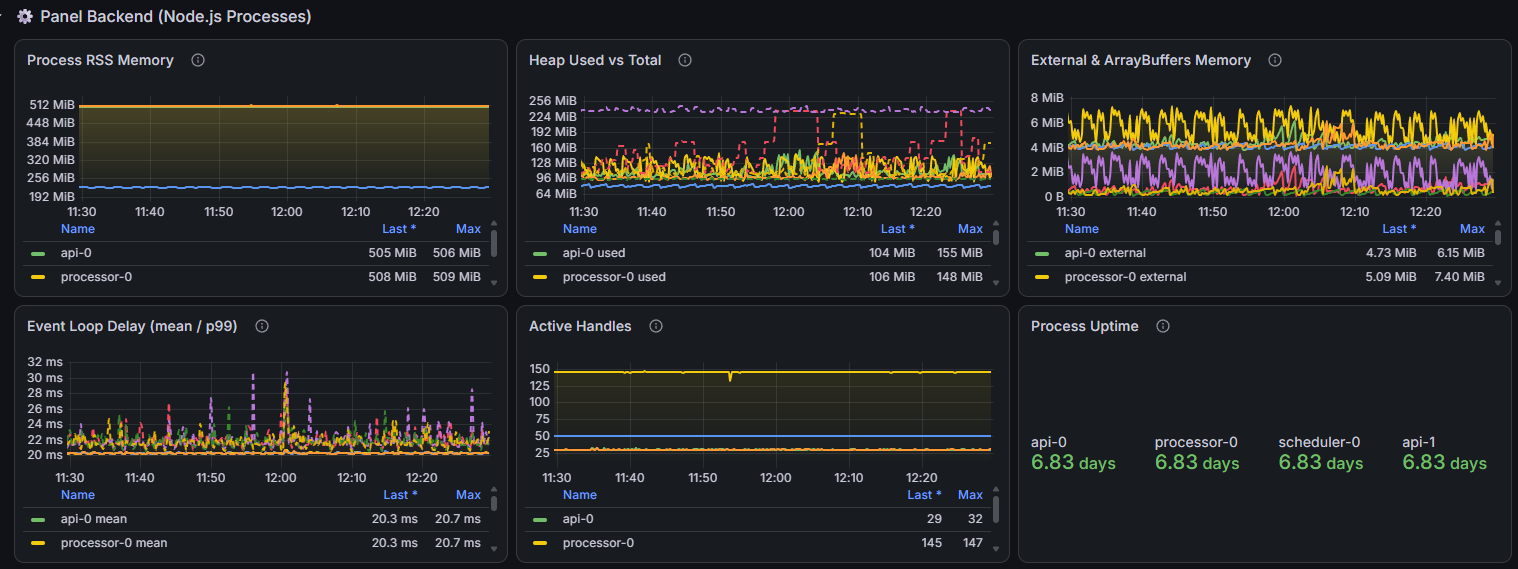
- ⚙️ Panel Backend — Node.js process metrics: RSS, heap used vs total, external/ArrayBuffers memory, event loop delay (mean/p99), active handles, process uptime
All node panels join remnawave_node_basic_info, so legends show friendly node names with country flags instead of UUIDs.
Requirements
- Remnawave panel with the metrics endpoint enabled (
METRICS_USER/METRICS_PASSin your.env) - Prometheus scraping the panel's
/metricsendpoint - Grafana 10.0+
Prometheus scrape config
scrape_configs:
  - job_name: remnawave
    scrape_interval: 30s
    metrics_path: /metrics
    basic_auth:
      username: YOUR_METRICS_USER
      password: YOUR_METRICS_PASS
    static_configs:
      - targets:
          - "your-panel-host:3001"
Setup
- Import the dashboard and select your Prometheus data source.
- Use the Server variable to filter by panel instance and the Node variable to filter node-level panels.
Notes
- Traffic 24h/30d stats count inbound (user-side) traffic only, to avoid double-counting inbound + outbound.
- The internal
REMNAWAVE_API_INBOUNDtag is excluded from the "Inbound Traffic by Tag" chart.
Author
Data source config
Collector type:
Collector plugins:
Collector config:
Revisions
Upload an updated version of an exported dashboard.json file from Grafana
| Revision | Description | Created | |
|---|---|---|---|
| Download |