
UniFi AP Dashboard
Ubiquiti Networks UniFi AP Dashboard. (grafana.com rev 1)
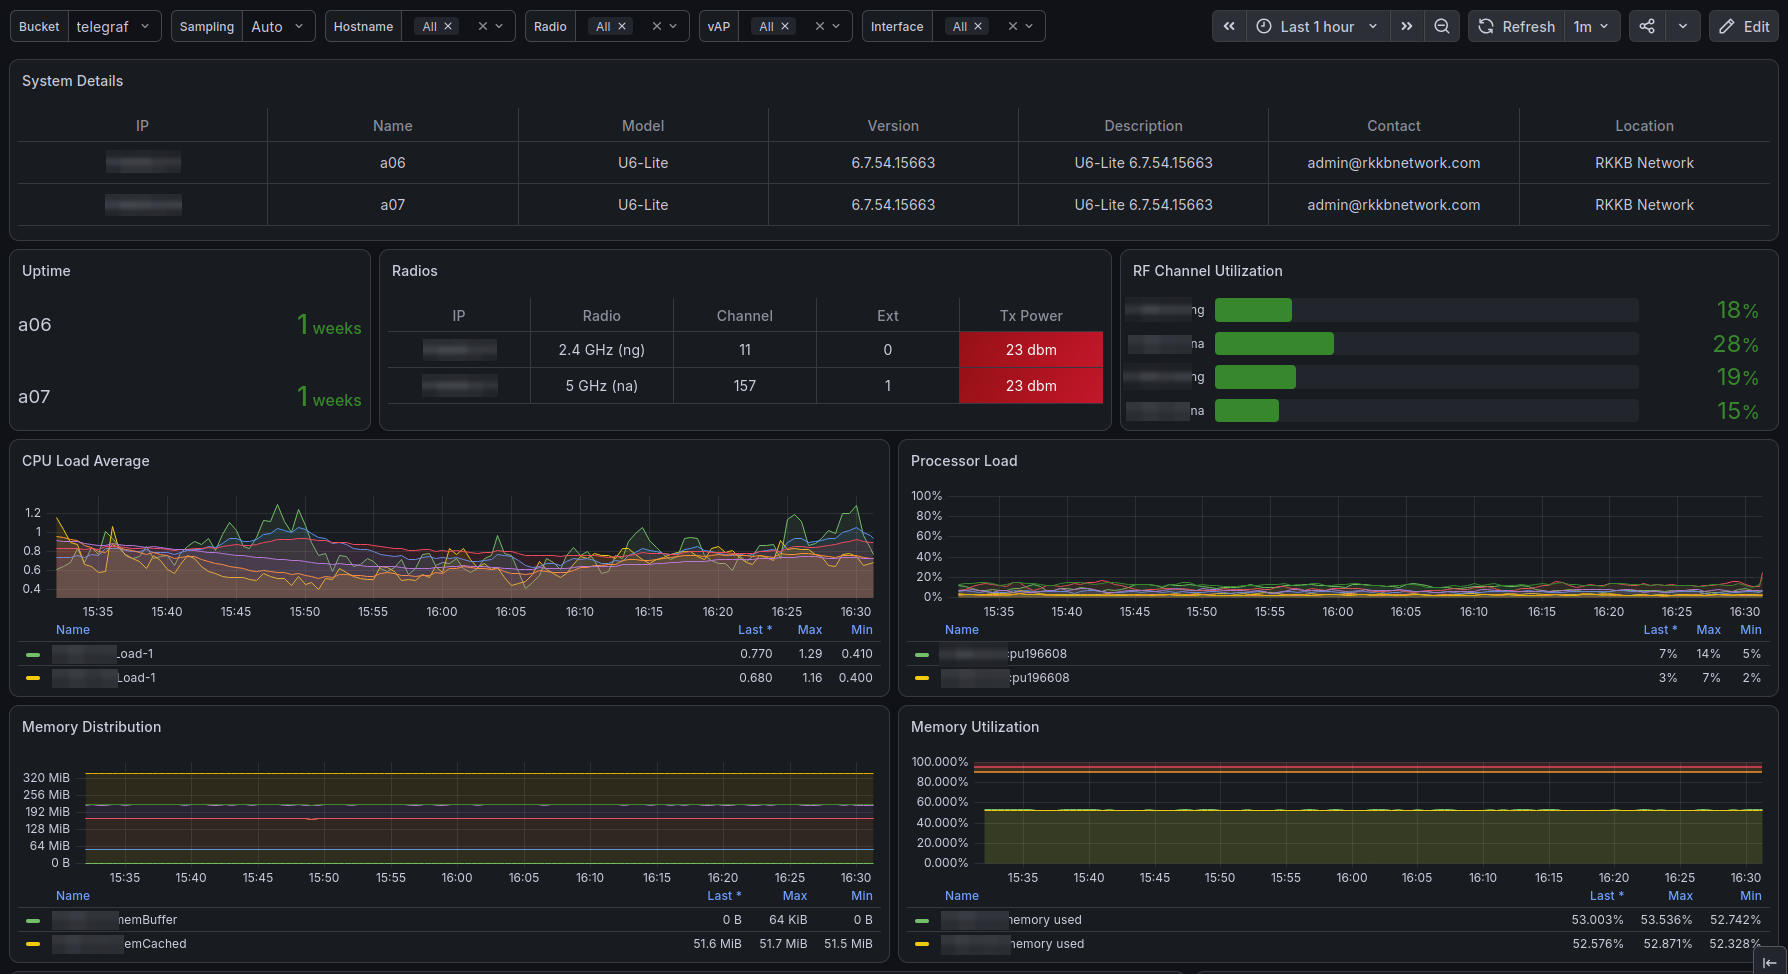
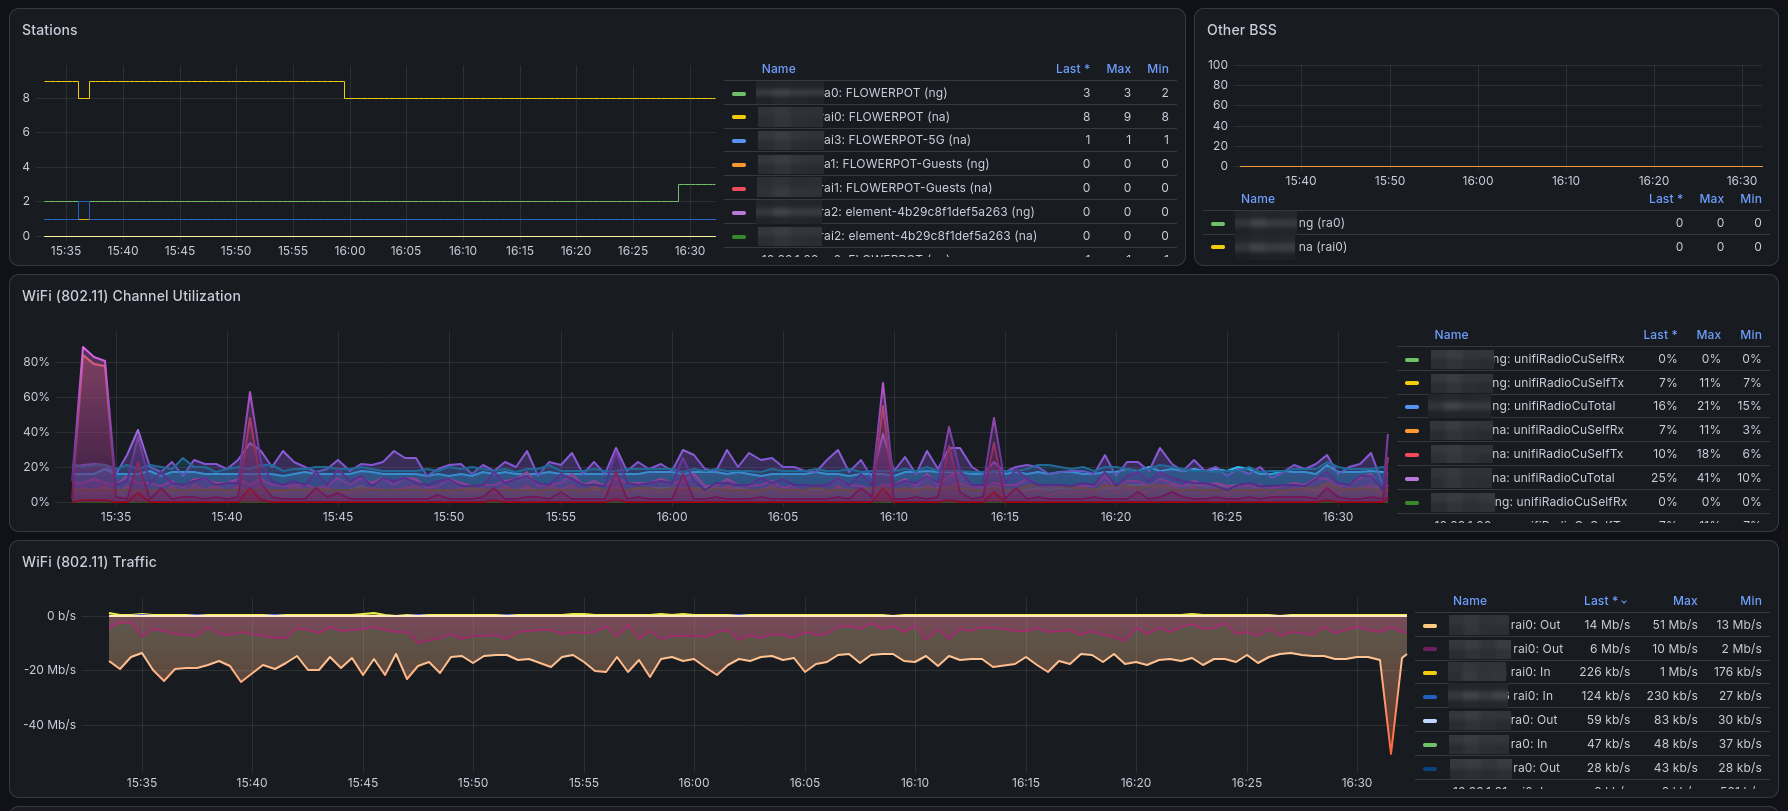
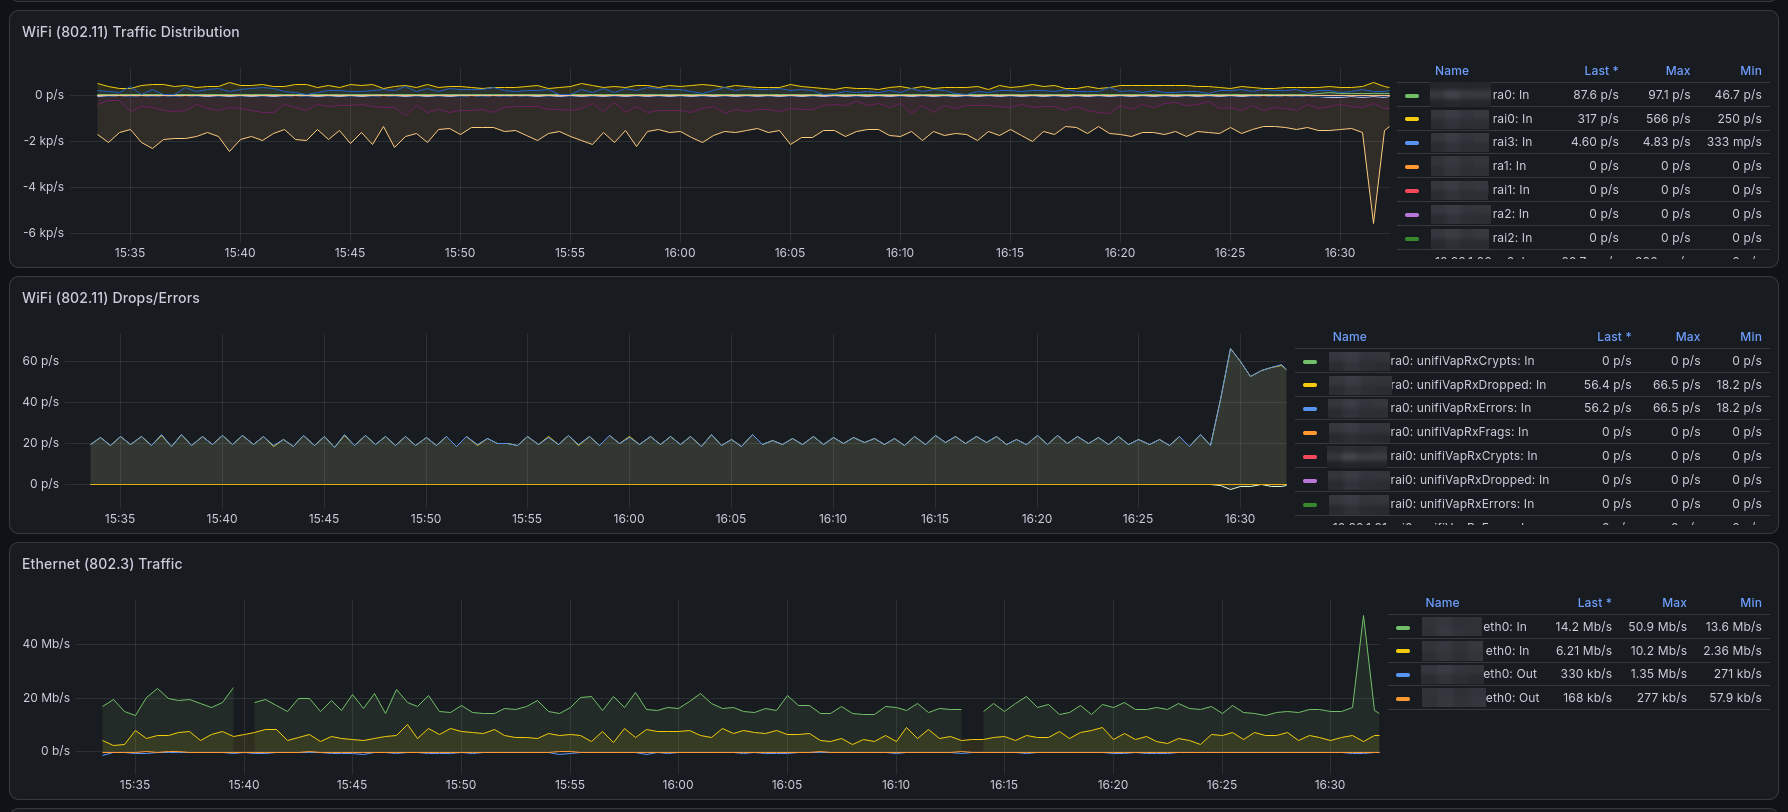
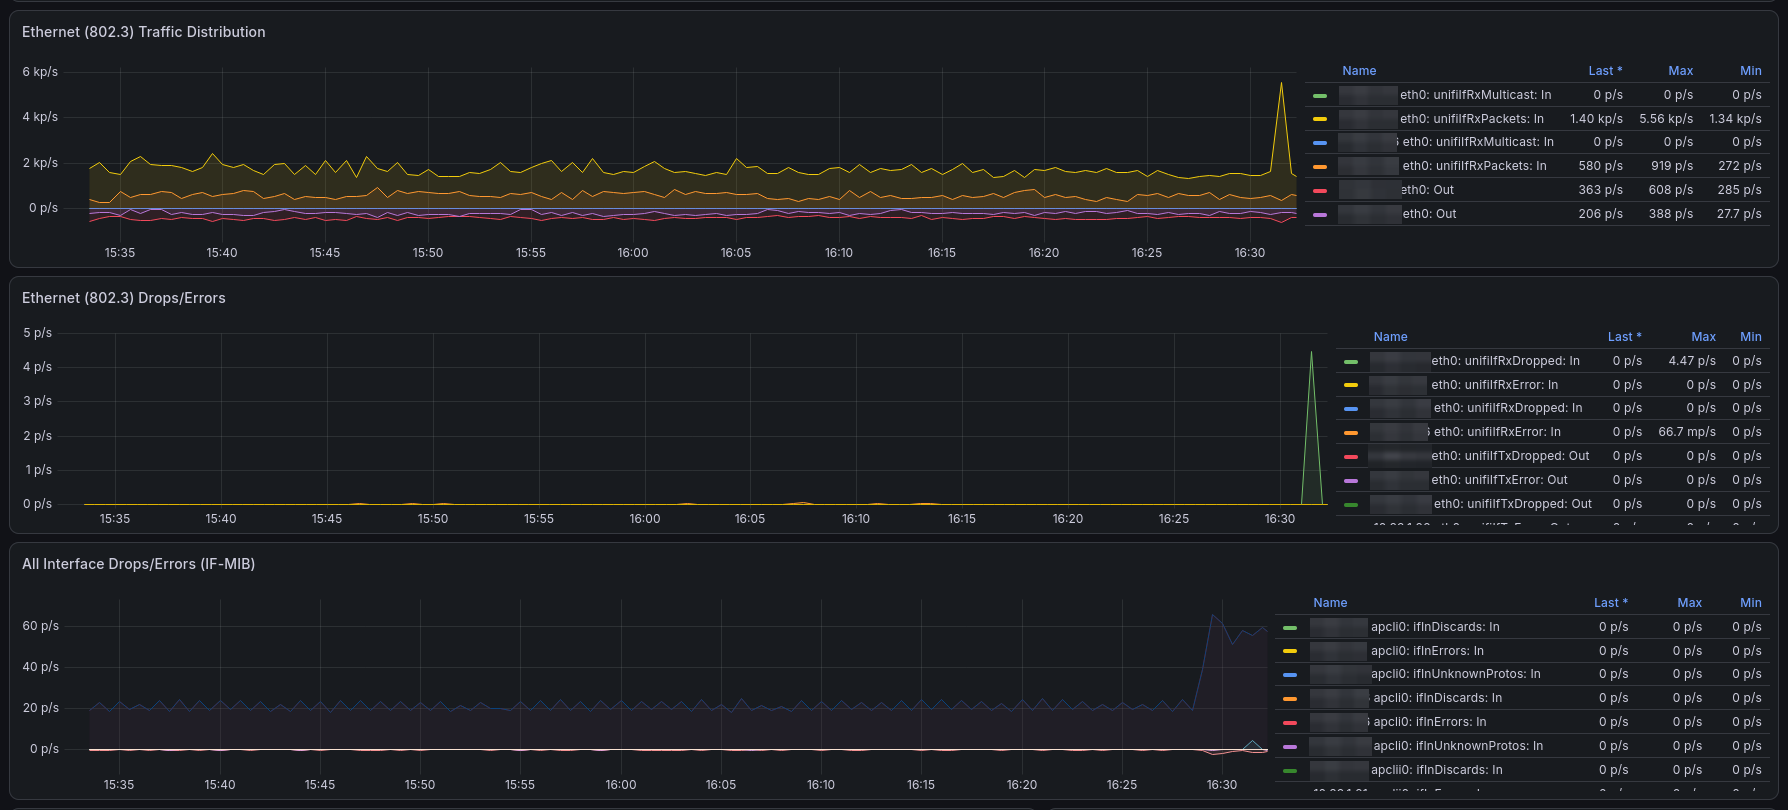

Overview
The UniFi AP dashboard visualizes Ubiquiti access-point health and RF state — device details and uptime, CPU load and memory, wired (802.3) and wireless (802.11) traffic and drops/errors, channel and RF utilization, radios, stations, and SNMP health. Metrics are collected by Telegraf polling each AP over SNMP (SNMPv3 authPriv) and written to InfluxDB v2, which Grafana queries with Flux. Drill-down across APs, radios, VAPs, and interfaces uses the uaphostname, uapradio, uapvap, and uapintf variables.
Highlights
- Device health: System Details, Uptime, CPU Load Average / Processor Load, Memory Utilization & Distribution.
- Wired (802.3): Traffic, Traffic Distribution, Drops/Errors, plus all-interface drops/errors (IF-MIB).
- Wireless (802.11): Traffic, Traffic Distribution, Drops/Errors, Channel Utilization, RF Channel Utilization, Radios, Stations, Other BSS.
- SNMP health: Messages/min and Objects Retrieved/min.
- Drill-down via the
uaphostname,uapradio,uapvap, anduapintfvariables.
Requirements
- Grafana 11.1.3+
- InfluxDB v2 (queried with Flux) — pick your data source for the
DS_INFLUXDBinput on import. - Telegraf with the SNMP input polling your UniFi AP(s) (IF-MIB and the UniFi 802.3 / 802.11 metrics).
Variables
uaphostname, uapradio, uapvap, uapintf, bucket, interval.
Data source config
Collector type:
Collector plugins:
Collector config:
Revisions
Upload an updated version of an exported dashboard.json file from Grafana
| Revision | Description | Created | |
|---|---|---|---|
| Download |