
Synology Dashboard
Grafana Dashboard for Synology Devices, collecting SNMP using Telegraf, and InfluxDB. (grafana.com rev 1)
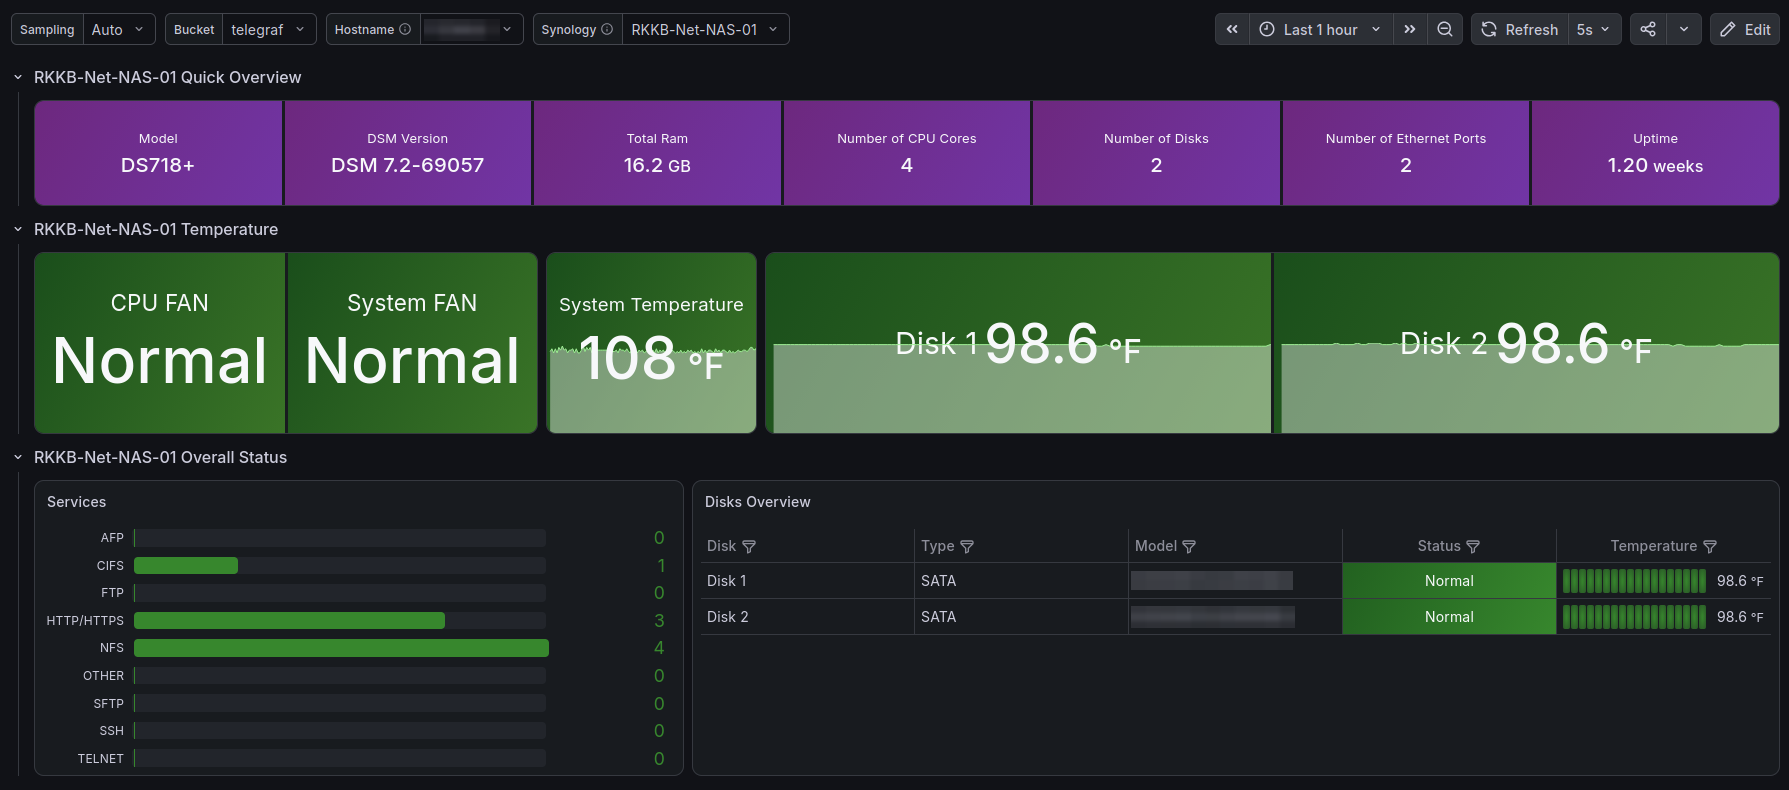
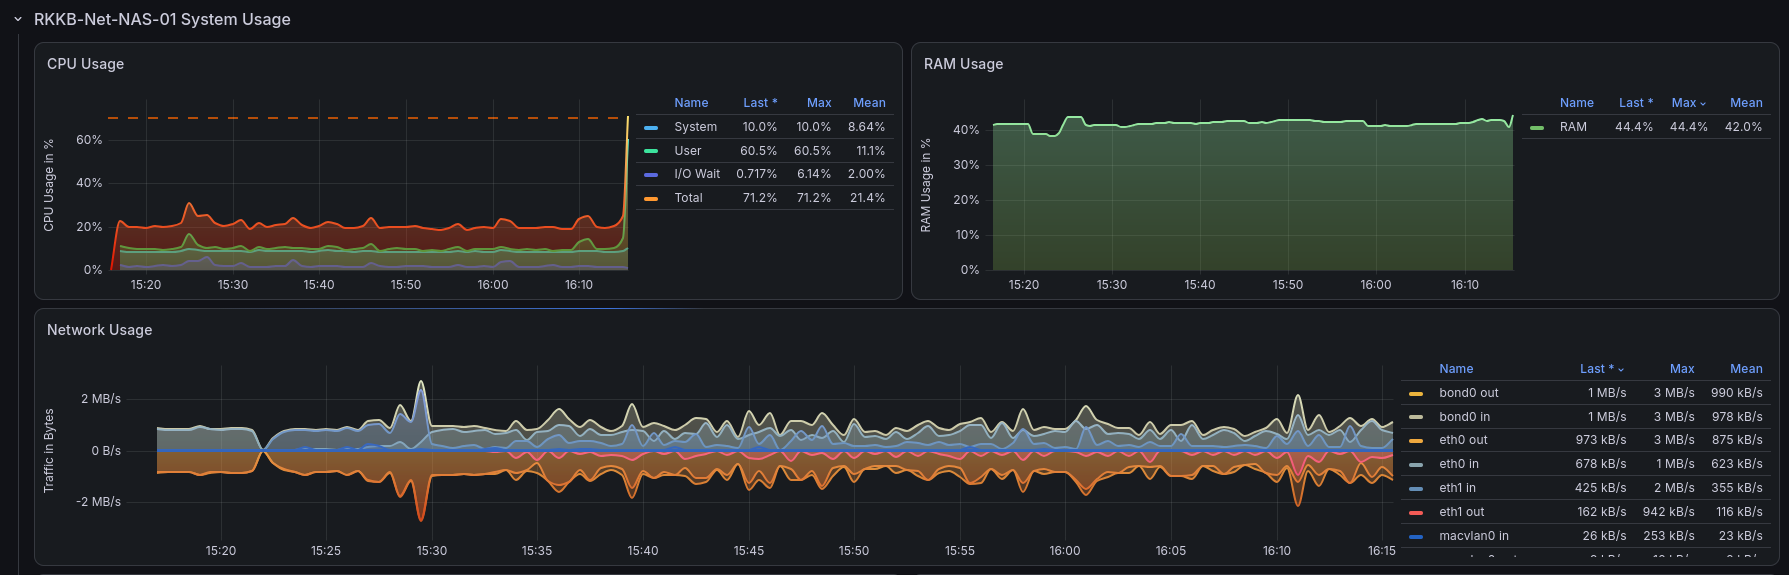
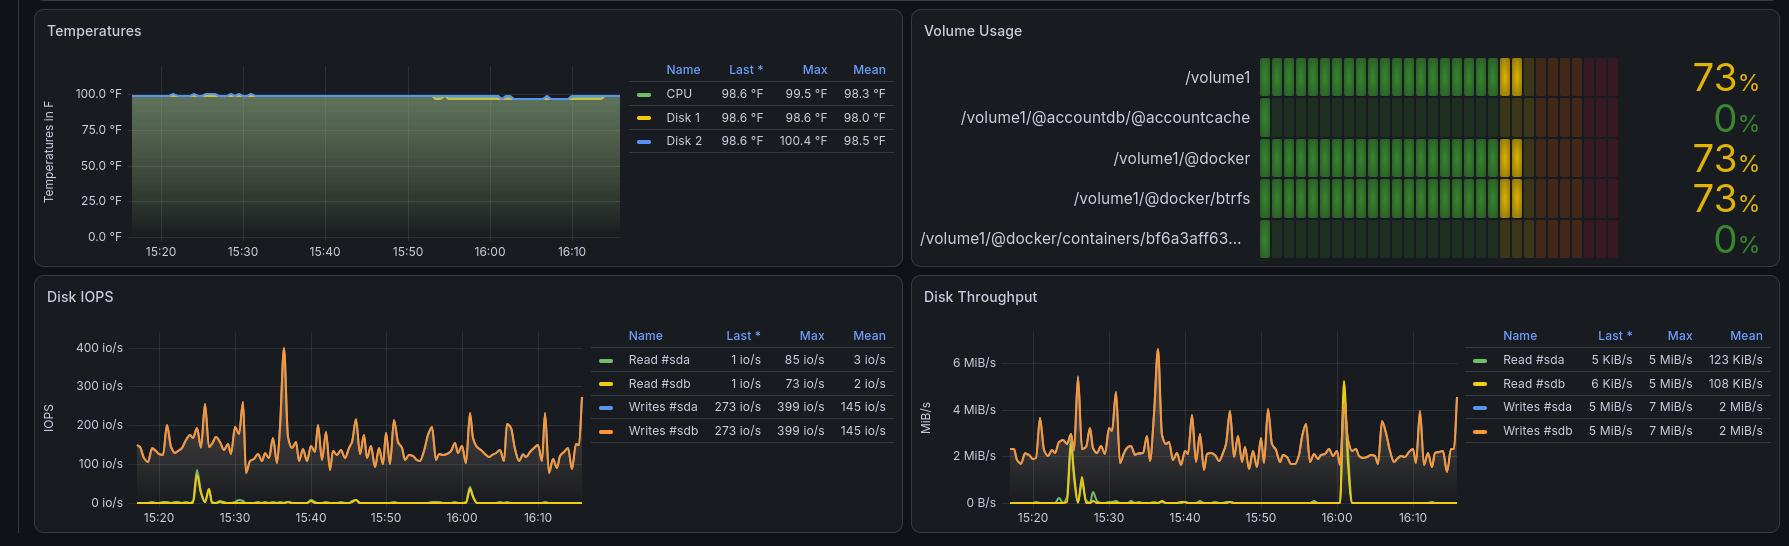
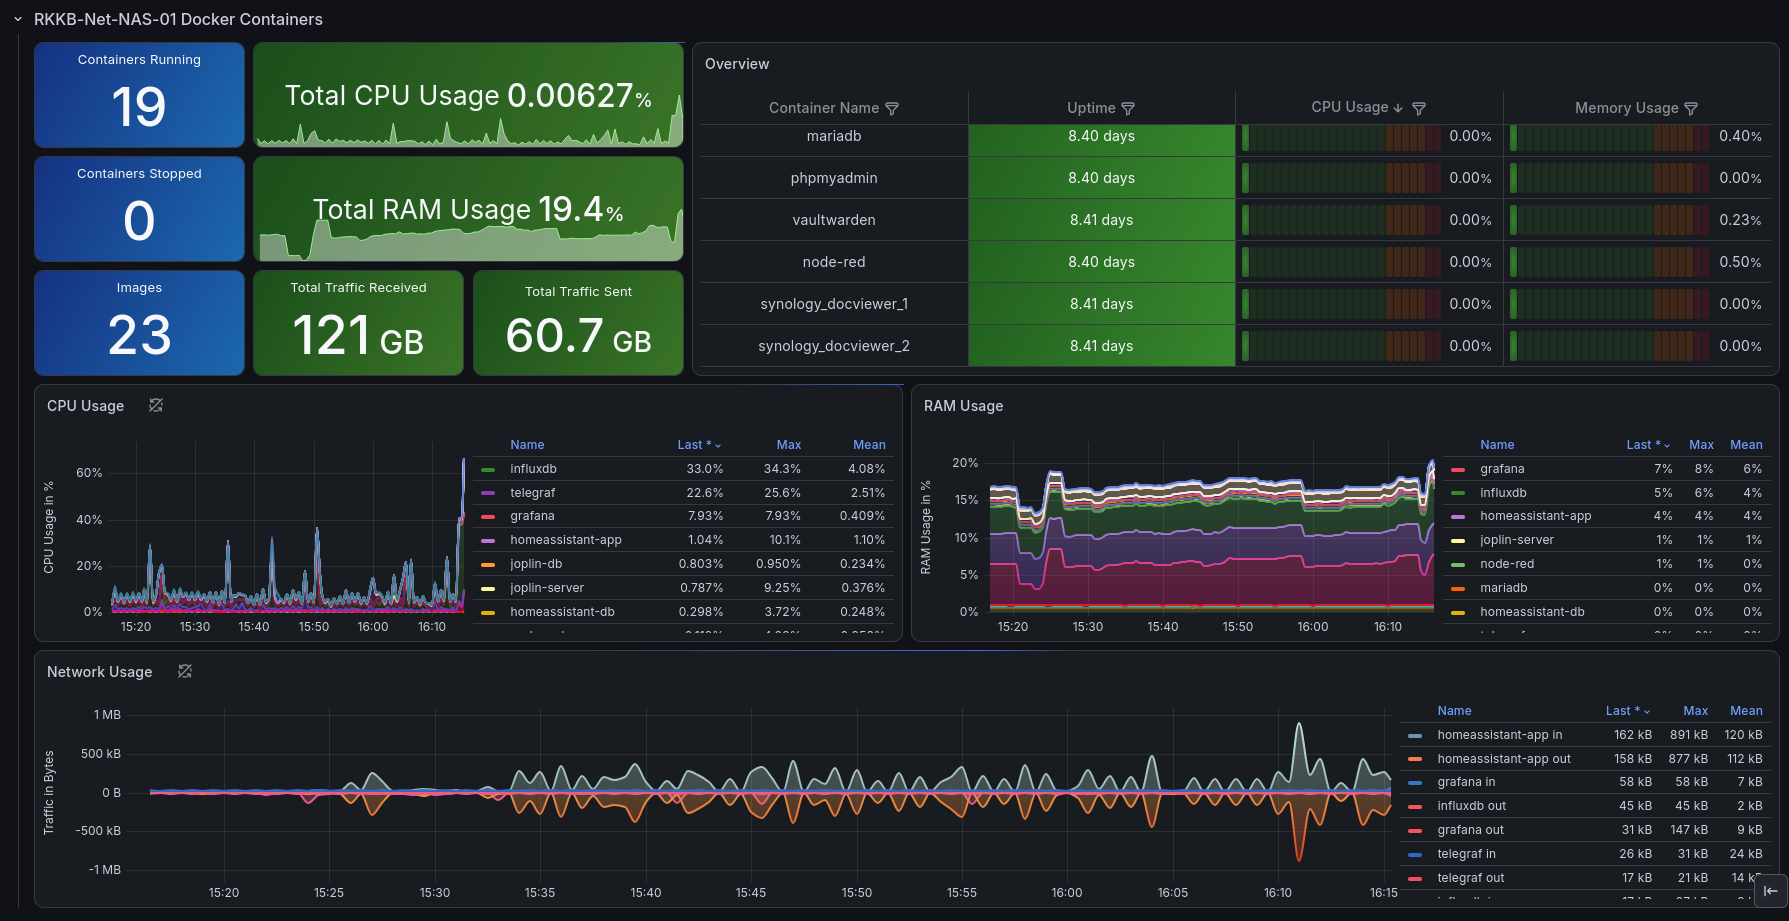
Overview
The Synology dashboard visualizes DSM NAS health — overview and system/services status, CPU and RAM usage, temperatures, storage (disks overview, volume usage, disk IOPS and throughput), and network usage. Metrics are collected by Telegraf polling each NAS over SNMP and written to InfluxDB v2, which Grafana queries with Flux. Multiple NAS units are supported via the synologyhostname / synology variables.
Highlights
- Overview plus System / Services status.
- CPU Usage, RAM Usage, and Temperatures.
- Storage: Disks Overview, Volume Usage, Disk IOPS, Disk Throughput.
- Network Usage.
- Multi-NAS ready via the
synologyhostname/synologyvariables.
Requirements
- Grafana 11.1.3+
- InfluxDB v2 (queried with Flux) — pick your data source for the
DS_INFLUXDBinput on import. - Telegraf with the SNMP input polling your Synology DSM device(s) (enable SNMP in DSM Control Panel → Terminal & SNMP).
Variables
synologyhostname, synology, bucket, interval.
Data source config
Collector type:
Collector plugins:
Collector config:
Revisions
Upload an updated version of an exported dashboard.json file from Grafana
| Revision | Description | Created | |
|---|---|---|---|
| Download |