
Raspberry Pi Dashboard
Grafana Dashboard for Raspberry Pi Devices, collecting SNMP using Telegraf, and InfluxDB. (grafana.com rev 1)
Overview
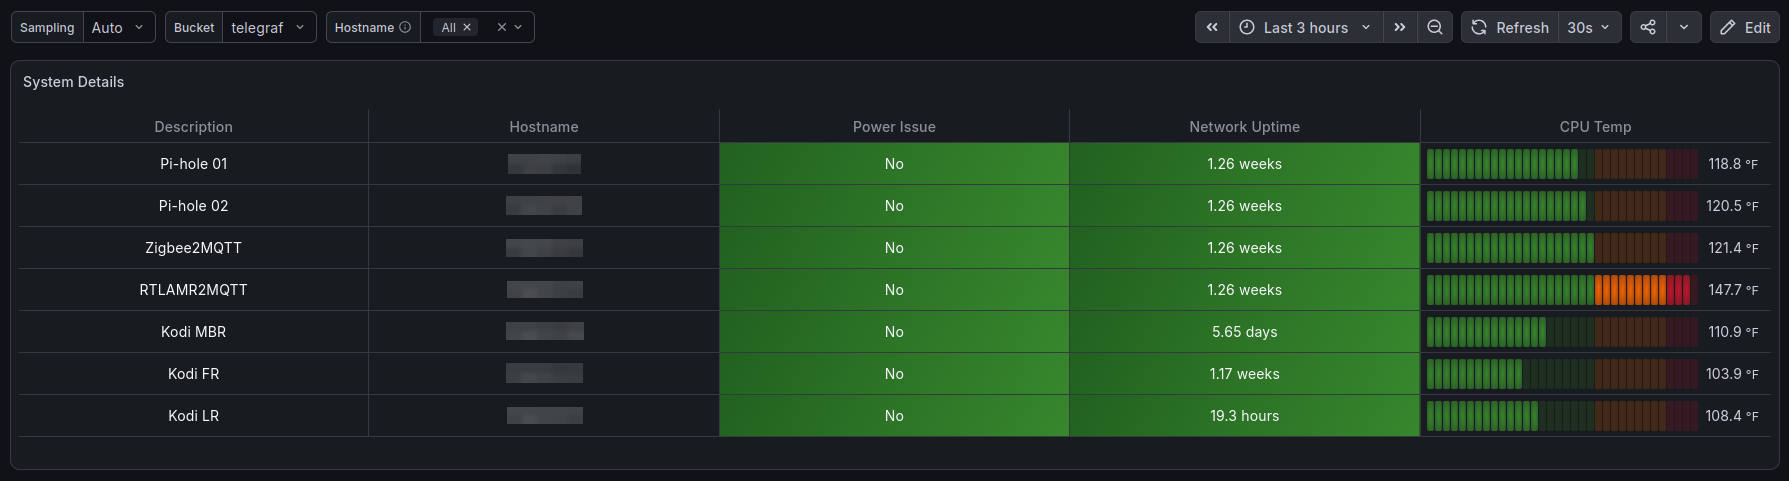
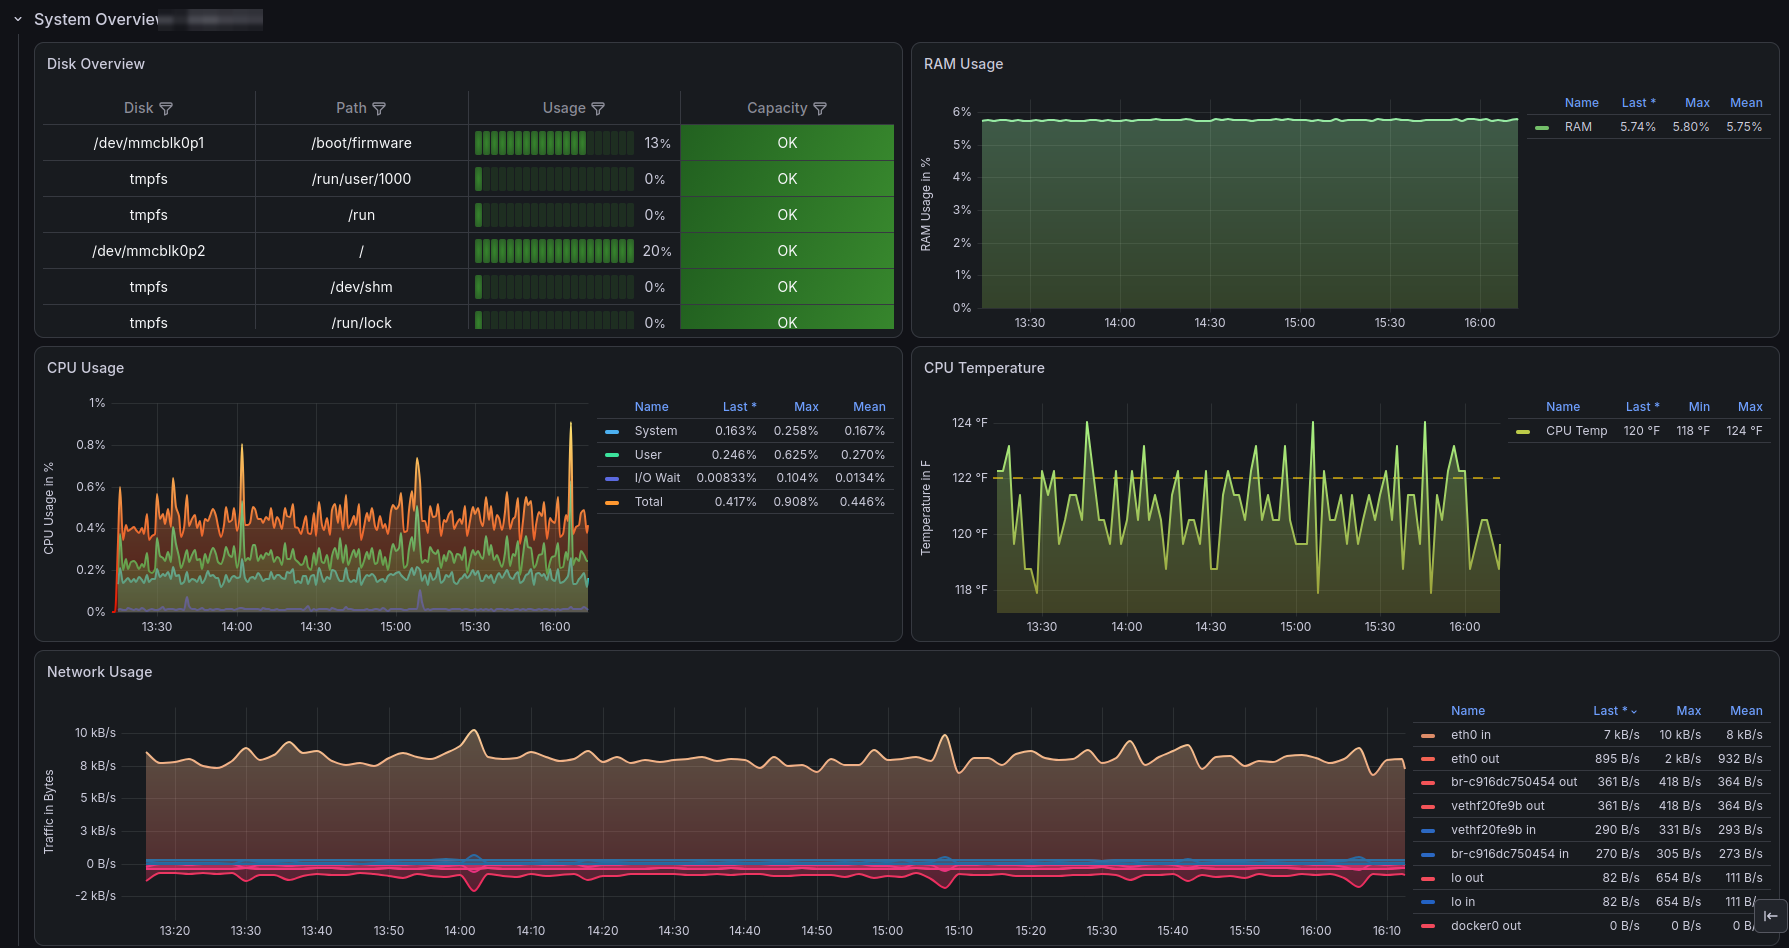
The Raspberry Pi dashboard visualizes host health for one or more Raspberry Pi devices — system details, CPU usage and temperature, RAM usage, a disk overview, and network throughput. Metrics are collected by Telegraf polling each Pi over SNMP (net-snmp snmpd) and written to InfluxDB v2, which Grafana queries with Flux. Multiple devices are supported via the rbpihostname variable.
Highlights
- System Details overview.
- CPU Usage and CPU Temperature.
- RAM Usage, Disk Overview, and Network Usage.
- Per-device selection via the
rbpihostnamevariable.
Requirements
- Grafana 11.1.3+
- InfluxDB v2 (queried with Flux) — pick your data source for the
DS_INFLUXDBinput on import. - Telegraf with the SNMP input polling your Raspberry Pi device(s).
Variables
rbpihostname, bucket, interval.
Data source config
Collector type:
Collector plugins:
Collector config:
Revisions
Upload an updated version of an exported dashboard.json file from Grafana
| Revision | Description | Created | |
|---|---|---|---|
| Download |

Raspberry Pi

Easily monitor Raspberry Pi, the small, single-board computers, with Grafana Cloud's out-of-the-box monitoring solution.
Learn more