
Pi-hole Exporter Dashboard
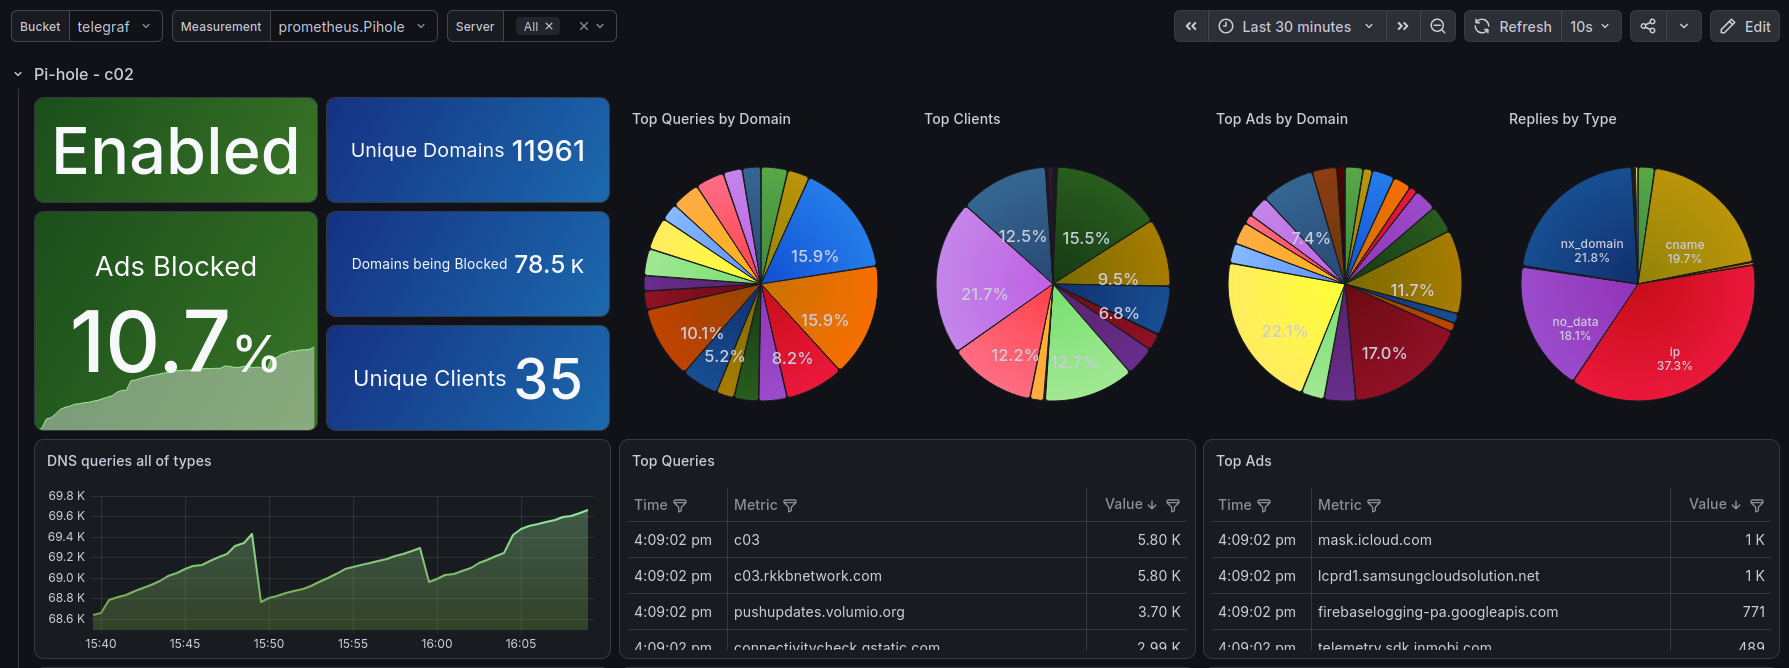
This is a Pi-hole dashboard when using the https://github.com/eko/pihole-exporter Prometheus exporter with an Influxdb2 Datasource. (grafana.com rev 2)
Overview
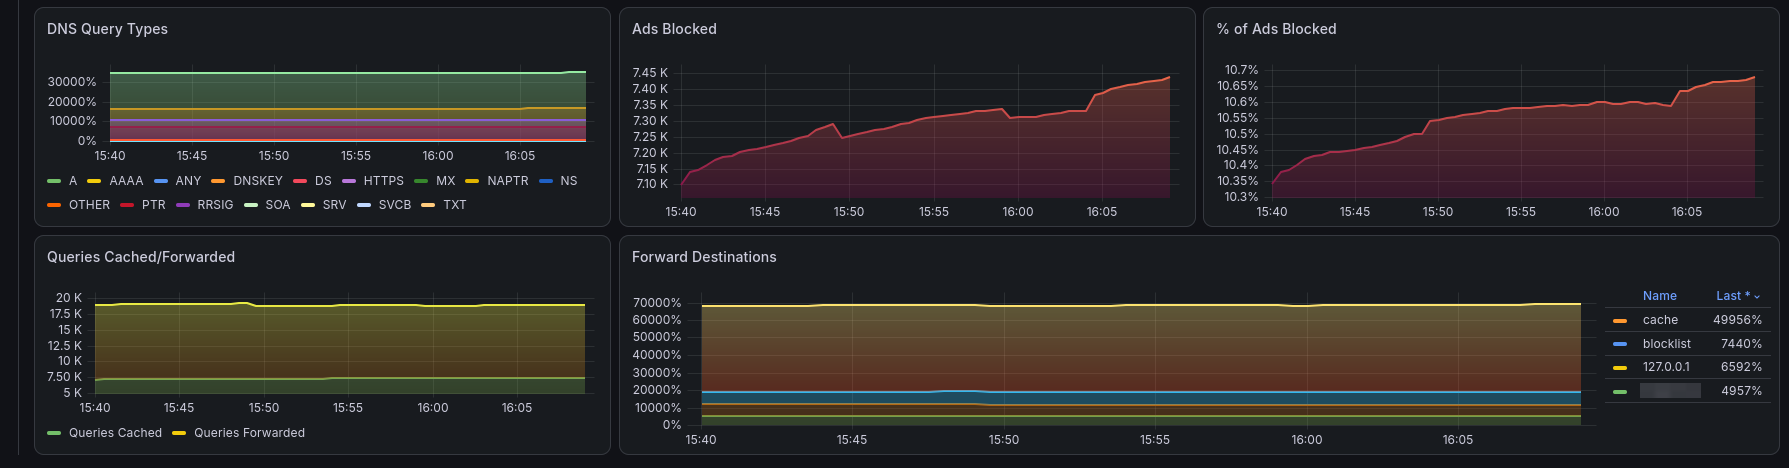
The Pi-hole Exporter dashboard visualizes DNS and ad-blocking activity — query volume with cache/forward breakdown, percent of ads blocked, DNS query and reply types, forward destinations, and top queries / ads / clients. Metrics are collected by Telegraf scraping the eko/pihole-exporter Prometheus endpoint and written to InfluxDB v2, which Grafana queries with Flux. Multiple Pi-hole instances are supported via the server variable.
What's new in rev 2
- Fixed the
servertemplate variable listing duplicate hosts. It could show stale IP-labelled entries (e.g.10.83.11.11) alongside the friendly hostnames (e.g.c02,c03) when an exporter'shostnametag had changed over time. Itsv1.tagValuesquery is now scoped to the selected${measurement}and excludes IP-shapedhostnamevalues, so only current, named hosts appear in the dropdown. - No panel, metric, or query changes — only the
servervariable definition changed. Existing users can re-import over the previous version.
Highlights
- Query overview: DNS queries (all types), % of Ads Blocked, Ads Blocked, Queries Cached/Forwarded.
- Breakdowns: DNS Query Types, Replies by Type, Forward Destinations.
- Top lists: Top Queries / Top Queries by Domain, Top Ads / Top Ads by Domain, Top Clients.
- Multi-instance ready via the
servervariable.
Requirements
- Grafana 11.1.3+
- InfluxDB v2 (queried with Flux) — pick your data source for the
DS_INFLUXDBinput on import. - Telegraf scraping
pihole-exporter(Prometheus) into InfluxDB v2.
Variables
server, bucket, measurement.
Data source config
Collector config:
Upload an updated version of an exported dashboard.json file from Grafana
| Revision | Description | Created | |
|---|---|---|---|
| Download |

Raspberry Pi

Easily monitor Raspberry Pi, the small, single-board computers, with Grafana Cloud's out-of-the-box monitoring solution.
Learn more