
Jetson GenAI Dashboard
Jetson Orin GenAI host metrics (Telegraf Prometheus scrape -> InfluxDB). (grafana.com rev 1)
Overview
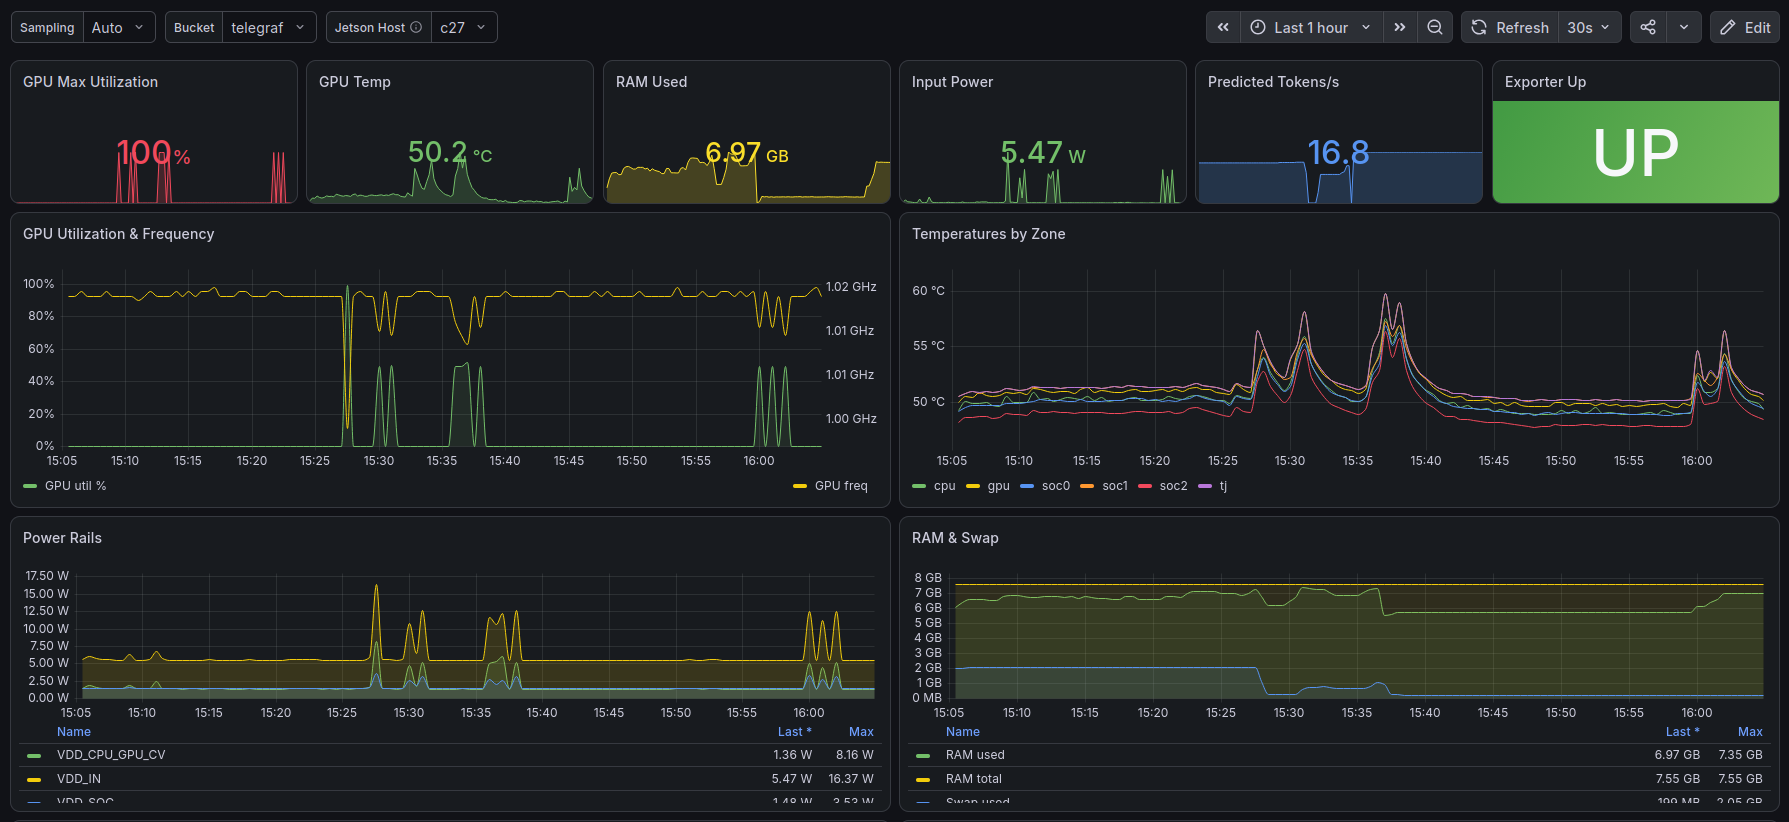
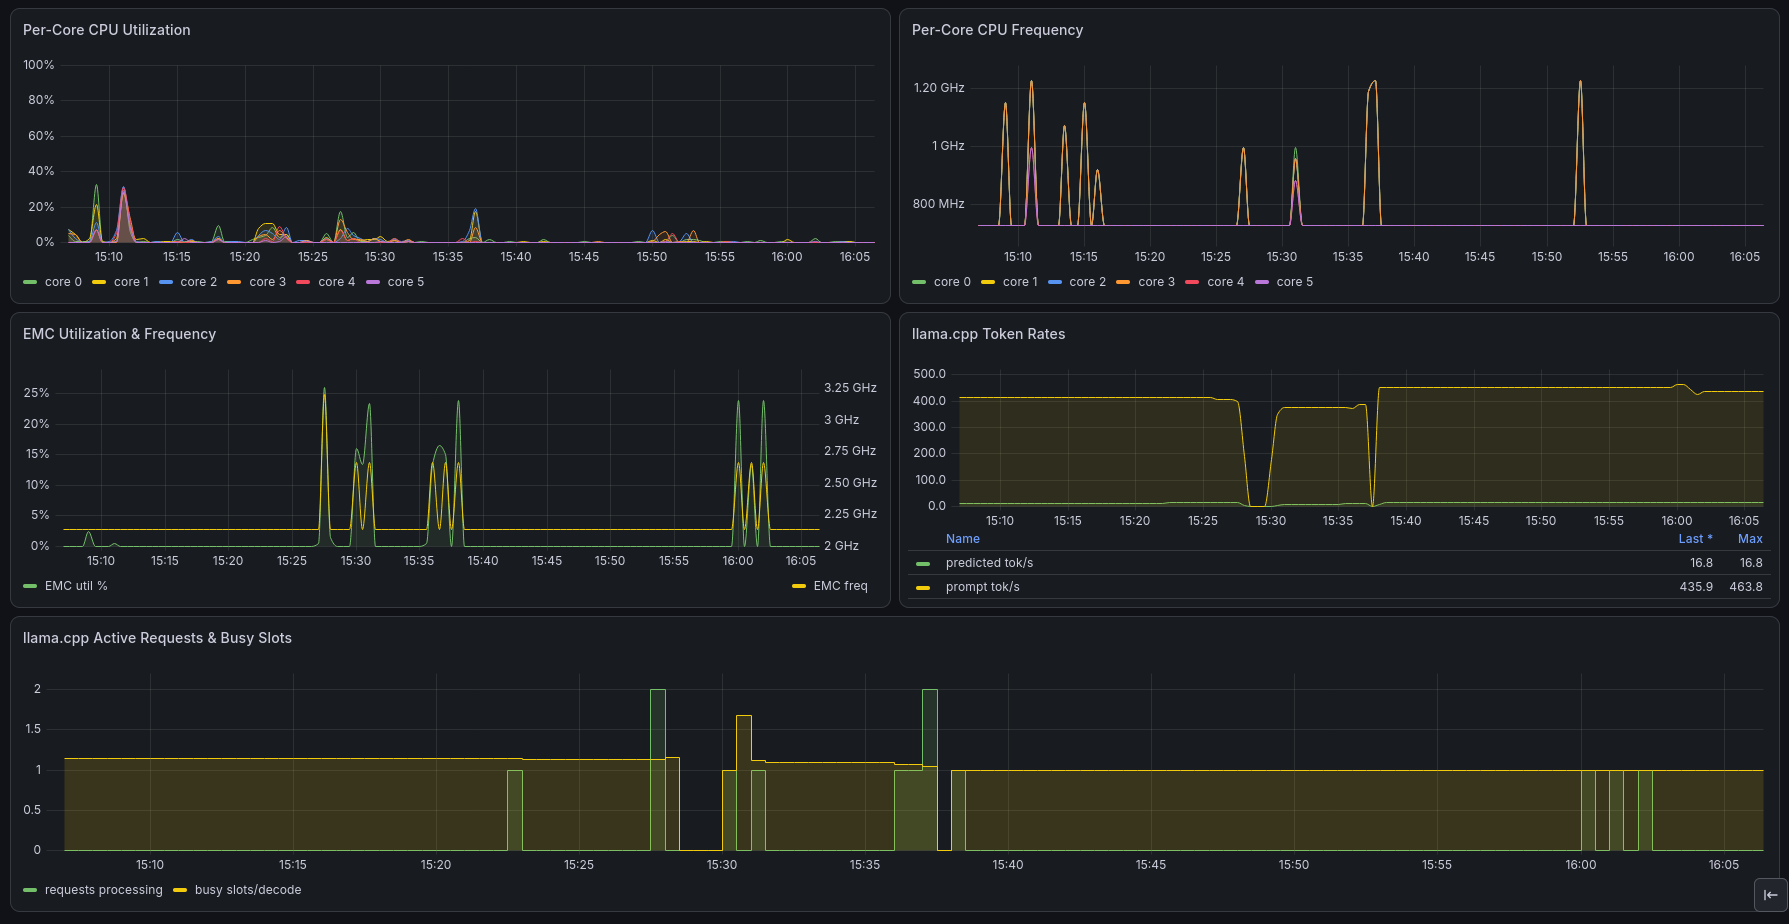
The Jetson GenAI dashboard visualizes host and inference metrics for an NVIDIA Jetson Orin running local GenAI workloads — GPU utilization/frequency/temperature, per-core CPU, RAM/swap and EMC utilization, power rails and thermals, plus llama.cpp inference stats (token rates, predicted tokens/s, active requests and busy slots, and an exporter-up health stat). Metrics are collected by Telegraf scraping the Jetson's tegrastats exporter and llama.cpp's Prometheus endpoints, written to InfluxDB v2 and queried with Flux. Multiple boards are supported via the Jetson Host variable.
Highlights
- GPU: Max Utilization, Utilization & Frequency, Temperature.
- CPU: Per-Core Utilization and Per-Core Frequency.
- Memory: RAM Used, RAM & Swap; EMC Utilization & Frequency.
- Power & thermals: Input Power, Power Rails, Temperatures by Zone.
- Inference (llama.cpp): Token Rates, Predicted Tokens/s, Active Requests & Busy Slots, plus an Exporter Up health stat.
Requirements
- Grafana 11.1.3+
- InfluxDB v2 (queried with Flux) — pick your data source for the
DS_INFLUXDBinput on import. - Telegraf scraping the Jetson metrics endpoint (Prometheus format) and the
llama.cppmetrics endpoint.
Variables
- Jetson Host (
jetsonhost) — selects which Jetson to view; lists the distincthosttag values from theprometheus.Jetsonmeasurement. Multi-host ready. - Bucket (
bucket) — InfluxDB bucket to query (defaulttelegraf). - Sampling (
interval) — aggregation window for the time-series panels.
Multiple Jetsons: give each board a distinct
hosttag in its Telegraf Prometheus scrape and it will appear in the Jetson Host dropdown.
Data source config
Collector config:
Upload an updated version of an exported dashboard.json file from Grafana
| Revision | Description | Created | |
|---|---|---|---|
| Download |