
DNS WINDOWS SERVER - LOGs
Switchs - DNS WINDOWS SERVER - LOGs **Autor:** Marcus Rônney **Repositório GitHub:** https://github.com/Marcusronney/monitoring_switchs **LinkedIn:** https://www.linkedin.com/in/marcus-r%C3%B4nney-627657bb/?skipRedirect=true **Página pessoal:** http://about.ronney.tech/ **Data:** 16/08/2026 GRUPO TELEGRAM: TI BRASIL LINK:https://t.me/tinobrasil
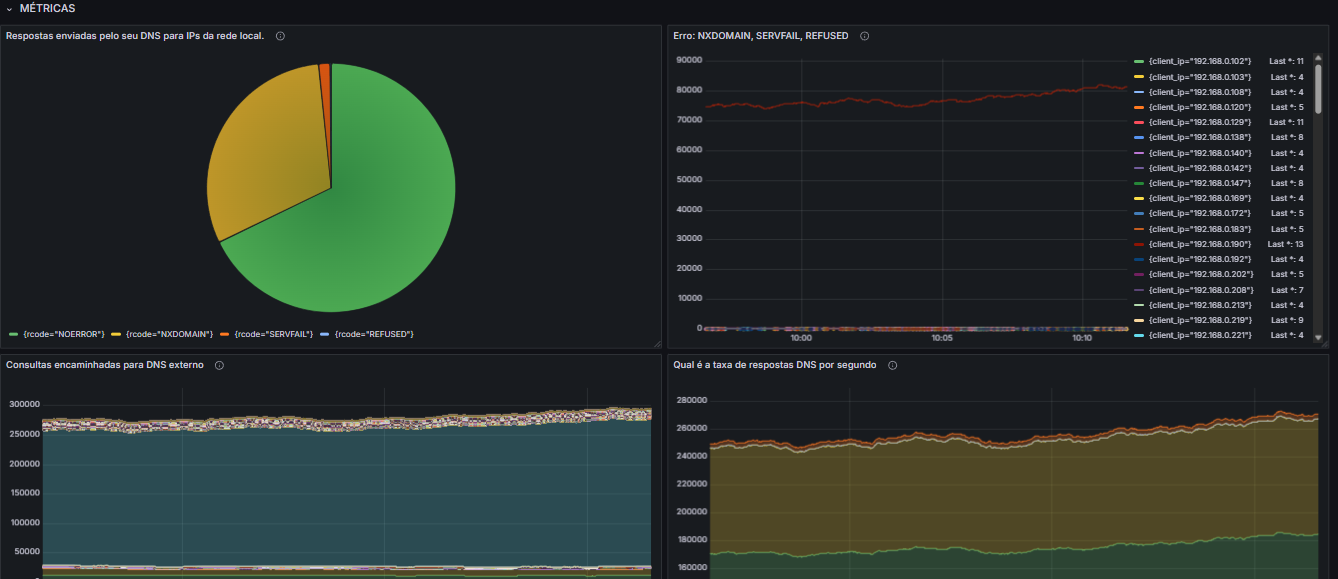
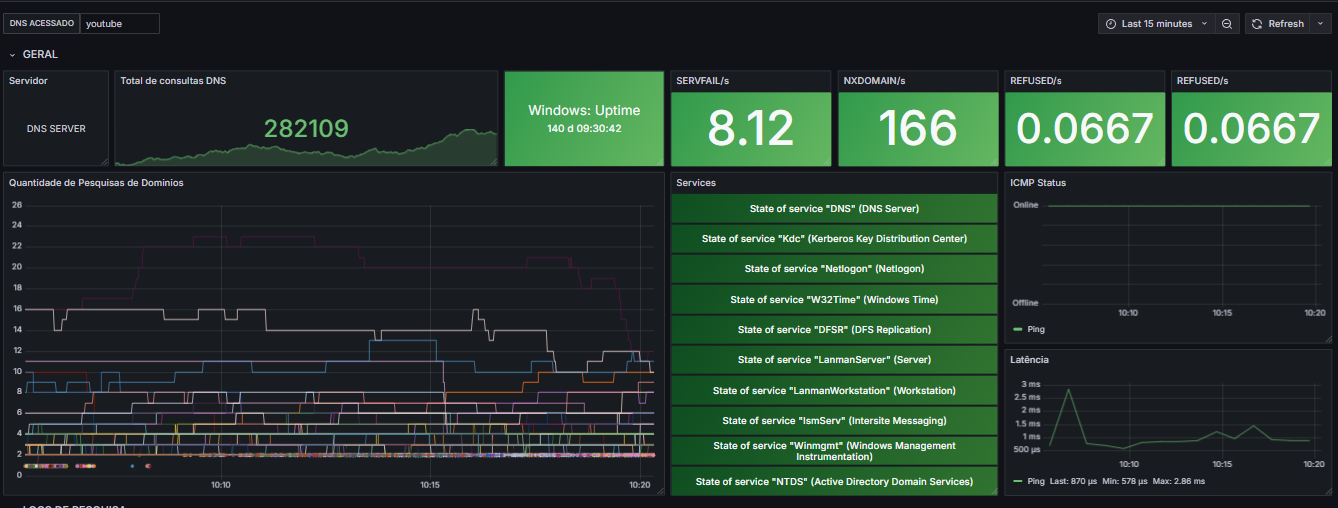
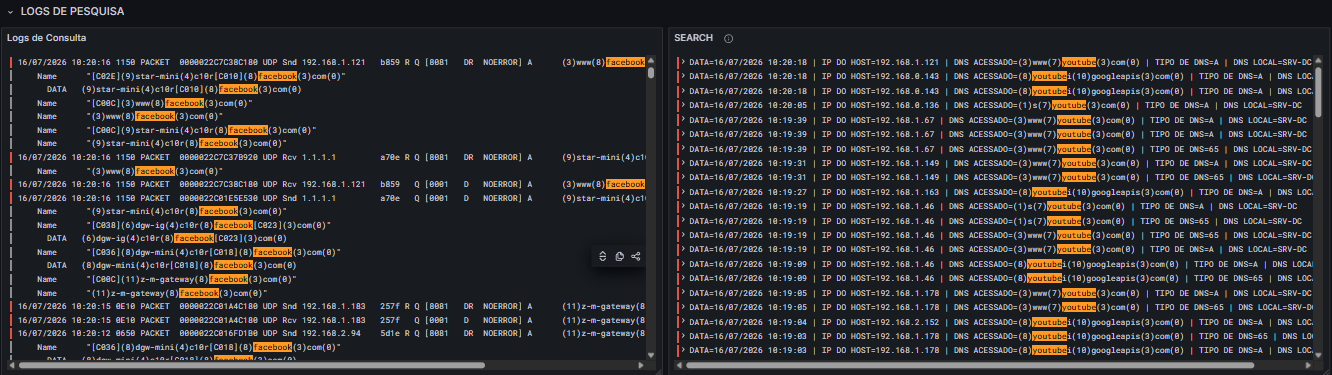
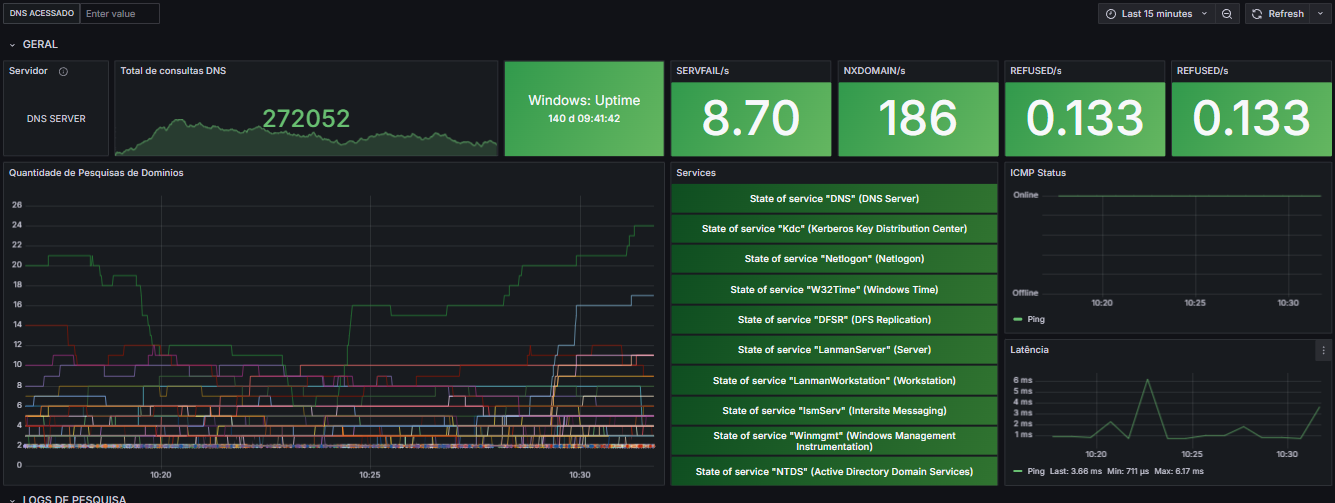
The DNS WINDOWS SERVER - LOGs dashboard uses the alexanderzobnin-zabbix-datasource and loki data sources to create a Grafana dashboard with the gapit-htmlgraphics-panel, logs, piechart, stat and timeseries panels.
Data source config
Collector type:
Collector plugins:
Collector config:
Revisions
Upload an updated version of an exported dashboard.json file from Grafana
| Revision | Description | Created | |
|---|---|---|---|
| Download |

Grafana Loki (self-hosted)

Easily monitor Grafana Loki (self-hosted), a horizontally scalable, highly available, multi-tenant log aggregation system inspired by Prometheus, with Grafana Cloud's out-of-the-box monitoring solution.
Learn more