
Windows + Linux — Server Monitoring
Windows Server & Linux Server (RHEL) monitoring dashboard using Zabbix Agent 2. Shows CPU, RAM, Disk I/O, Network traffic and Zabbix Agent status. Supports multiple servers via dropdown selector. Requirements: - Zabbix Server 6.x / 7.x - Zabbix Agent 2 installed on monitored servers - Grafana Zabbix plugin by Alexander Zobnin (alexanderzobnin-zabbix-datasource) Install: grafana-cli plugins install alexanderzobnin-zabbix-datasource Servers must be in a Zabbix host group called 'Servers'. Compatible with Windows Server 2016/2019/2022/2025 & Linux RHEL Servers

Windows + Linux (RHEL) — Unified Zabbix Monitoring
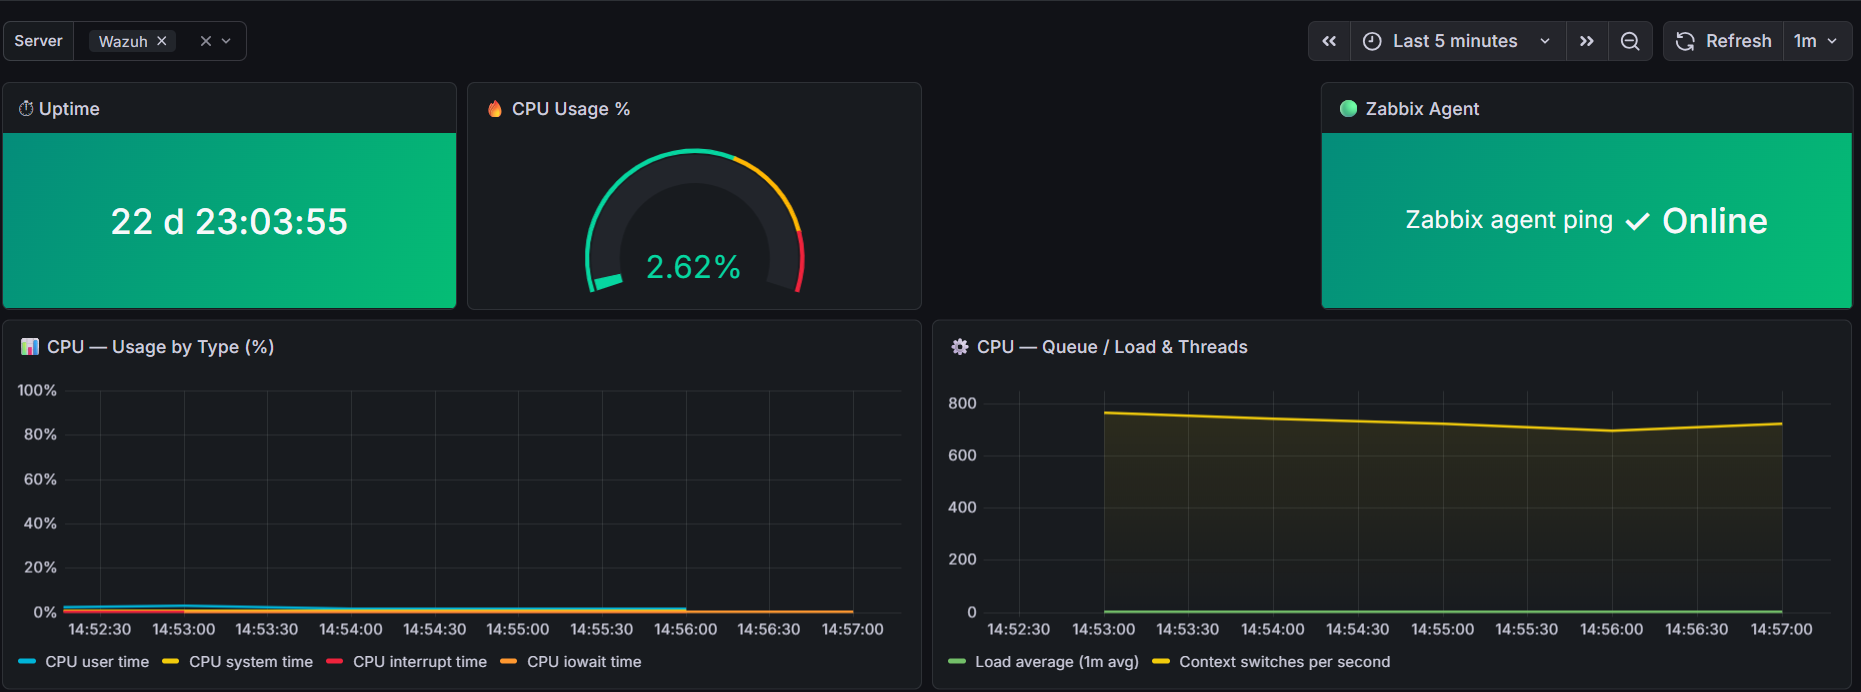
A single, unified dashboard for monitoring both Windows Server and Linux (RHEL/Rocky Linux) hosts side-by-side, without needing separate dashboards per operating system. Panels automatically resolve the correct metric for whichever host(s) you select — Windows or Linux — using multiple underlying queries per panel, so there's no duplication and no manual switching.
What this dashboard shows:
- Uptime —host uptime, regardless of OS
- CPU Usage — overall CPU utilization
- Zabbix Agent status — agent availability/ping
- CPU Usage by Type — breakdown of user / system (privileged) / interrupt / iowait (Linux) / DPC (Windows) time
- CPU Queue / Load & Threads — Windows queue length & thread count, Linux load average (1m), plus shared context-switches metric
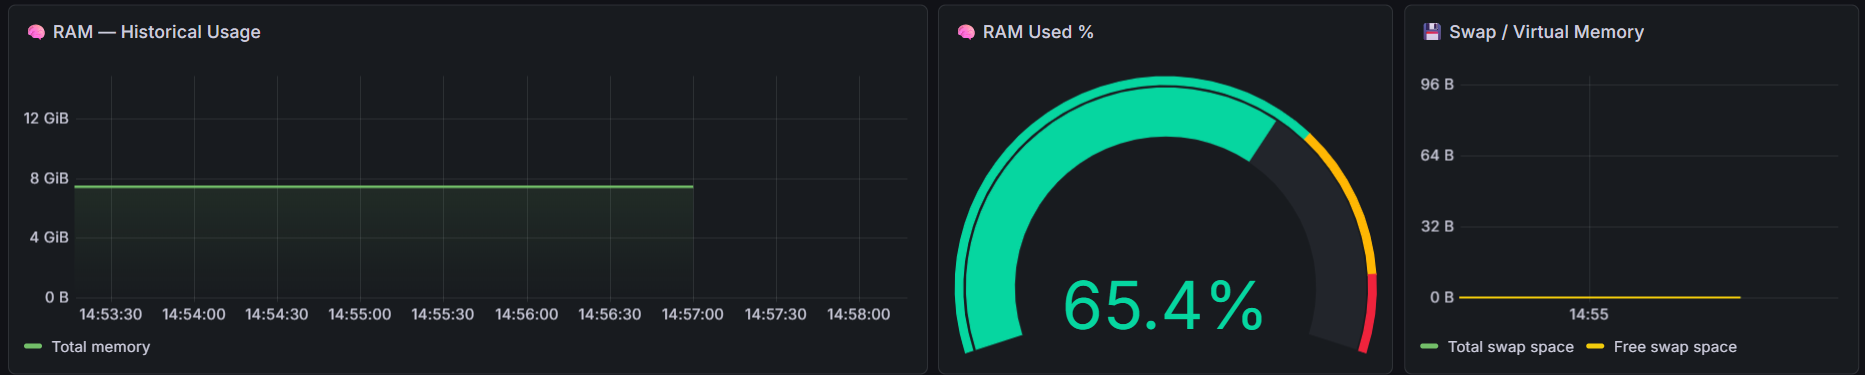
- RAM Historical Usage — total vs. used memory over time
- RAM Used %
- Swap / Virtual Memory — total and free swap
- Network Inbound/Outbound Traffic — bits received/sent per interface
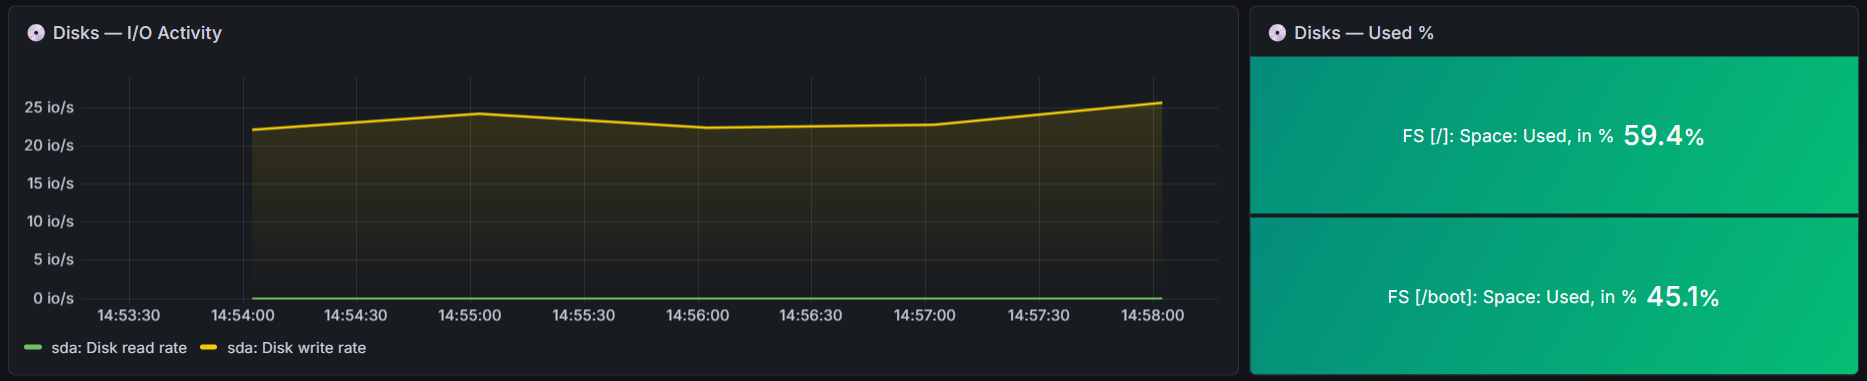
- Disks I/O Activity — read/write rate and utilization, auto-detecting Windows drive letters (
C:) or Linux device names (sda,nvme0n1, etc.) - Disks Used %
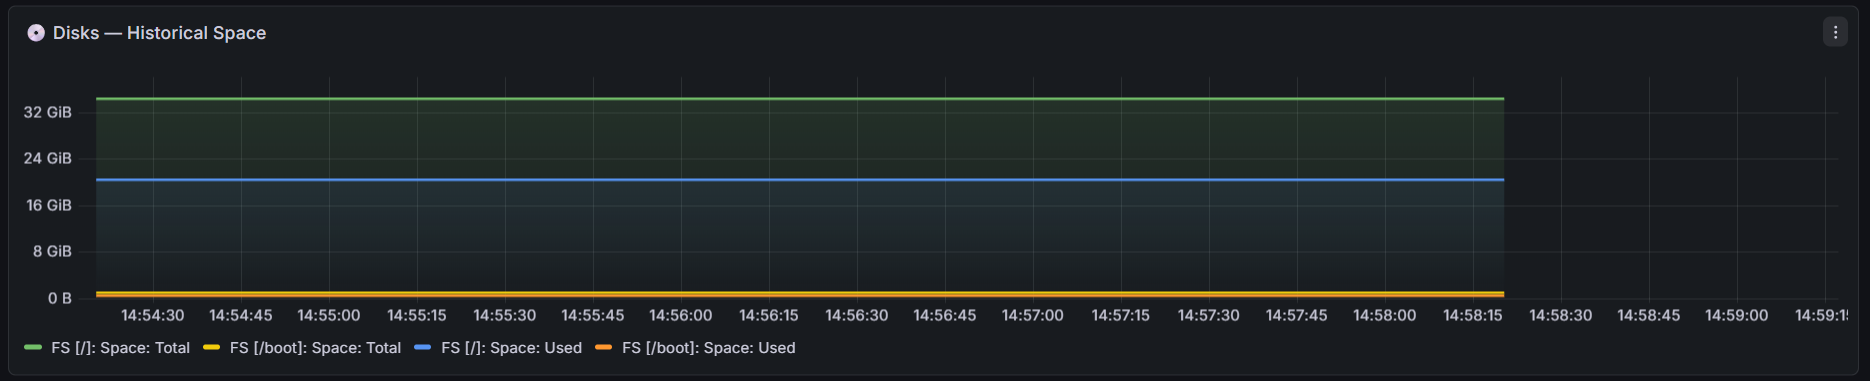
- Disks Historical Space — filesystem usage by mount point/drive
A single $host template variable (multi-select) lets you pick one or several hosts of either OS at once; panels that use OS-specific metric names include a query for each naming convention, so nothing needs to be duplicated per OS.
Data source
This dashboard uses the Zabbix data source plugin** (alexanderzobnin-zabbix-datasource) to query a Zabbix server directly — no Prometheus/InfluxDB relay needed.
- Zabbix Server:7.0 LTS (should also work on 6.x / 7.x with matching template item names)
- Host group: all monitored hosts (Windows and Linux) live in a single group (e.g.
Servers), which the dashboard's$hostvariable queries against - Templates used:
Windows by Zabbix agent(official Zabbix template)Linux by Zabbix agent(official Zabbix template)
How metrics are collected
Metrics are collected by the native Zabbix Agent 2, installed on each monitored host and linked to the corresponding official template in Zabbix. No custom scripts or collectd-style plugins are required.
Attach the Windows by Zabbix agent template to the host in Zabbix. Attach the Linux by Zabbix agent template to the host in Zabbix.
Some metric names differ slightly between the two OS templates (e.g. Uptime on Windows vs. System uptime on Linux, or drive-letter vs. device-name disk naming). Panels affected by this include an additional query per naming convention so both resolve correctly in the same panel.
Requirements
- Zabbix Server 7.0 LTS (or compatible)
- Grafana with the Zabbix data source plugin installed and configured
- Zabbix Agent 2 installed on monitored hosts.
- Link the official
Windows by Zabbix agent/Linux by Zabbix agenttemplates in the Zabbix Server on each machine you add. - All monitored hosts must be placed in a shared host group in Zabbix Server called "Servers"
Data source config
Collector config:
Upload an updated version of an exported dashboard.json file from Grafana
| Revision | Description | Created | |
|---|---|---|---|
| Download |

Linux Server

Monitor Linux with Grafana. Easily monitor your Linux deployment with Grafana Cloud's out-of-the-box monitoring solution.
Learn more