
Open WebUI
Usage, cost, and quality metrics for Open WebUI — users, chats, tokens, spend by model and by user, and per-model satisfaction. Requires the Open WebUI Prometheus exporter (polls the REST API, no database access).
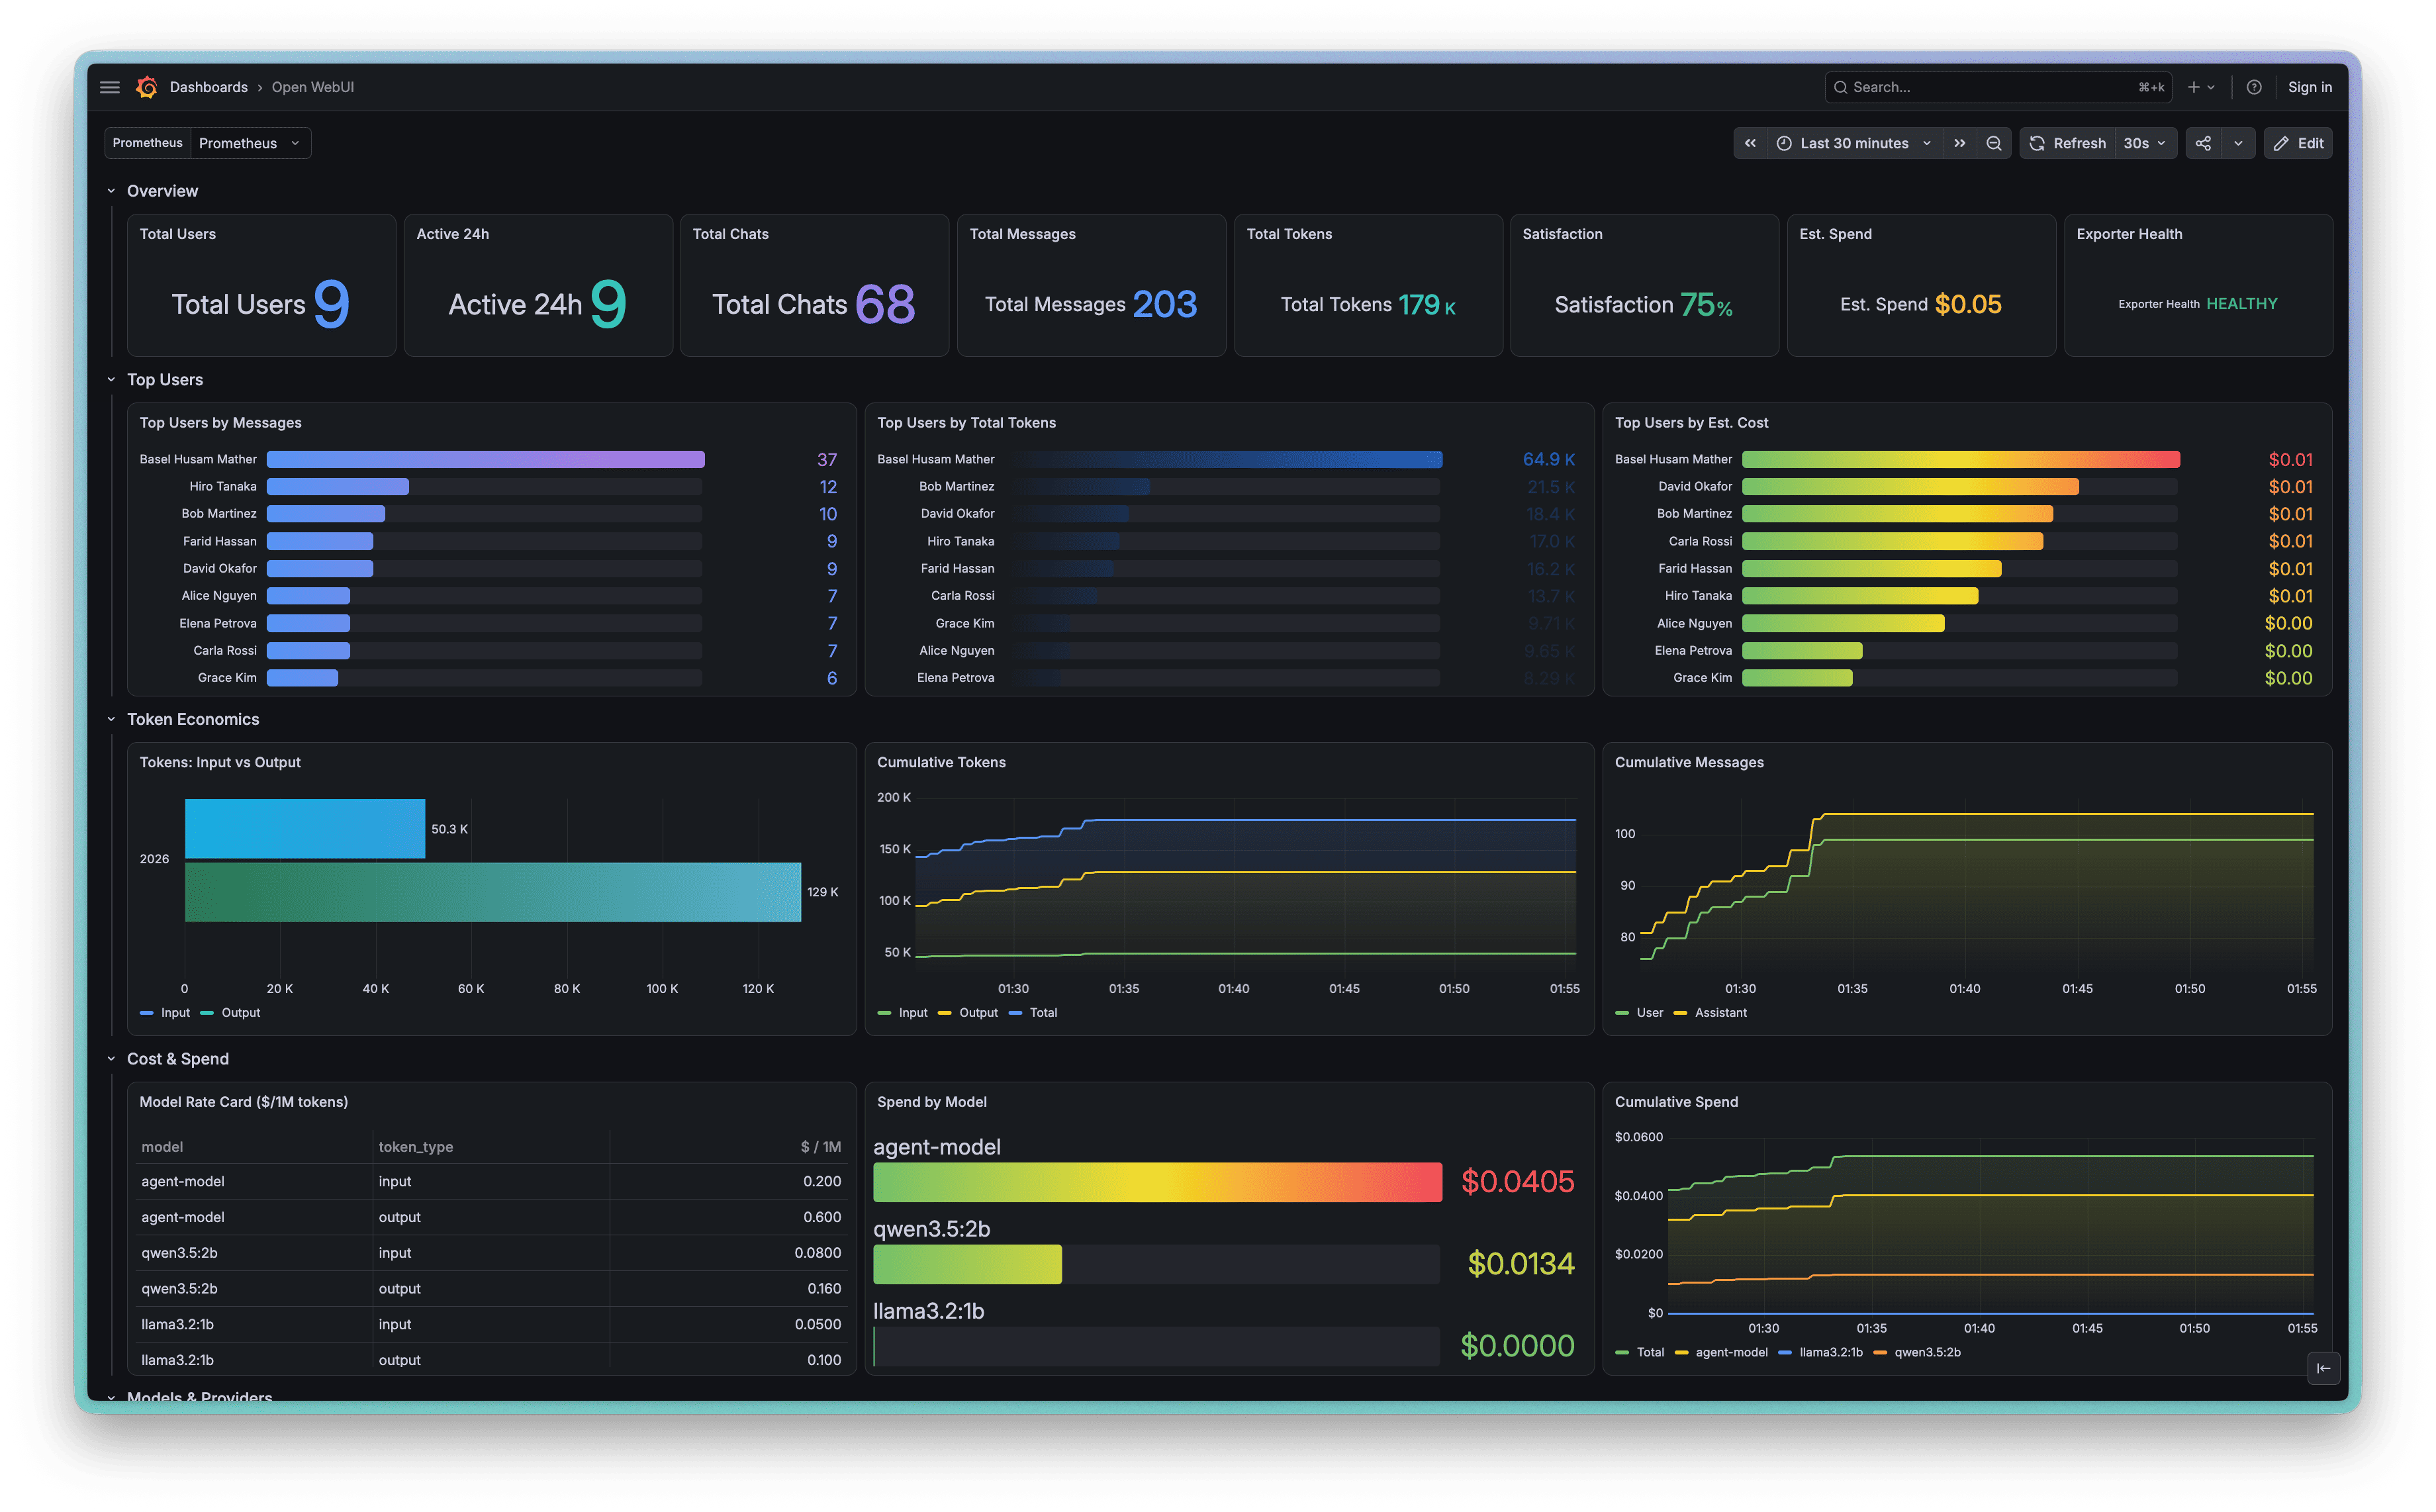
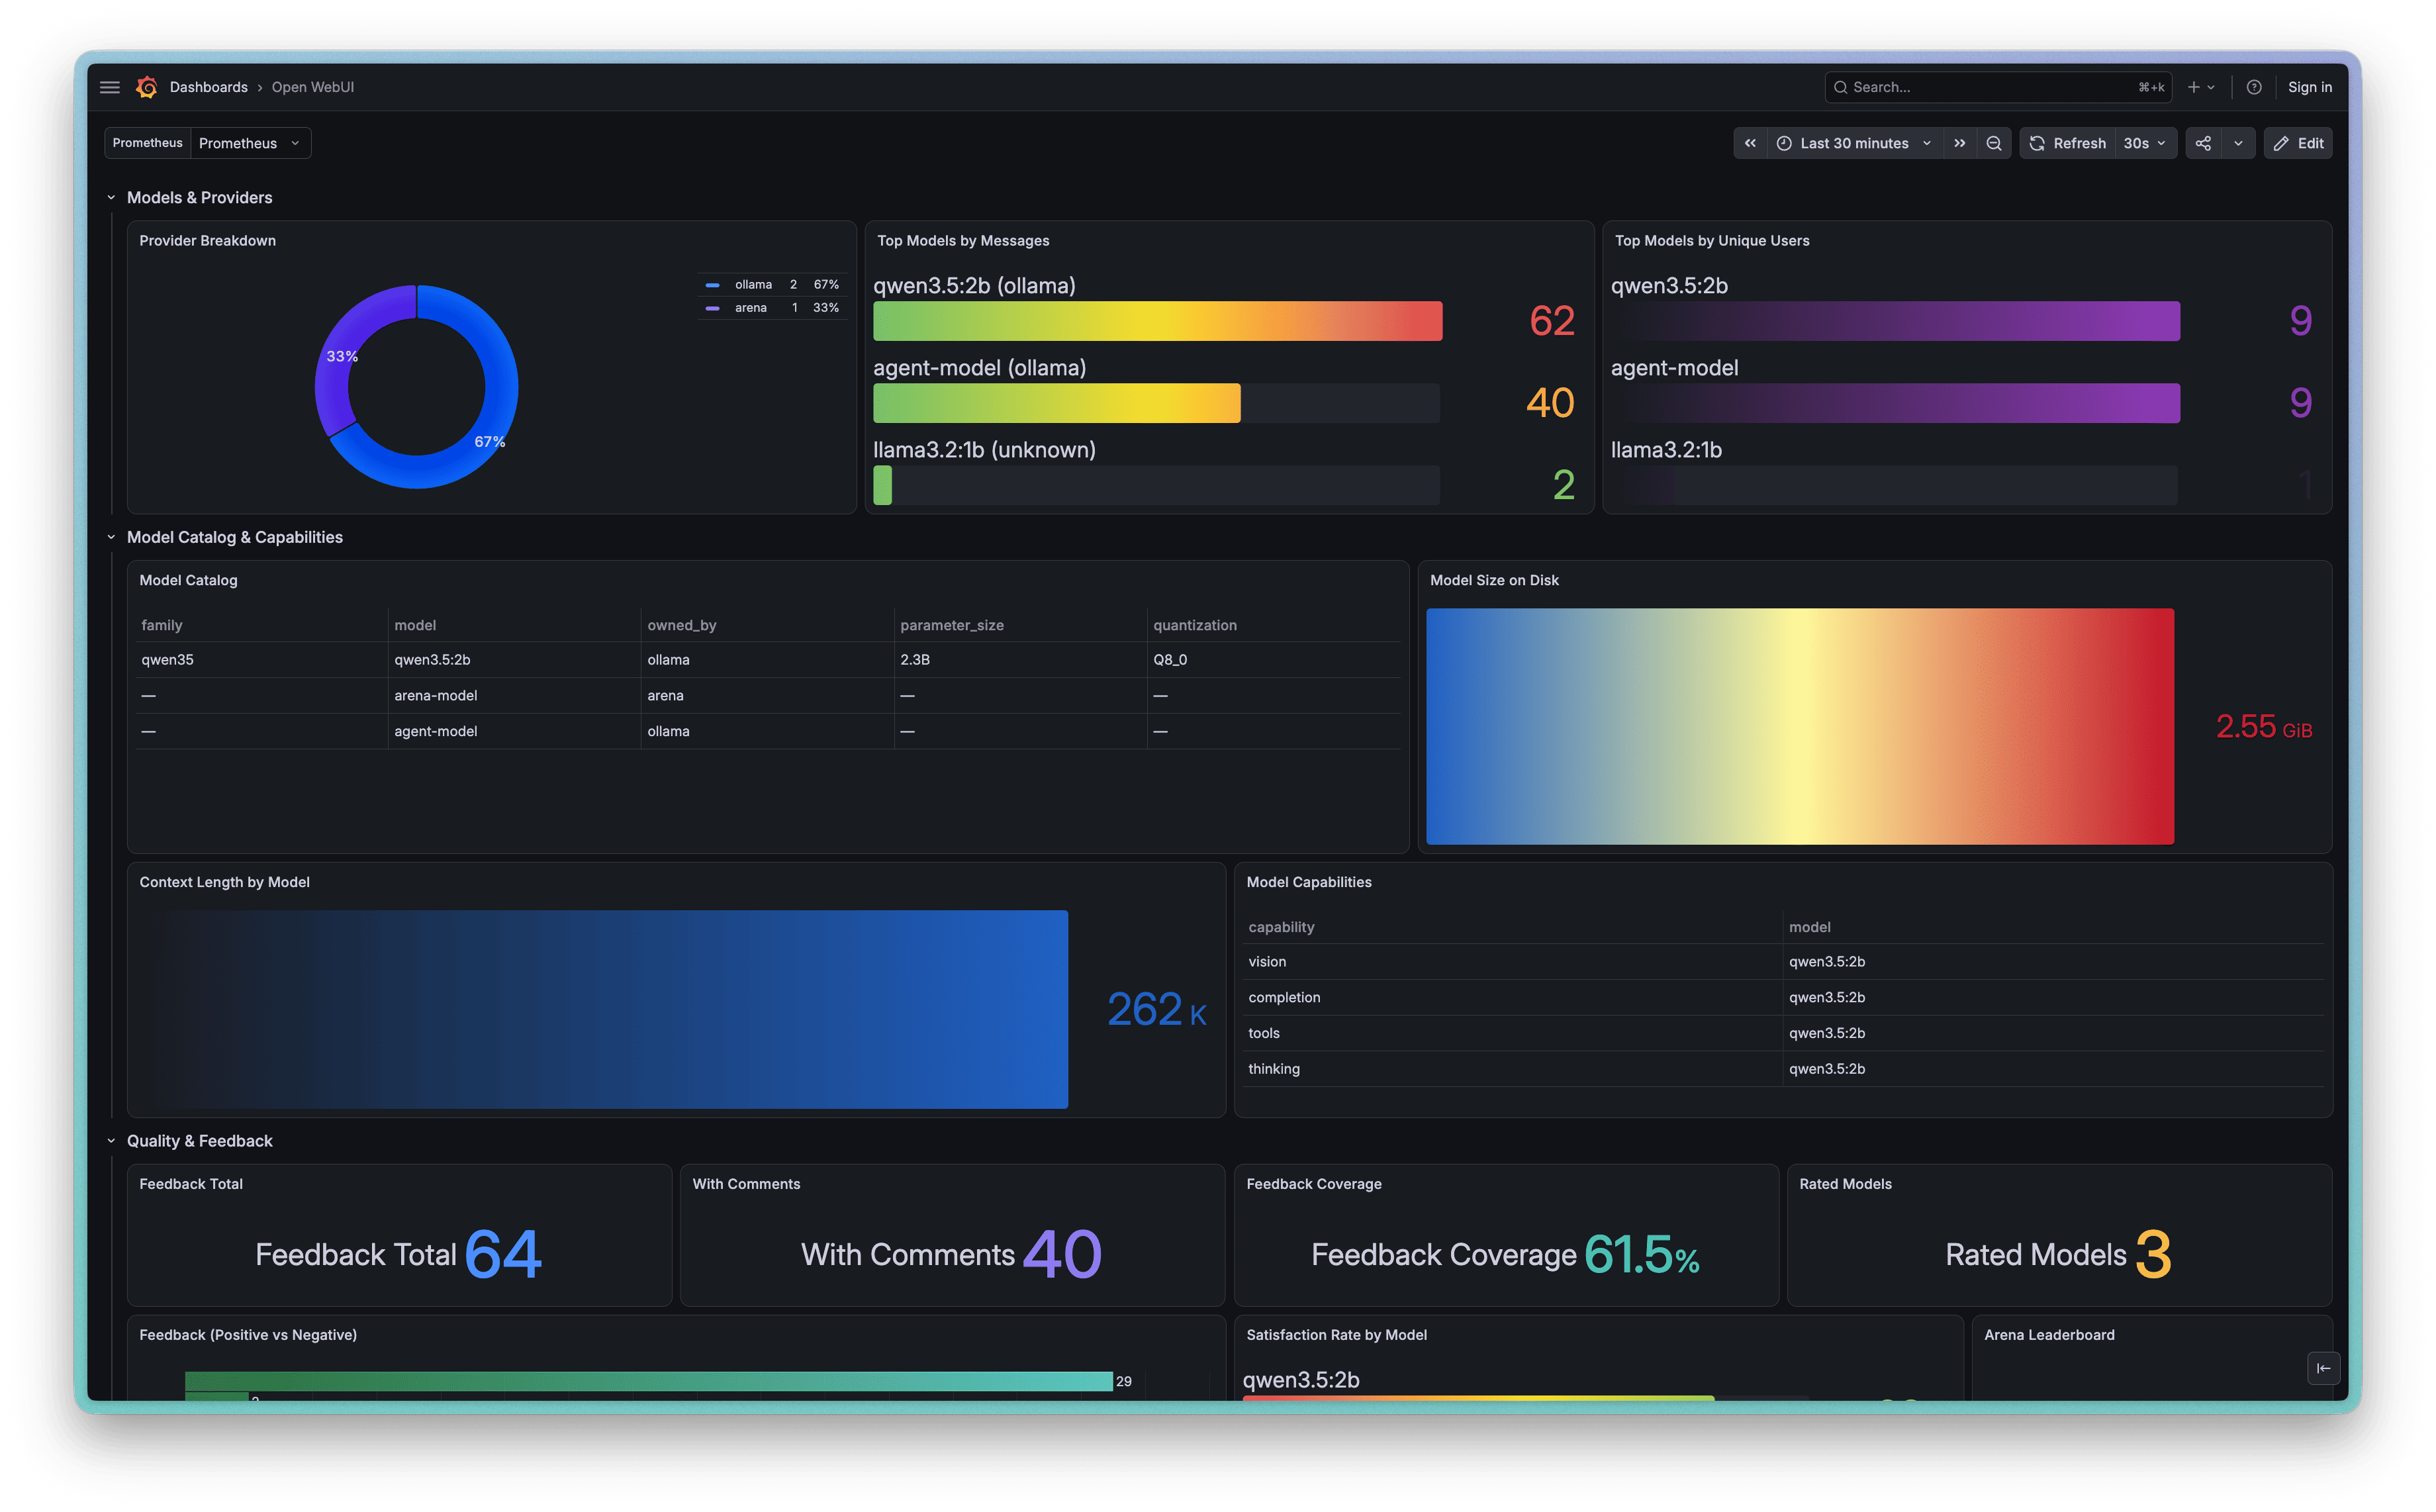
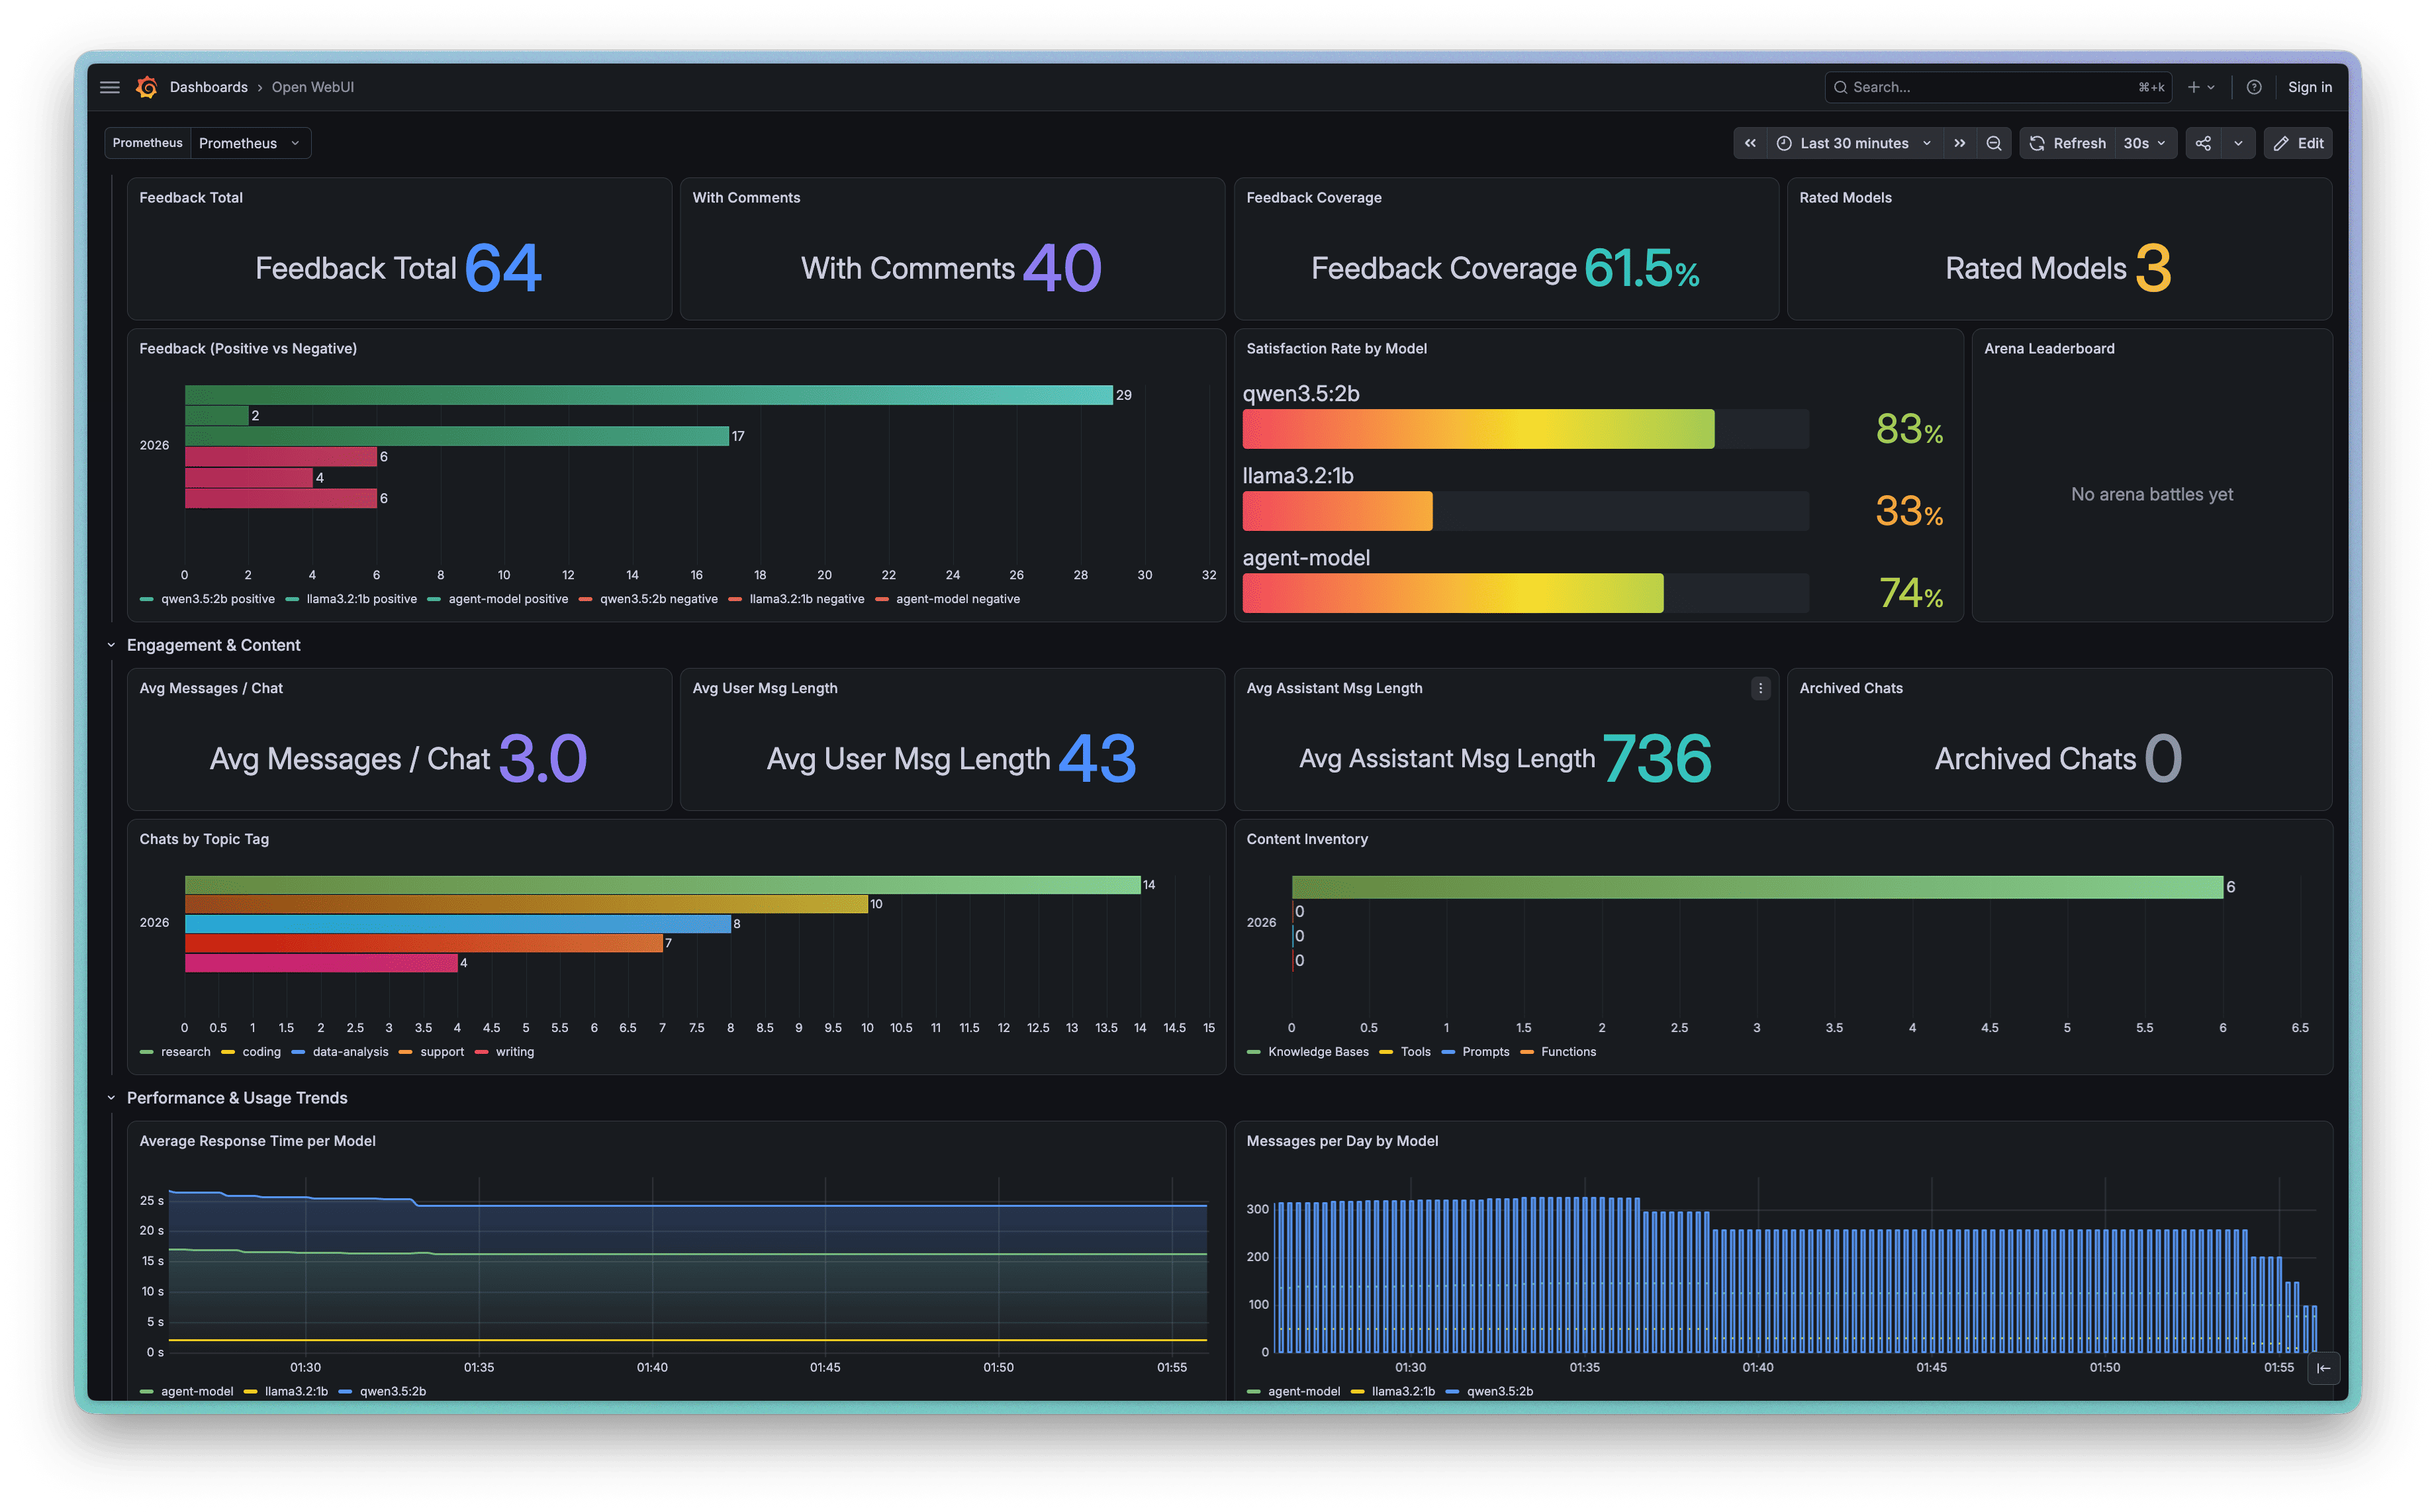
Usage, cost, and quality metrics for Open WebUI — users, chats, tokens, spend by model and by user, and per-model satisfaction.
Documentation & screenshots · GitHub
Requires the exporter
This dashboard reads metrics from the Open WebUI Prometheus exporter, which polls Open WebUI's REST API — no database credentials needed, so it works with either the SQLite or Postgres backend.
| Registry | Image |
|---|---|
| GHCR | ghcr.io/baselhusam/open-webui-exporter:latest |
| Docker Hub | docker.io/baselhusam/open-webui-exporter:latest |
Setup
- Create an admin API key in Open WebUI (Settings → Account → API Keys).
- Run the exporter against your instance; it serves
/metricson port9090. - Scrape it with Prometheus.
- Import this dashboard and pick that Prometheus datasource.
A batteries-included Compose stack (exporter + Prometheus + Grafana, dashboard pre-provisioned) is in the repo.
Panels
Hero KPIs (users, chats, messages, tokens, satisfaction, estimated spend, exporter health) · top users by messages/tokens/cost · token economics · models and providers · model catalog and capabilities · quality and feedback · engagement and content · performance trends · exporter self-health.
A note on cost
Open WebUI reports token counts but never price, so spend is reconstructed from a rate table shipping with list prices for major providers, overridable via CSV or JSON without touching code. Treat it as an estimate, not a bill.
Data source config
Collector config:
Upload an updated version of an exported dashboard.json file from Grafana
| Revision | Description | Created | |
|---|---|---|---|
| Download |