
Classic vs Native Histograms: A Complete Guide
An educational reference showing how classic and native Prometheus histograms work, how to query each, and how to migrate between them. Live examples use demo_api_request_duration_seconds from the promlabs demo environment.
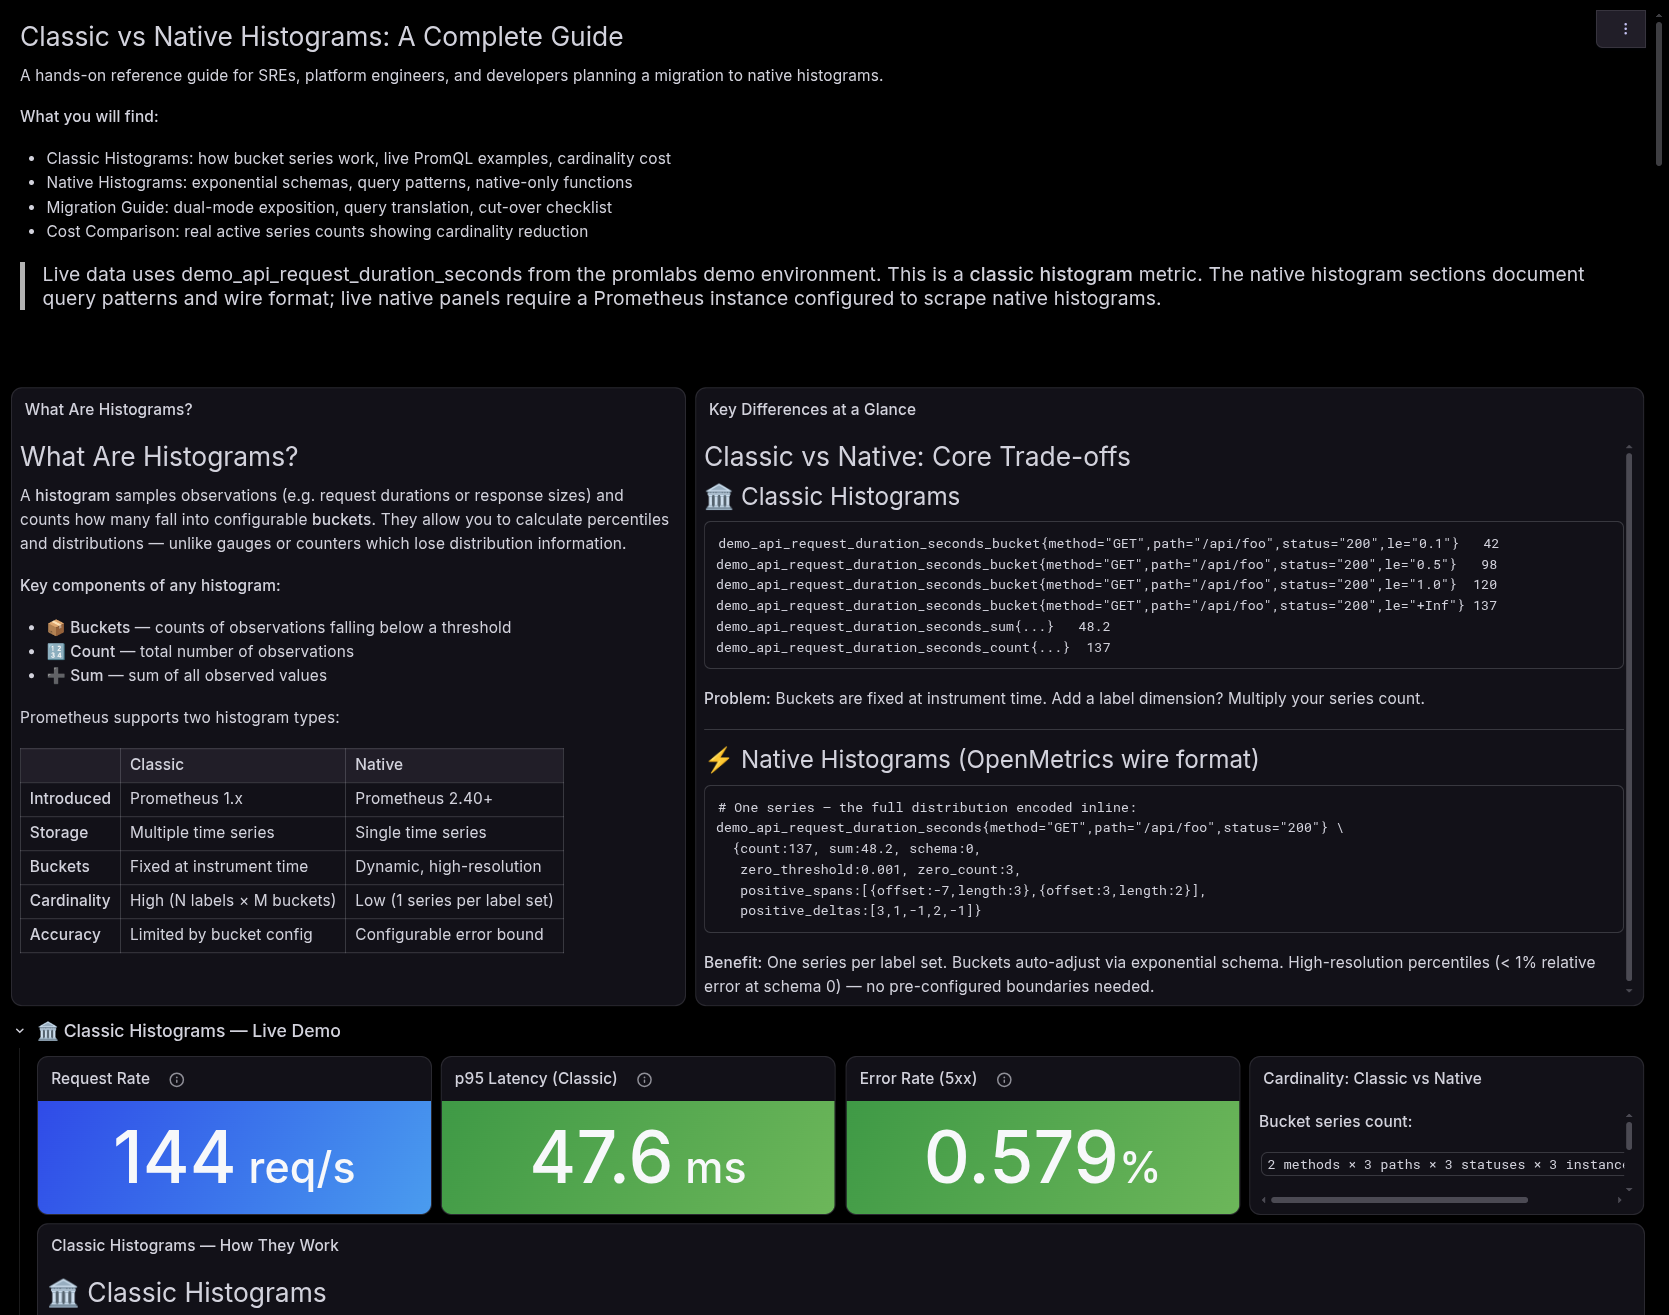
Classic vs Native Histograms: A Complete Guide
An educational reference dashboard for understanding, querying, and migrating
between classic and native Prometheus histograms. Live examples use the
demo_api_request_duration_seconds metric from the promlabs demo environment.
What's inside
- Conceptual overview — side-by-side comparison of how classic and native histograms work, including exposition formats and key differences at a glance
- Classic histogram panels — latency percentiles (p50/p95/p99), per-path cardinality demo, fraction-under-threshold queries, and a PromQL cheat sheet
- Native histogram panels — bucket schemas, setup & configuration guide, PromQL cheat sheet, and ecosystem/tool compatibility notes
- Cardinality & billing analysis — live series counts (classic vs native), cardinality multiplier, sample-type breakdown (float vs histogram), and a billing impact calculator at scale
- Step-by-step migration guide — dual-mode exposition → dashboard/alert updates → cut-over and clean-up, with silent-failure gotchas to watch for
Requirements
- Prometheus with native histogram support (v2.40+) or a compatible remote write backend
- To use the live examples as-is, connectivity to the promlabs demo environment is required; substitute your own histogram metric for a self-contained setup
Tags
prometheus histograms native-histograms cardinality migration
education promql
Data source config
Collector type:
Collector plugins:
Collector config:
Revisions
Upload an updated version of an exported dashboard.json file from Grafana
| Revision | Description | Created | |
|---|---|---|---|
| Download |