
AWS RDS — Advanced SRE Debug Dashboard (CloudWatch)
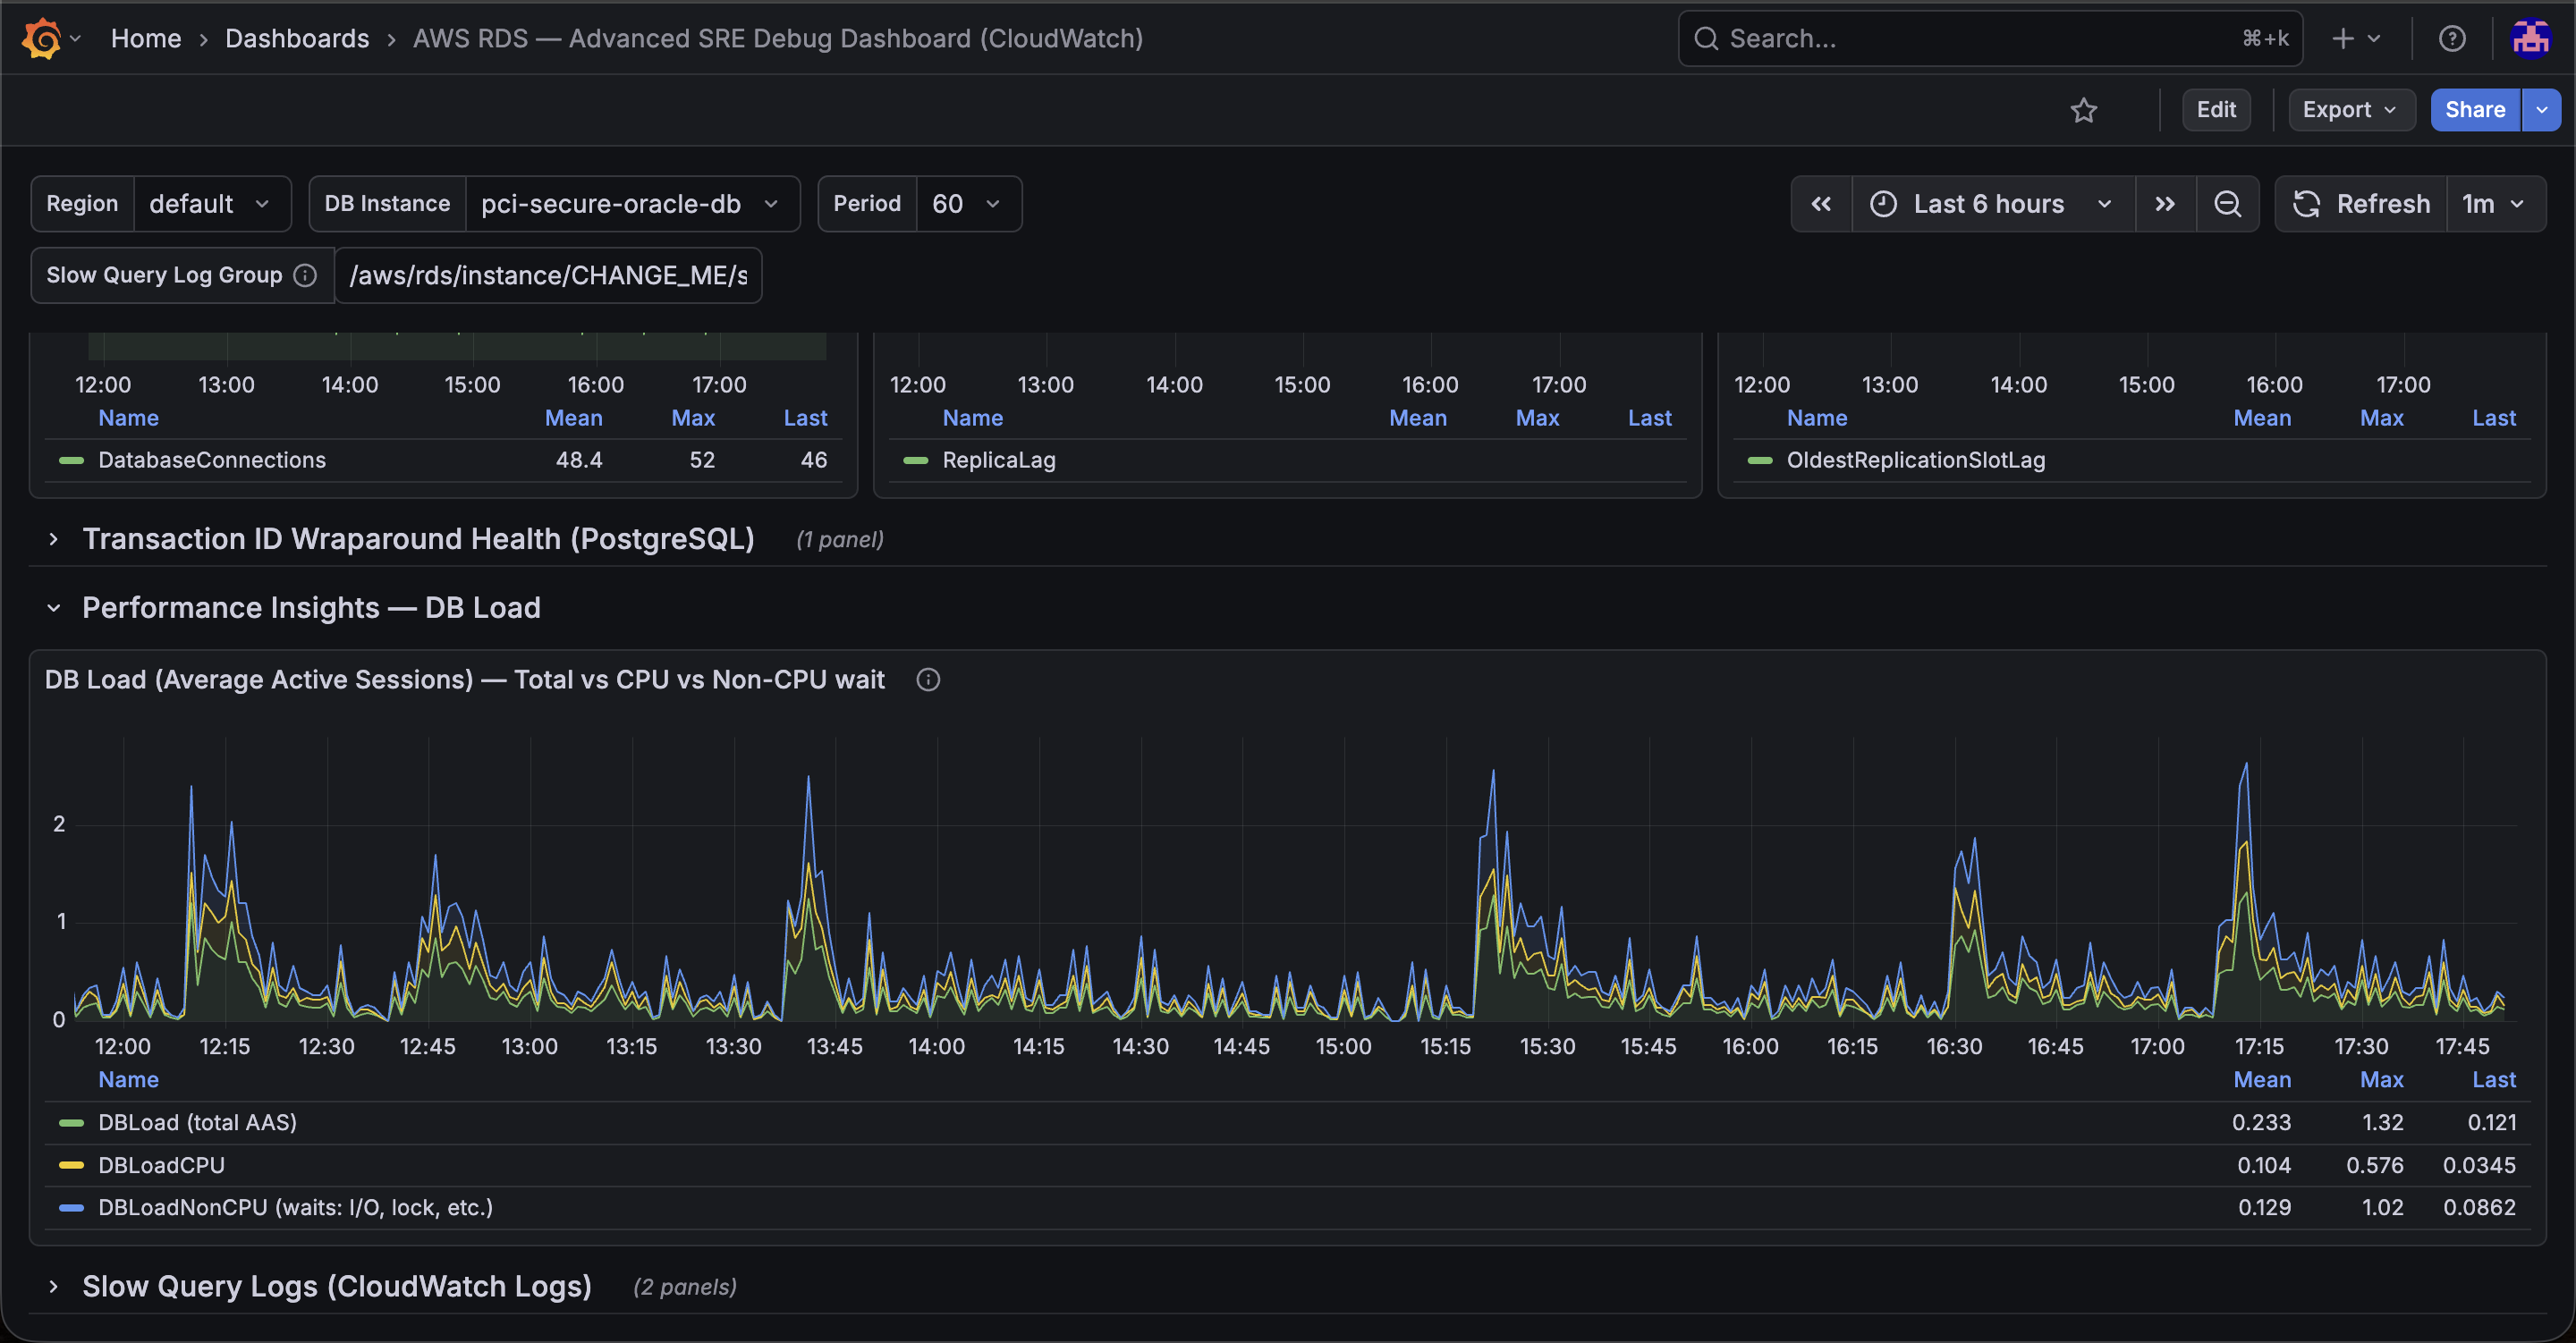
Production-ready SRE dashboard for deeply debugging AWS RDS instances using CloudWatch metrics. Tracks CPU, memory utilization, storage, I/O performance, database connections, and replication lag.
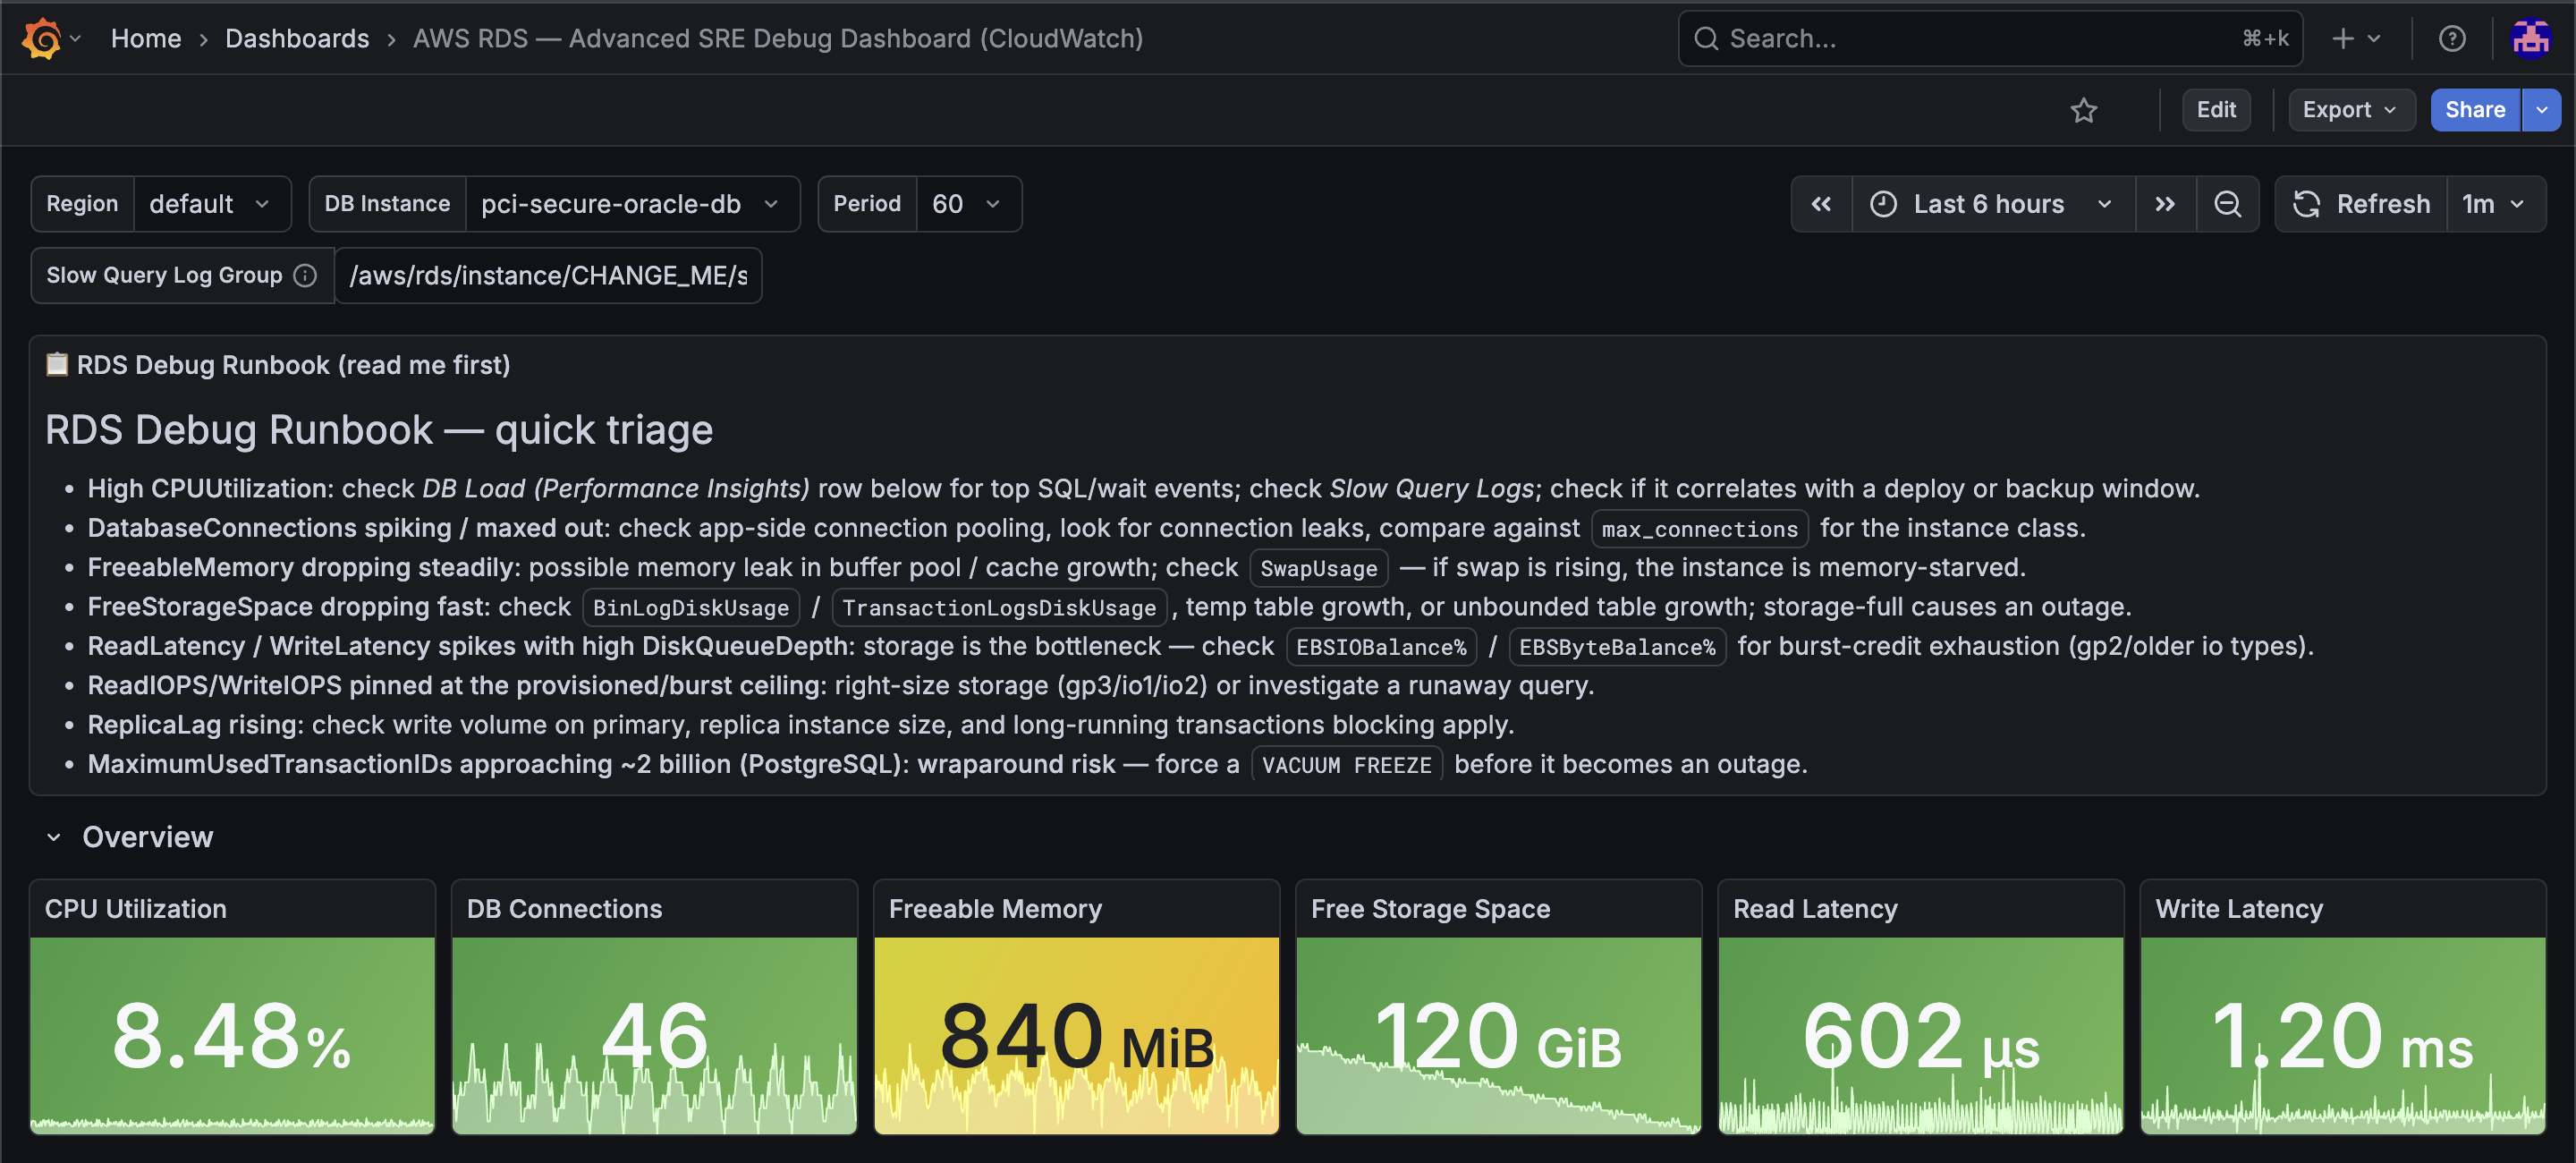
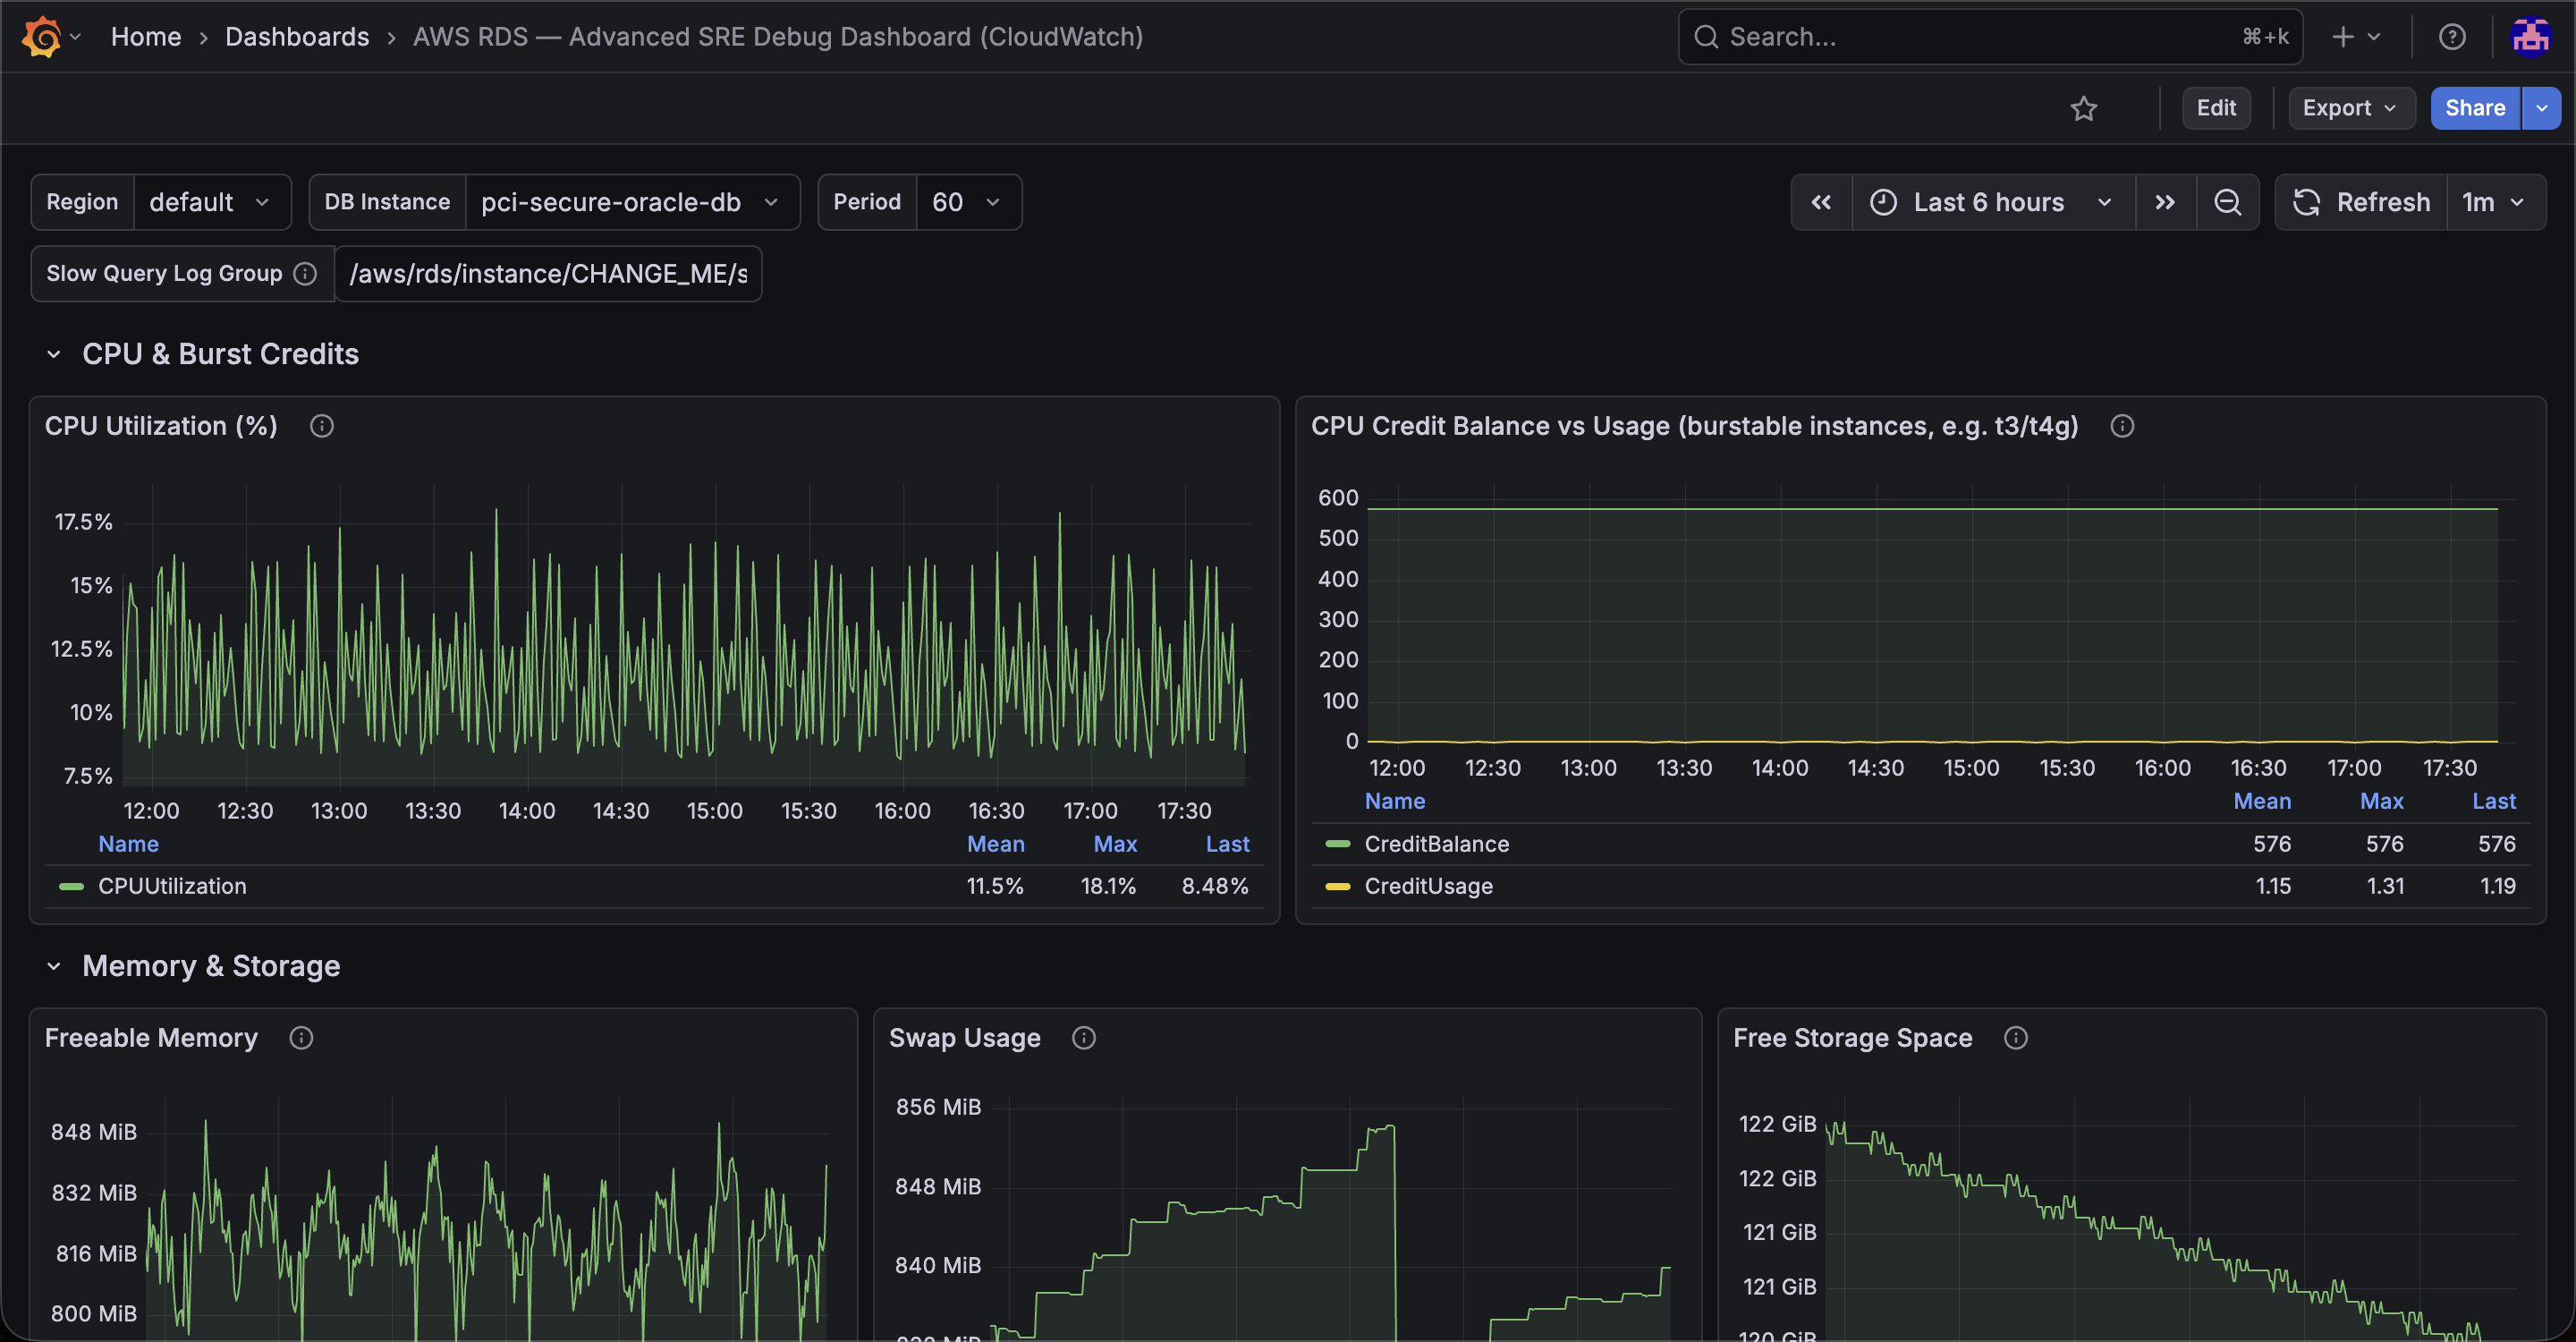
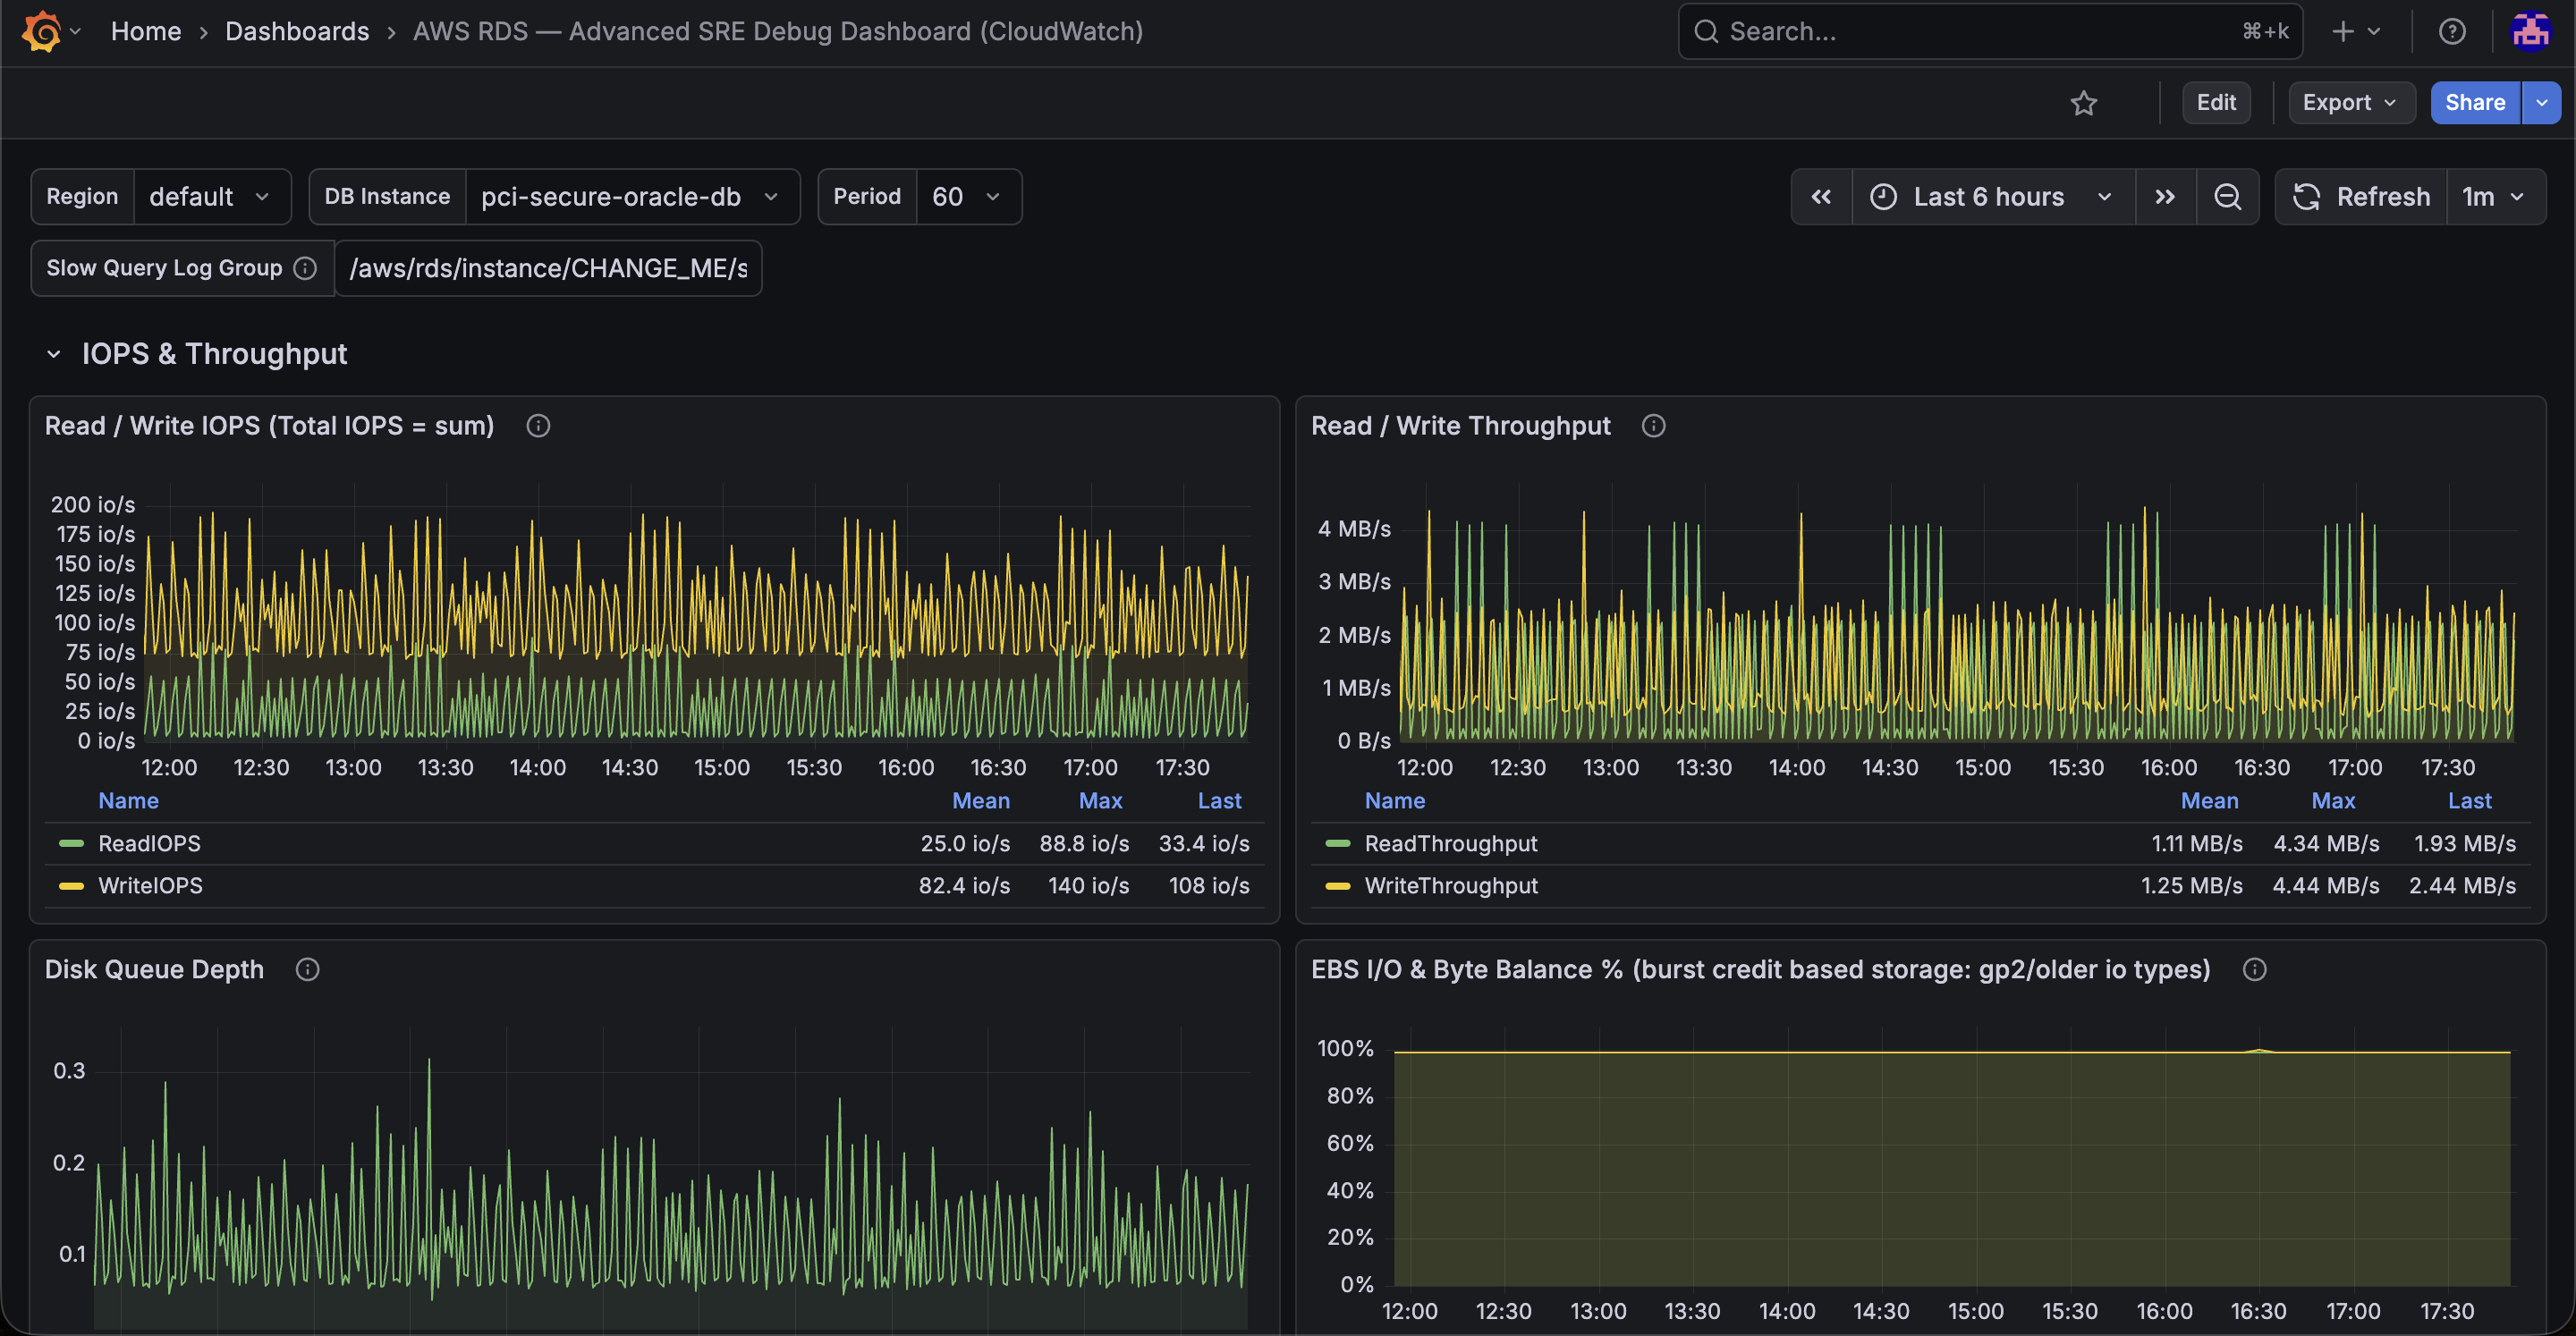
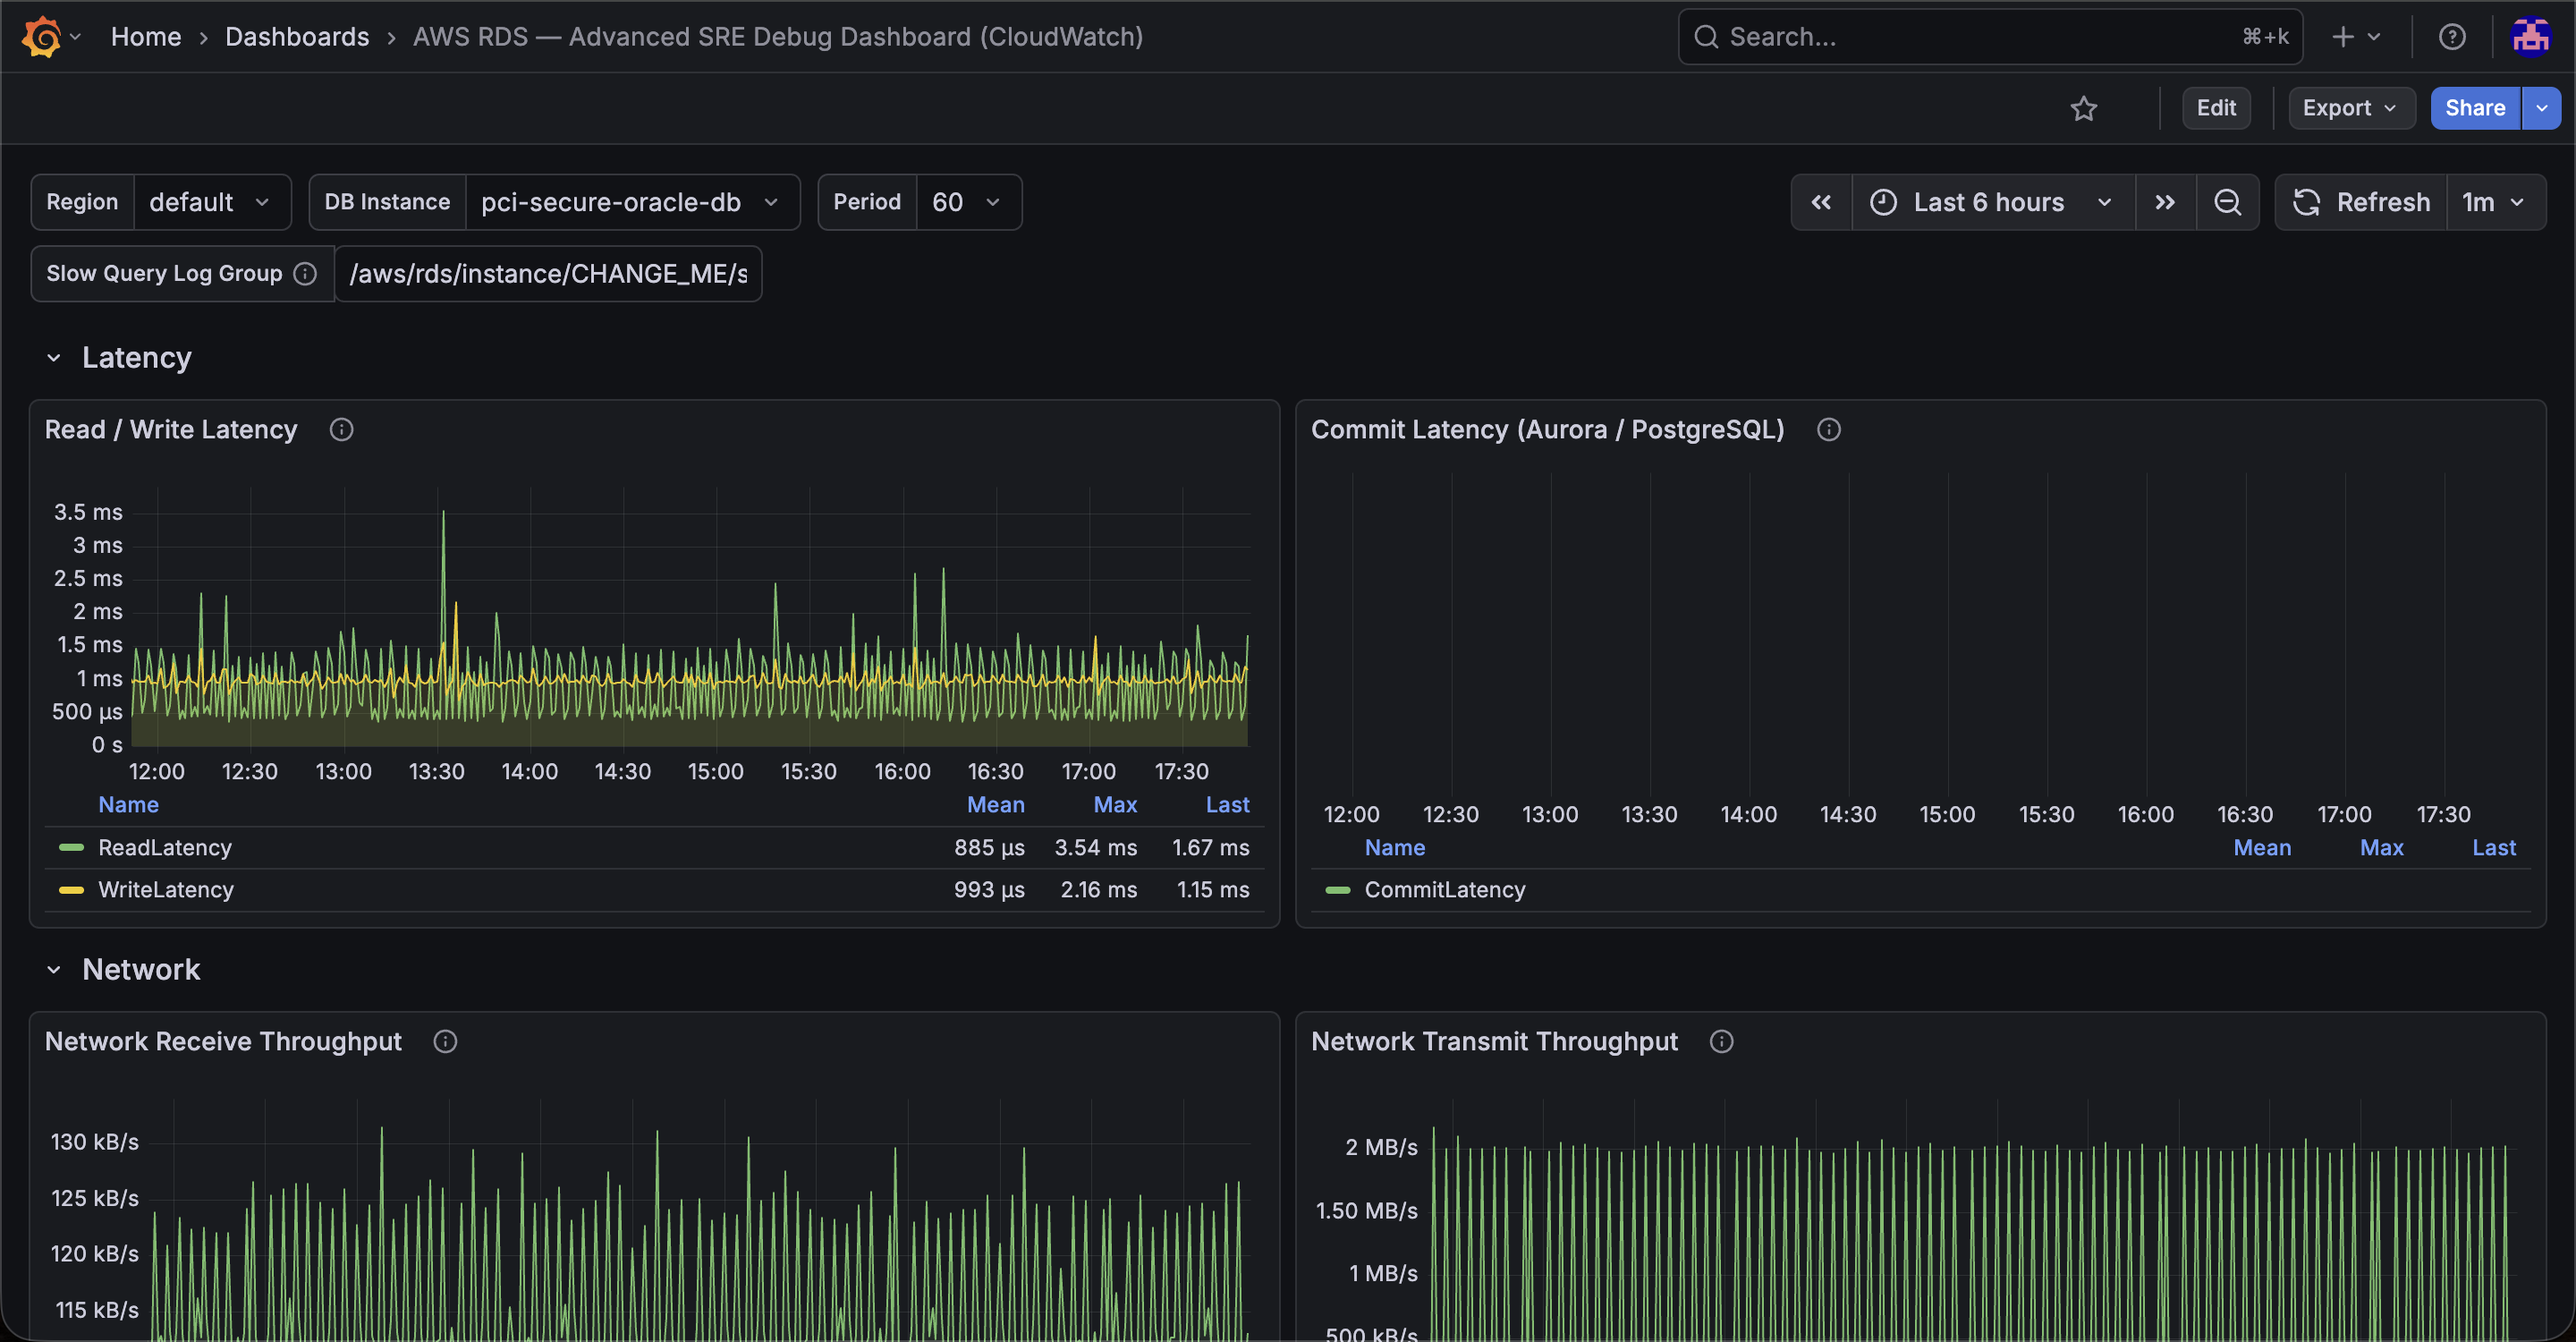
Overview
An advanced, production-grade SRE debugging dashboard for monitoring AWS RDS instances. It aggregates crucial health and performance vectors into a single view to quickly identify bottlenecks, resource exhaustion, or database performance degradation.
Features
- Resource Utilization: Real-time visibility into CPU Utilization, Freeable Memory, and Free Storage Space.
- I/O Performance: Detailed breakdown of Read/Write IOPS, Read/Write Latency, and Throughput.
- Database Health: Active Database Connections and Replication Lag (for read replicas).
- Network Traffic: Inbound and outbound network throughput metrics.
Prerequisites & Setup
- Data Source: Make sure you have the official CloudWatch data source configured in your Grafana instance.
- IAM Permissions: The IAM role/user used by Grafana must have the
cloudwatch:GetMetricDataandcloudwatch:ListMetricspermissions for theAWS/RDSnamespace. - Variables: Once imported, select your target AWS
RegionandDBInstanceIdentifierfrom the template dropdowns at the top of the dashboard.
Data source config
Collector type:
Collector plugins:
Collector config:
Revisions
Upload an updated version of an exported dashboard.json file from Grafana
| Revision | Description | Created | |
|---|---|---|---|
| Download |

AWS

Easily visualize and alert on more than 60 Amazon Web Services (AWS) resources using the fully managed Grafana Cloud platform.
Learn more