
Nvidia GPU Overview
Compare all GPUs of one node side by side: current state, utilization, thermals, throttling and health per GPU. Companion to the Nvidia GPU Metrics dashboard (single-GPU detail, click a GPU in the table to drill down). Shows physical GPUs as reported by nvidia-smi, MIG instances are not broken out: rows are the parent GPUs, whose utilization is not reported in MIG mode and shows n/a. Based on the prometheus metrics from github.com/utkuozdemir/nvidia_gpu_exporter
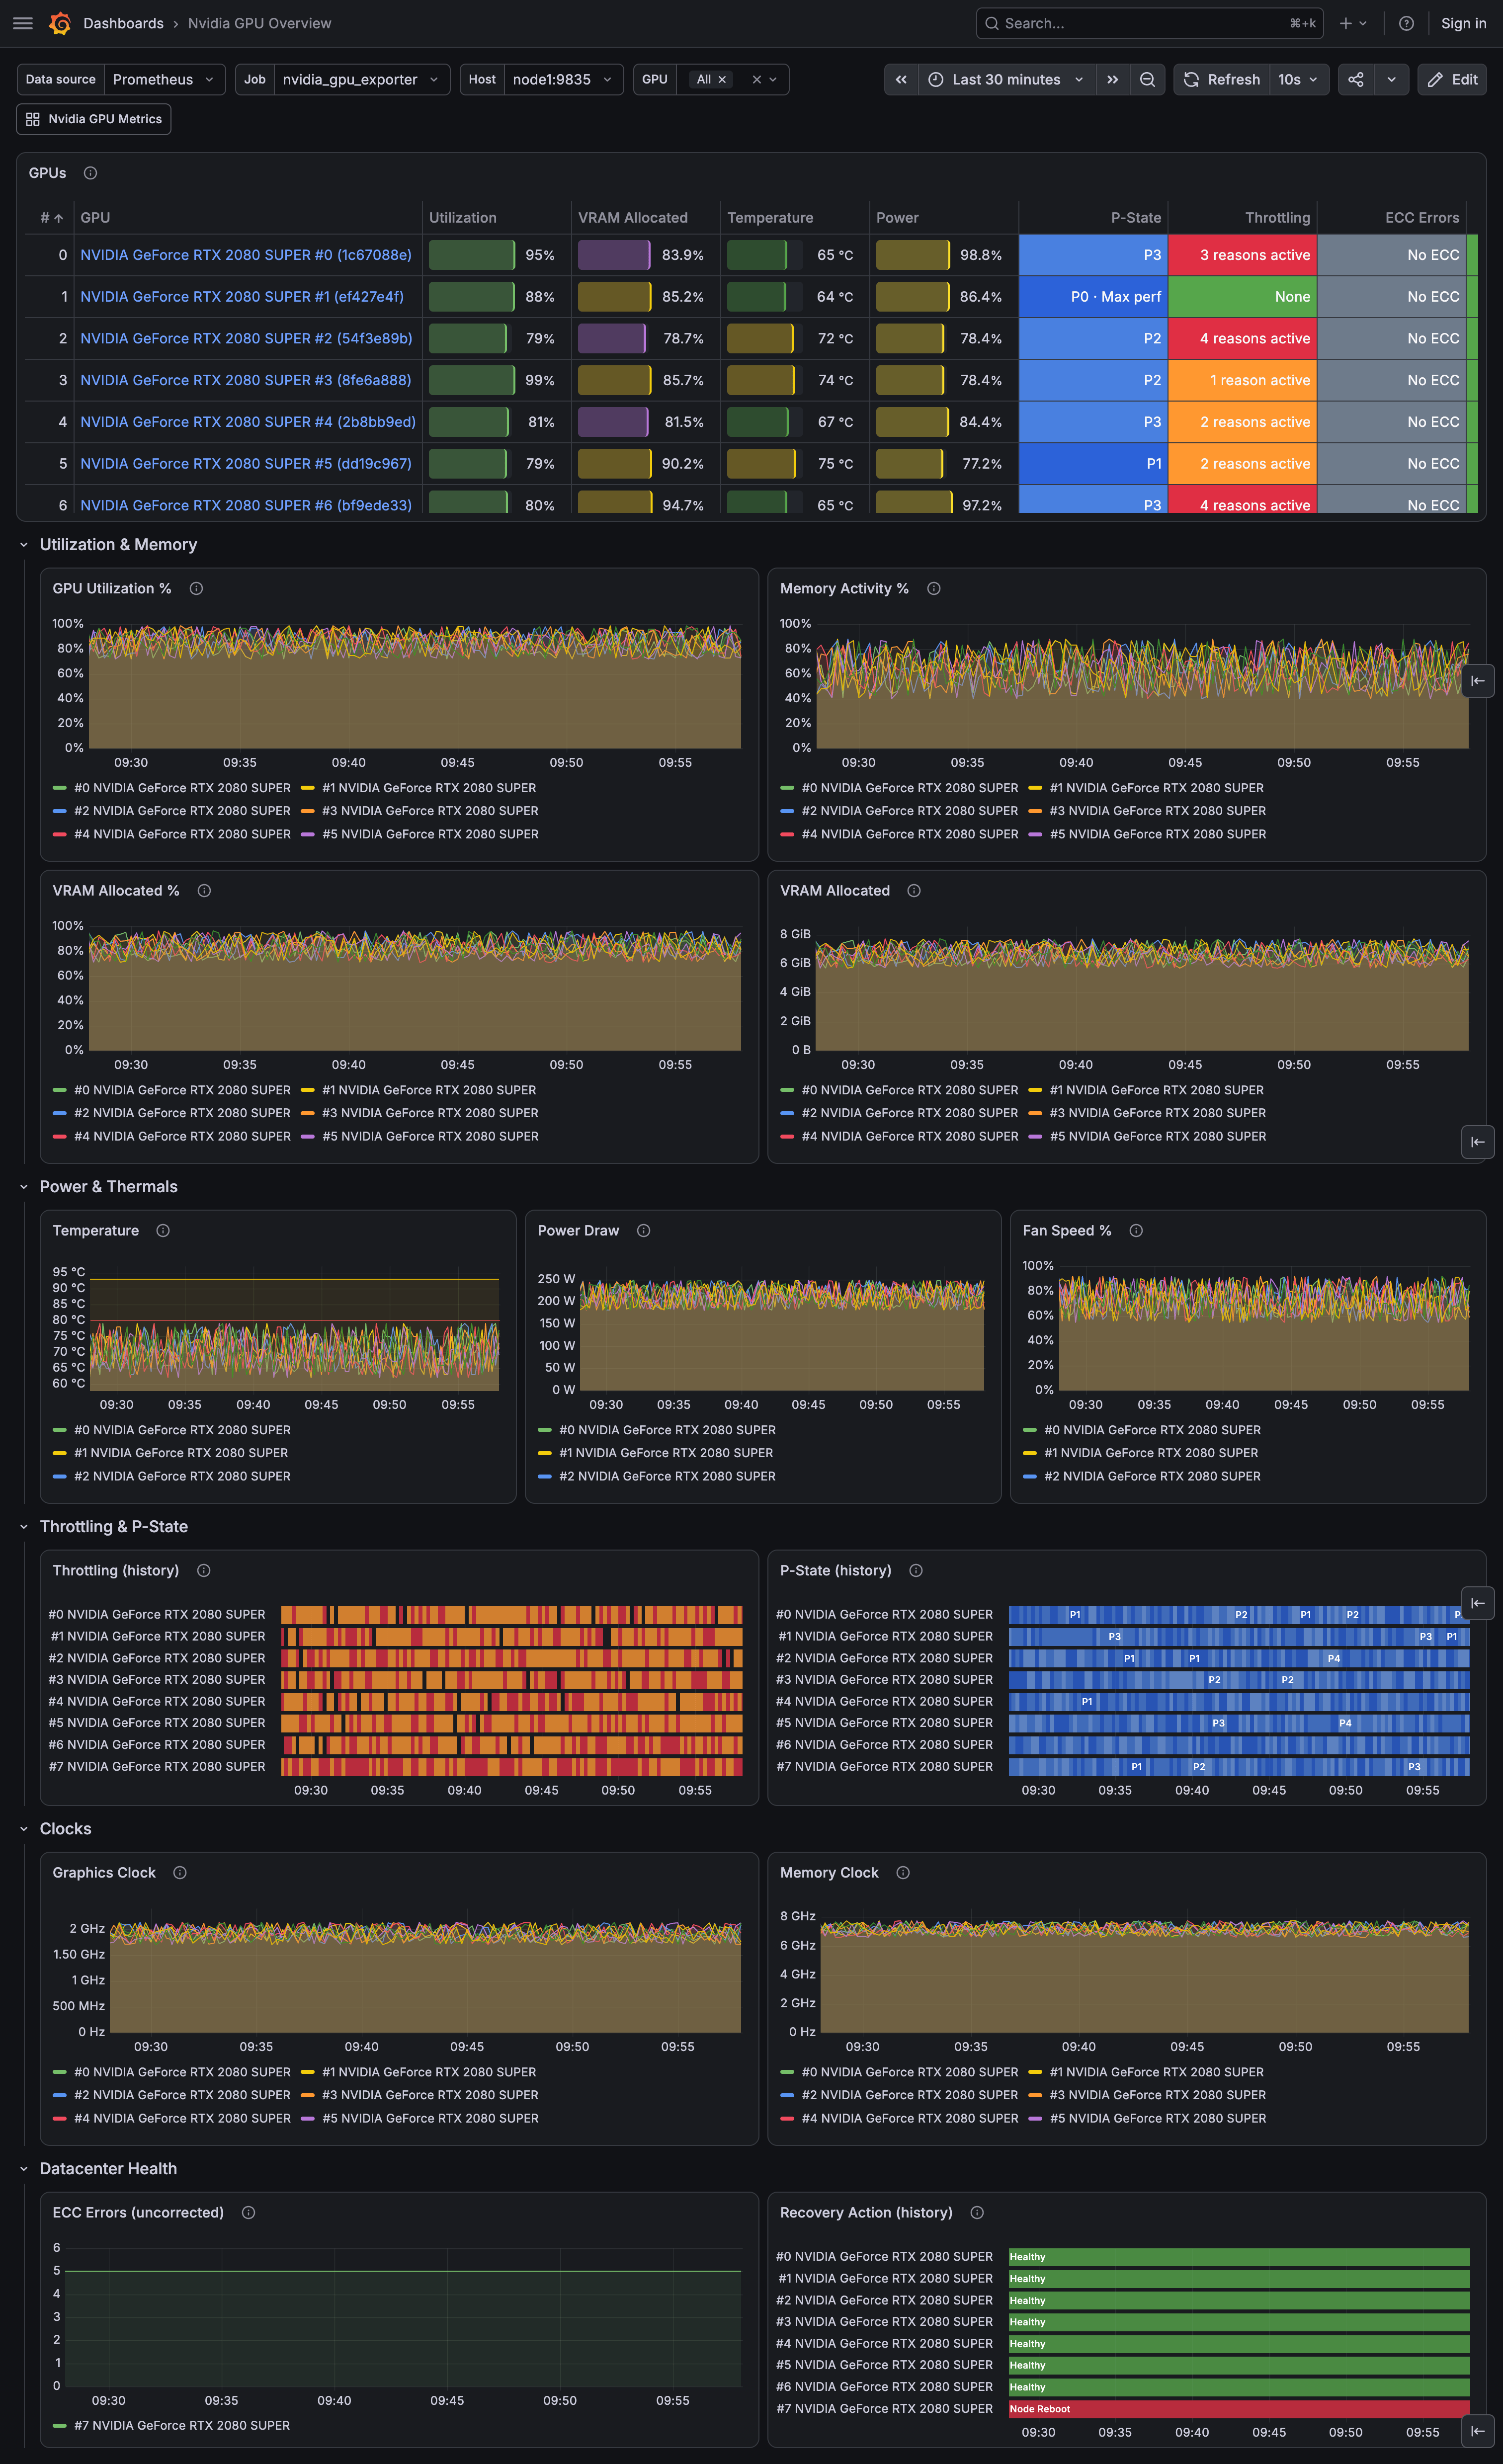
Compares all GPUs of a node side by side, using metrics from utkuozdemir/nvidia_gpu_exporter.
The table at the top shows utilization, VRAM, temperature, power, P-state, throttling, and ECC errors per GPU. Each row links to the Nvidia GPU Metrics dashboard for that GPU, so import both dashboards to make the drill-down work. Below the table there are per-GPU time series for utilization, memory, power, thermals, and clocks, plus throttling and P-state history and datacenter health.
Use the GPU dropdown to narrow the comparison to a subset, or keep it on All. Metrics a GPU does not report show as n/a rather than a healthy-looking zero.
In MIG mode the exporter reports parent physical GPUs only, so this dashboard compares physical GPUs.
Requires Grafana 11.2 or newer.
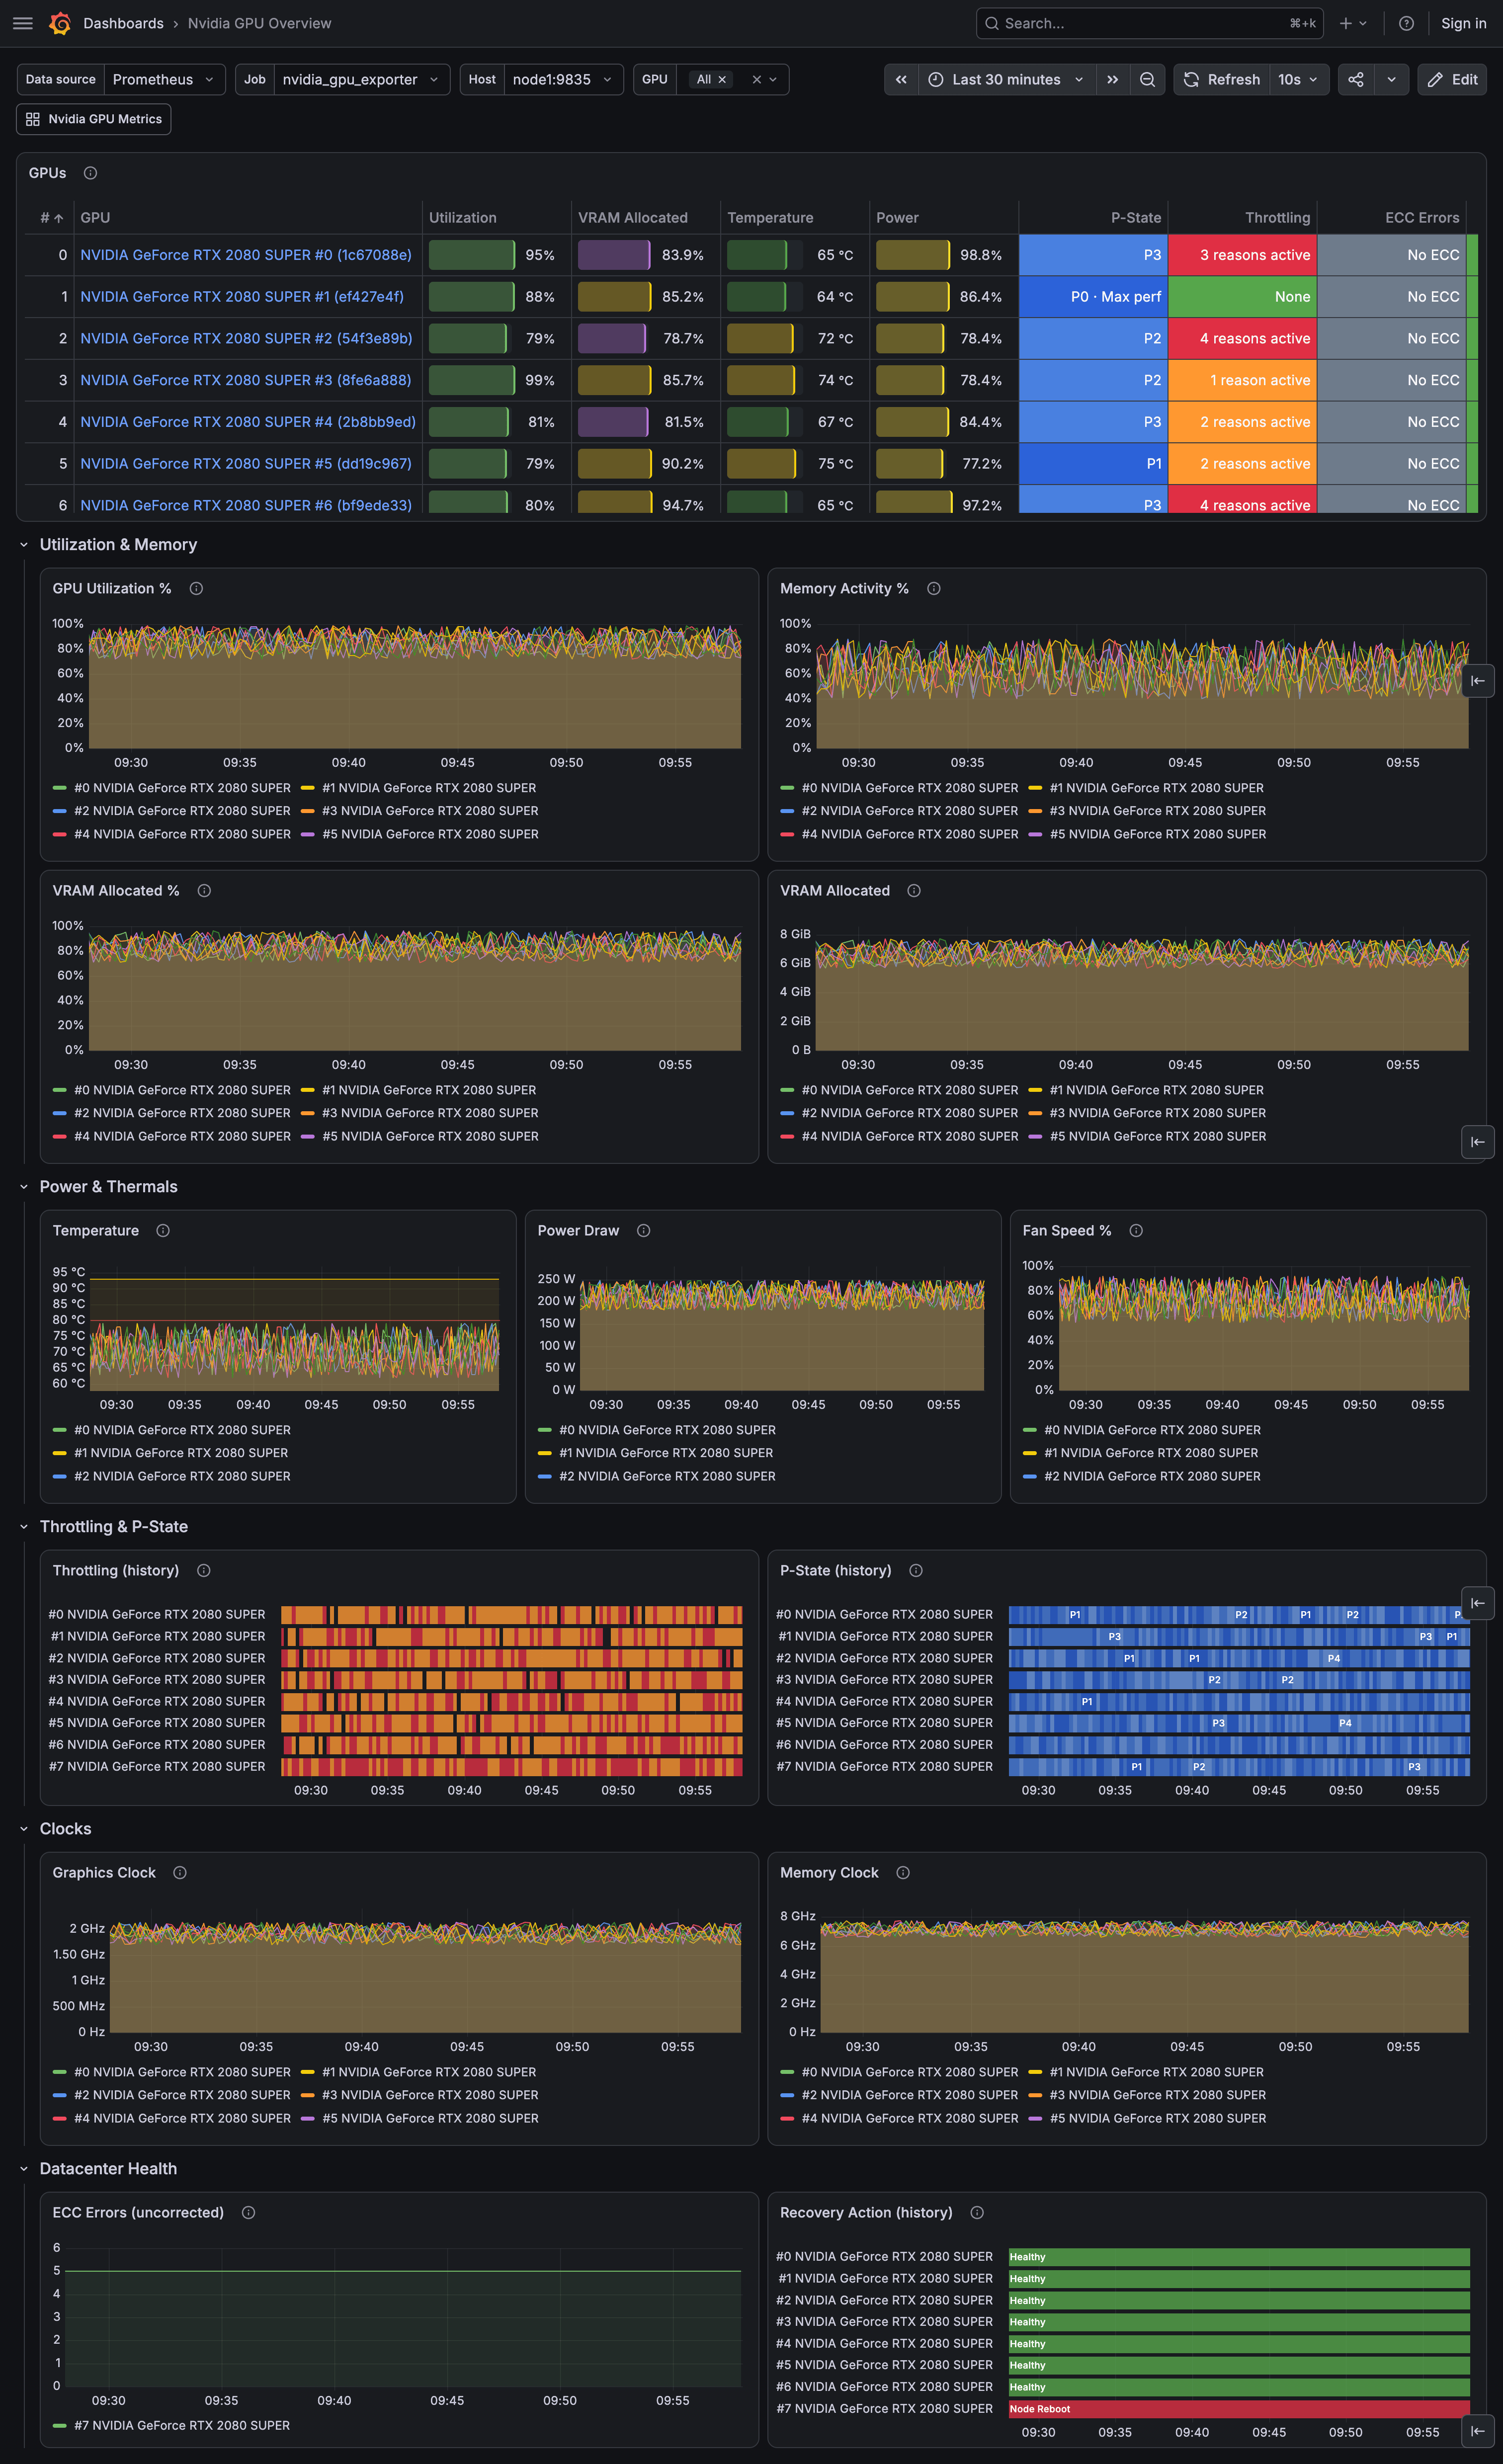
Data source config
Collector config:
Upload an updated version of an exported dashboard.json file from Grafana
| Revision | Description | Created | |
|---|---|---|---|
| Download |