
Advanced GPU Observability
Advanced GPU Observability for AKS using Inspektor Gadget eBPF CUDA metrics (enabled via the Inspektor Gadget cluster extension and scraped by Azure Managed Prometheus) and Pyroscope profiles. Tracks per-pod CUDA memory usage, top processes, allocation/free rates, and CUDA memory profiles.
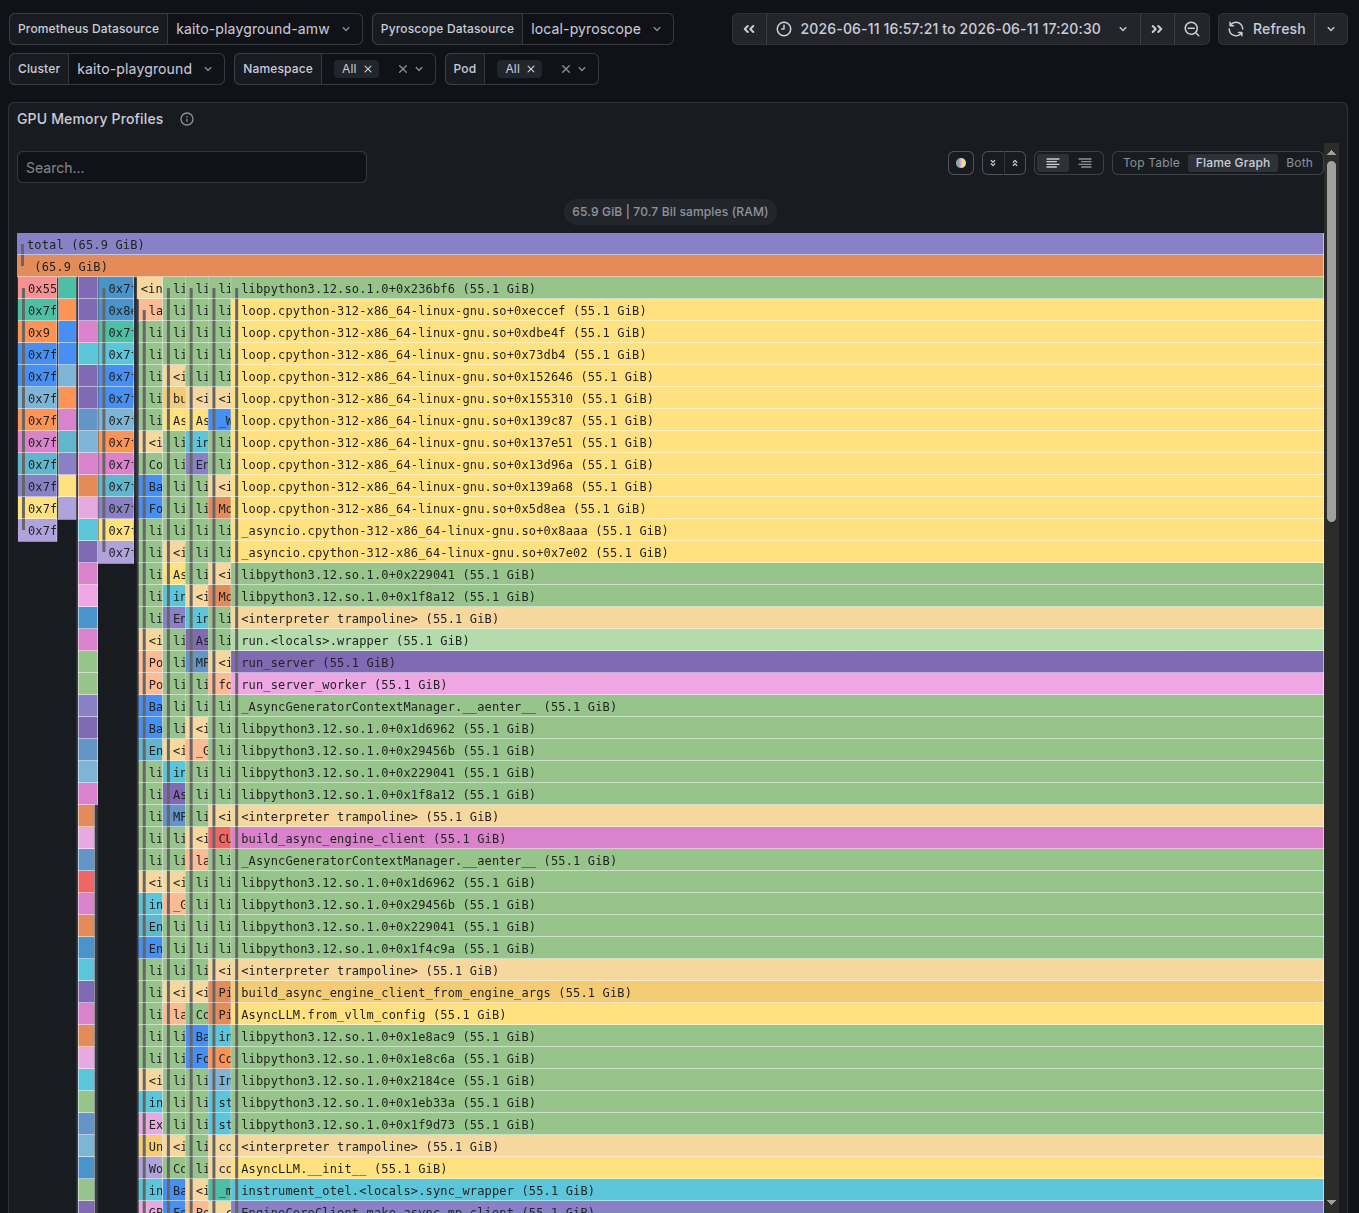
The Advanced GPU Observability dashboard uses the geneva-datasource and grafana-azureprometheus-datasource data sources to create a Grafana dashboard with the flamegraph, text and timeseries panels.
Data source config
Collector type:
Collector plugins:
Collector config:
Revisions
Upload an updated version of an exported dashboard.json file from Grafana
| Revision | Description | Created | |
|---|---|---|---|
| Download |