
PHP-FPM (VM)
A companion dashboard for https://github.com/hipages/php-fpm_exporter adapted to run php-fpm_exporter on a plain VM (no Kubernetes). Aggregates by Prometheus 'instance' instead of namespace/pod, and drops the cAdvisor / kube-state-metrics panels.
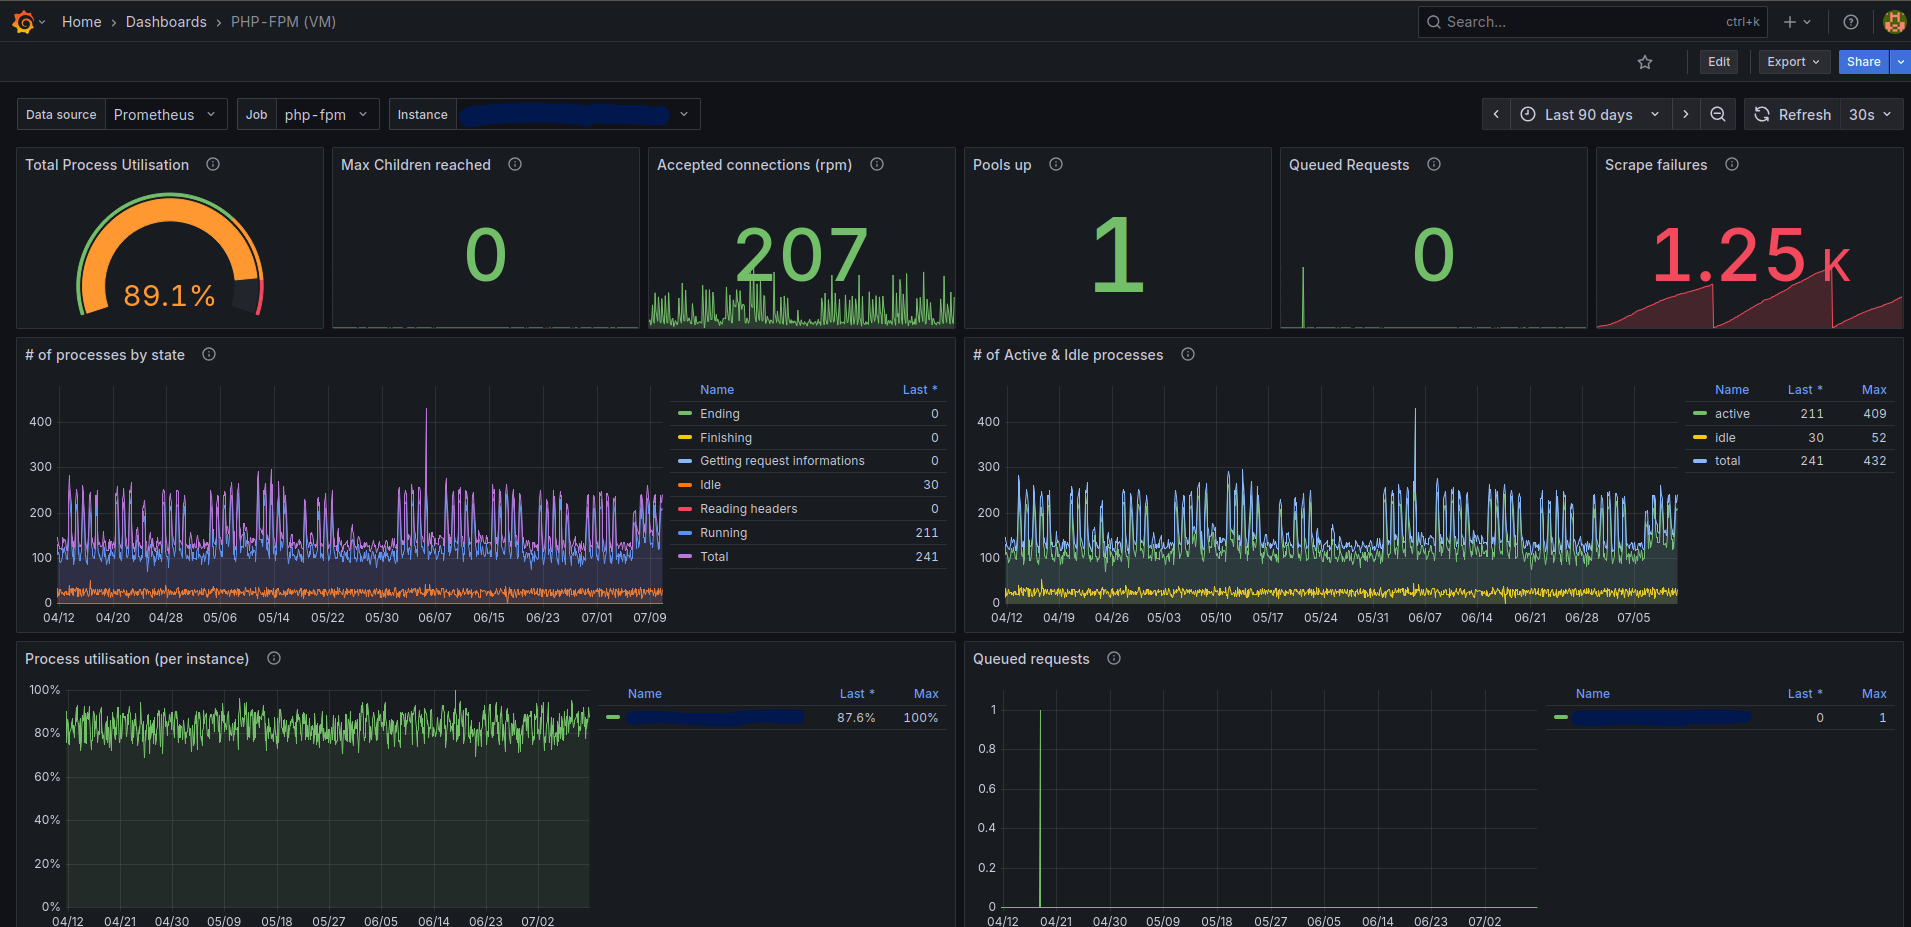
PHP-FPM (VM)
A Grafana dashboard for php-fpm_exporter running on a plain VM or bare-metal host — no Kubernetes required.
It is adapted from the project's original kubernetes-php-fpm dashboard: all namespace / pod / cAdvisor / kube-state-metrics dependencies were removed, and everything is aggregated by the Prometheus instance label instead.
Requirements
- php-fpm_exporter scraped by Prometheus
- A Prometheus data source in Grafana
- Grafana 9.0+
Variables
- Data source – Prometheus data source (defaults to your default one)
- Job – Prometheus scrape job
- Instance – single host selection (no "All", to avoid overloading Prometheus on large fleets)
Panels
- Overview: process utilisation, max children reached, accepted connections, pools up, queued requests, scrape failures
- Processes: active / idle / total, processes by state, per-instance utilisation
- Load: queued requests, accepted connection rate, request throughput (served req/s), slow requests
- Per-process: request duration and requests per worker
- Per-request tuning: last request memory & CPU
- Availability: pool uptime, restart count, up/down state timeline
All queries use only phpfpm_* metrics, so no extra exporters are needed.
Data source config
Collector type:
Collector plugins:
Collector config:
Revisions
Upload an updated version of an exported dashboard.json file from Grafana
| Revision | Description | Created | |
|---|---|---|---|
| Download |