
LogicMonitor - Dashboard Example
LogicMonitor - Dashboard Example
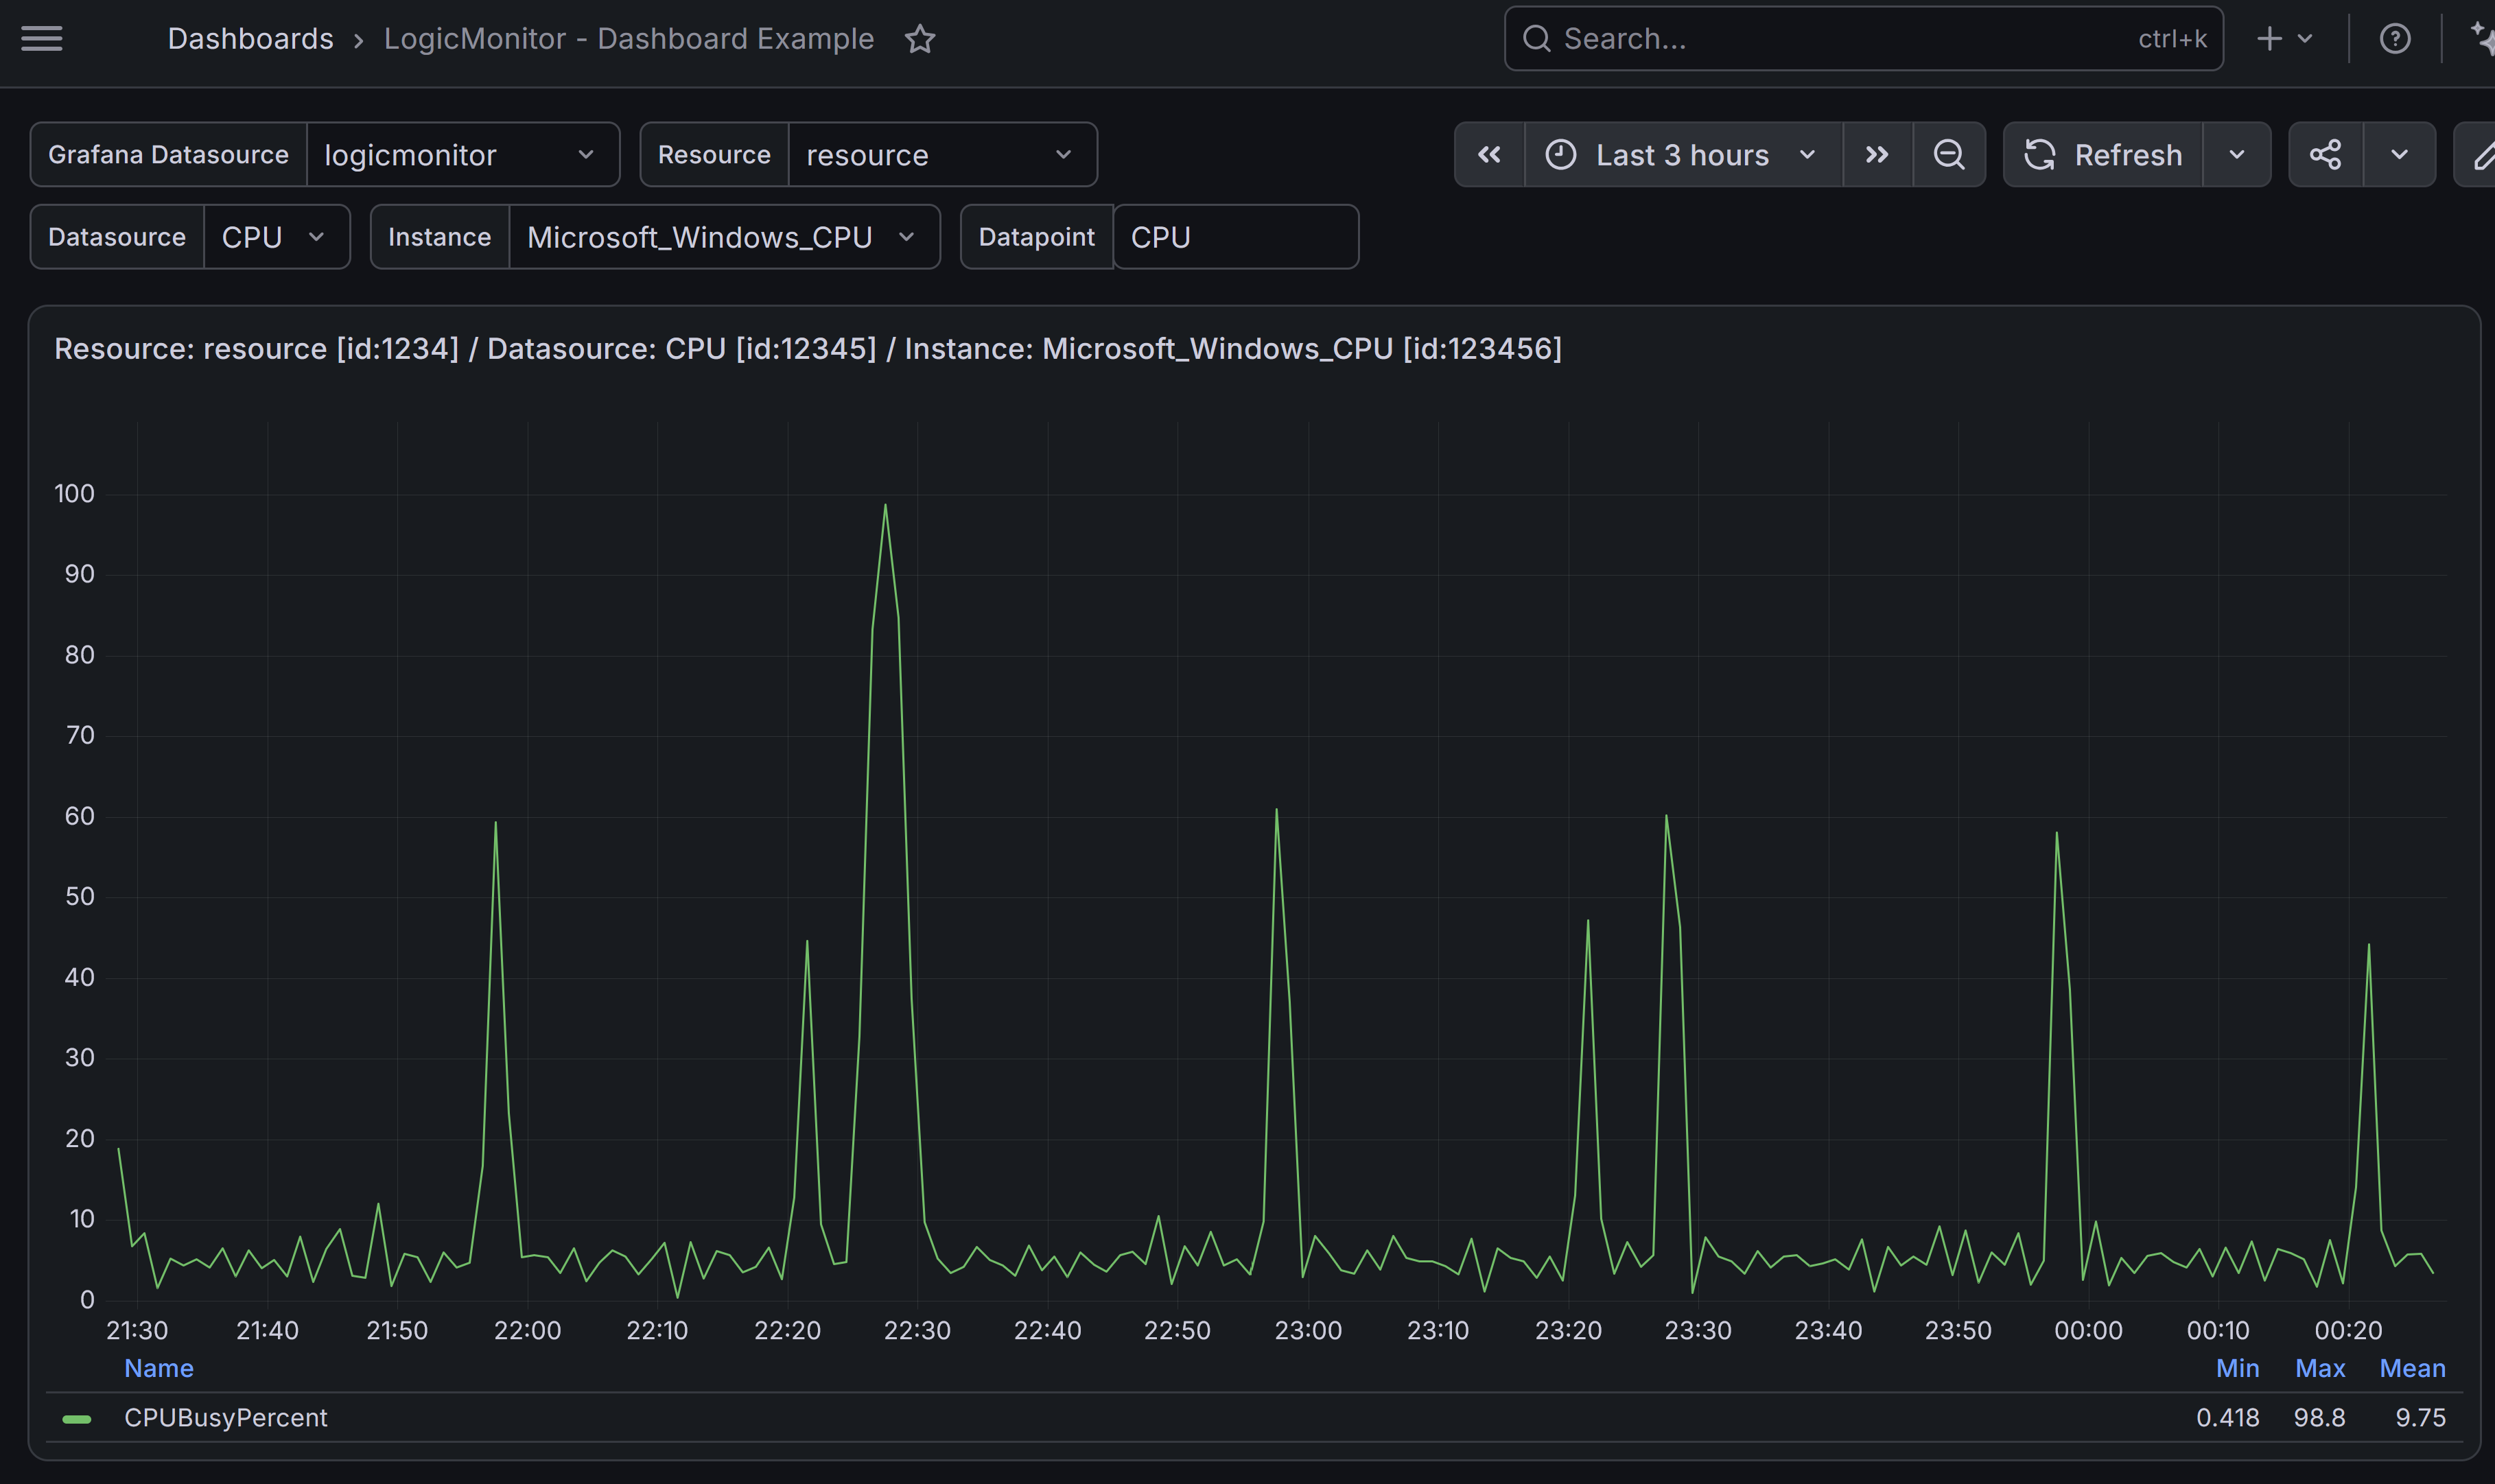
This example dashboard illustrates the complexities and limitations of using LogicMonitor as a data source. It highlights the requirement for explicit ID mappings (resource, datasource, and instance) to query metrics, as well as API response size limitations. Because the API limits the total number of datapoints per request and lacks aggregation functions, long-term time-series tracking is constrained, typically limiting reliable Grafana visualization to a single week.
Data source config
Collector type:
Collector plugins:
Collector config:
Revisions
Upload an updated version of an exported dashboard.json file from Grafana
| Revision | Description | Created | |
|---|---|---|---|
| Download |