
Prometheus Self-Monitoring
Process-level self-monitoring dashboard for Prometheus. Zero external dependencies - all metrics from Prometheus' own /metrics endpoint.
Prometheus Self-Monitoring
A zero-dependency dashboard for monitoring the Prometheus server itself, not the targets it scrapes. Everything is built from Prometheus' own /metrics endpoint, which every default installation already exposes. No node_exporter, no extra exporters, no additional scrape configs.
The question it answers in one glance: is my Prometheus healthy, and will it still be healthy next week?
What's new in this revision
- Works with any job name. A
Jobvariable replaces the hardcodedjob="prometheus". If your self-scrape job is calledprometheus-server,kube-prometheusor anything else, pick it from the dropdown. No more "No data" on import. - Multi-instance support. An
Instancevariable (multi-select,Allby default) lets one dashboard cover several Prometheus servers, or focus on a single one. - WAL Corruptions fixed. The panel used
metric or vector(0), which returned two values (the real series plus an empty0). It now shows one value per instance. - Ingestion Rate fixed. Prometheus 3 splits the counter by
type="float"/type="histogram", which drew two lines. It is now summed into one line per instance.
Already imported the previous revision? Re-import ID 25537 to get these changes.
What's inside: 18 panels across 3 sections
Process Health
| Panel | What it tells you |
|---|---|
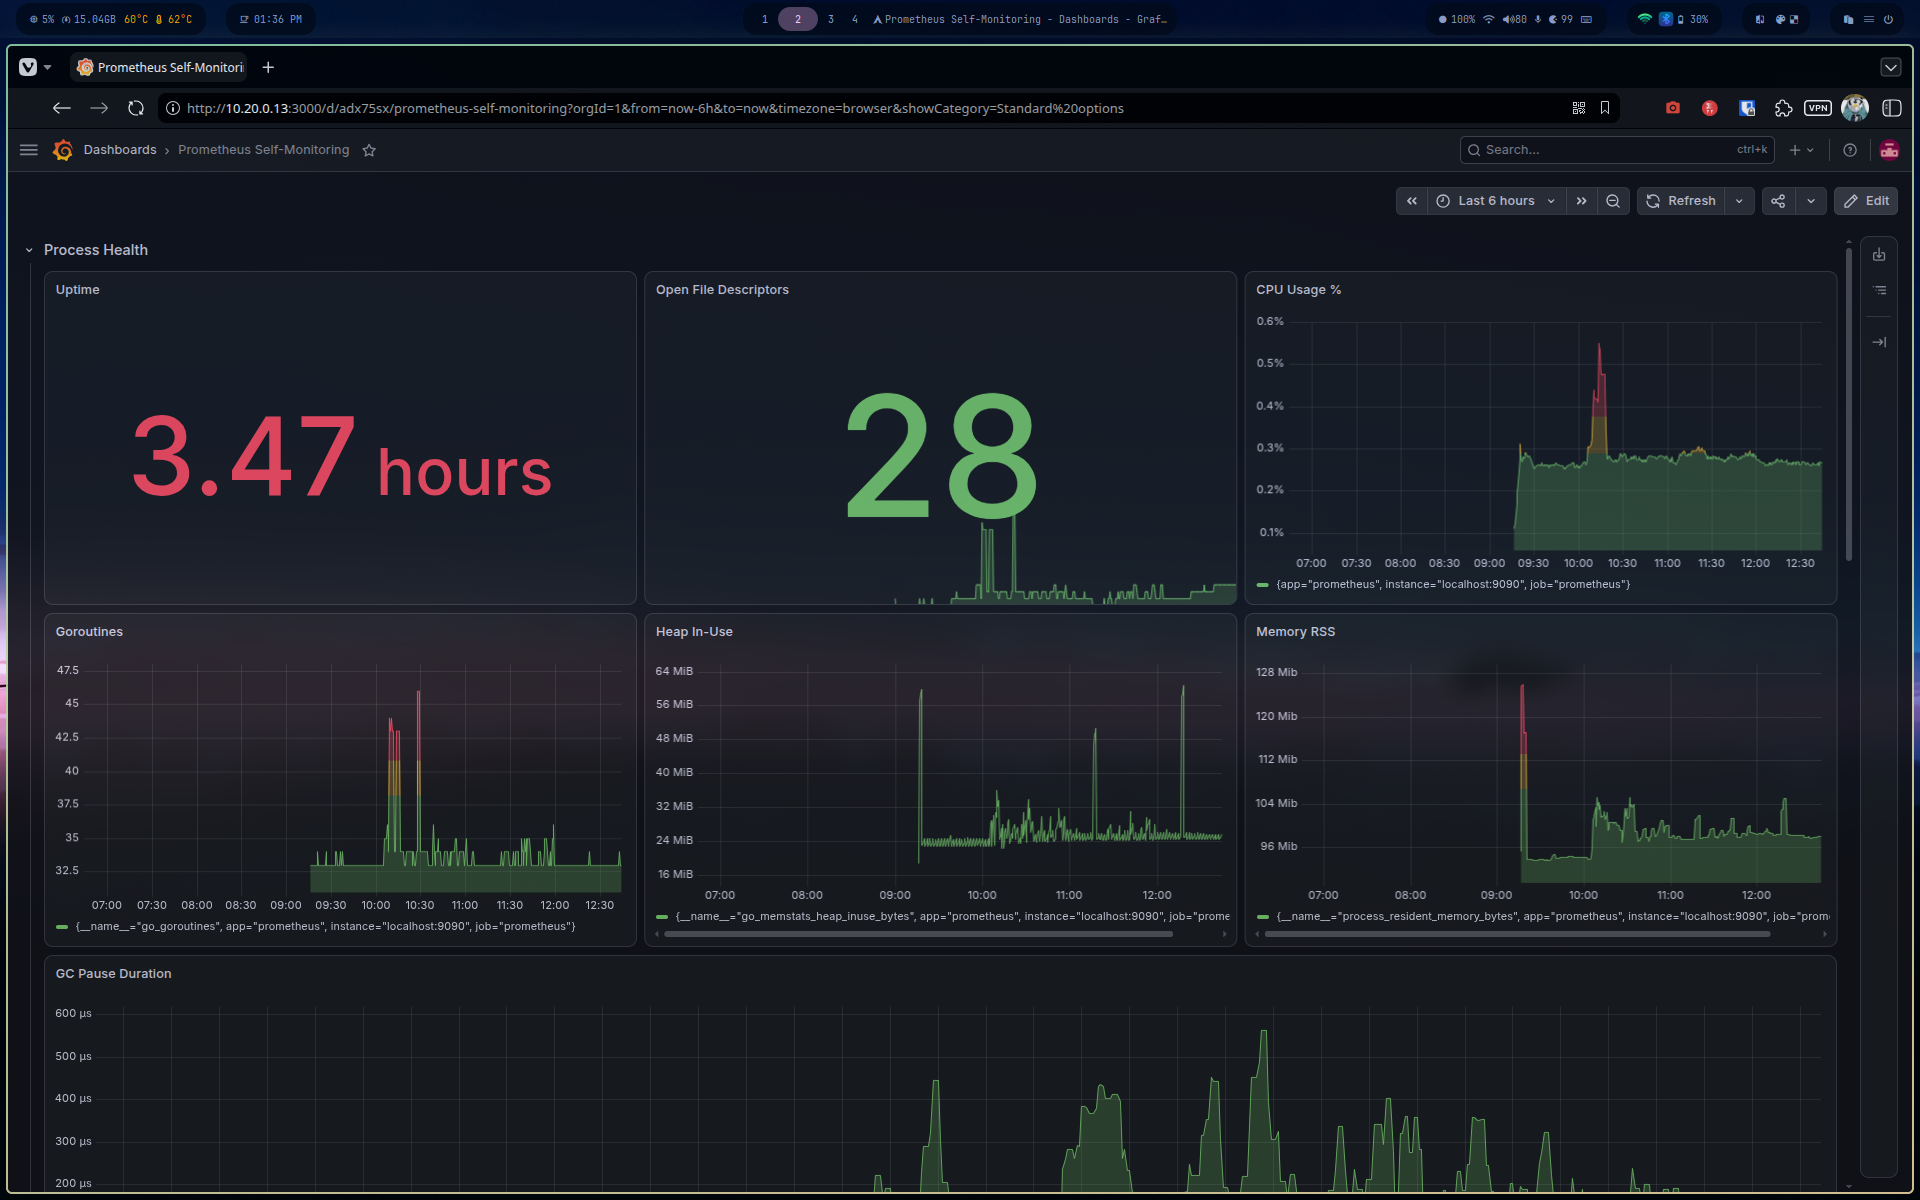
| Uptime | Time since the last restart. Frequent resets usually mean OOM kills or a crash loop, so check this before anything else. |
| Memory RSS | Real memory footprint of the process. This is the number the kernel's OOM killer looks at, not the heap. |
| CPU usage | Sustained high CPU points to expensive queries or too many rule evaluations, not ingestion. |
| Goroutines | Should stay roughly flat. A steady climb is a leak, often from scrape targets that hang and never time out. |
| Heap in-use | Go heap actually held by live data. Compare it with RSS: a large gap means memory is sitting in the Go runtime waiting to be returned to the OS. |
| GC pause duration | Garbage collection stop-the-world time. Rising pauses correlate with heap pressure and precede query slowdowns. |
| Open file descriptors | Raw count, one FD per TSDB block and per active target connection. If it approaches the process limit, scrapes start failing silently. |
TSDB & Storage
| Panel | What it tells you |
|---|---|
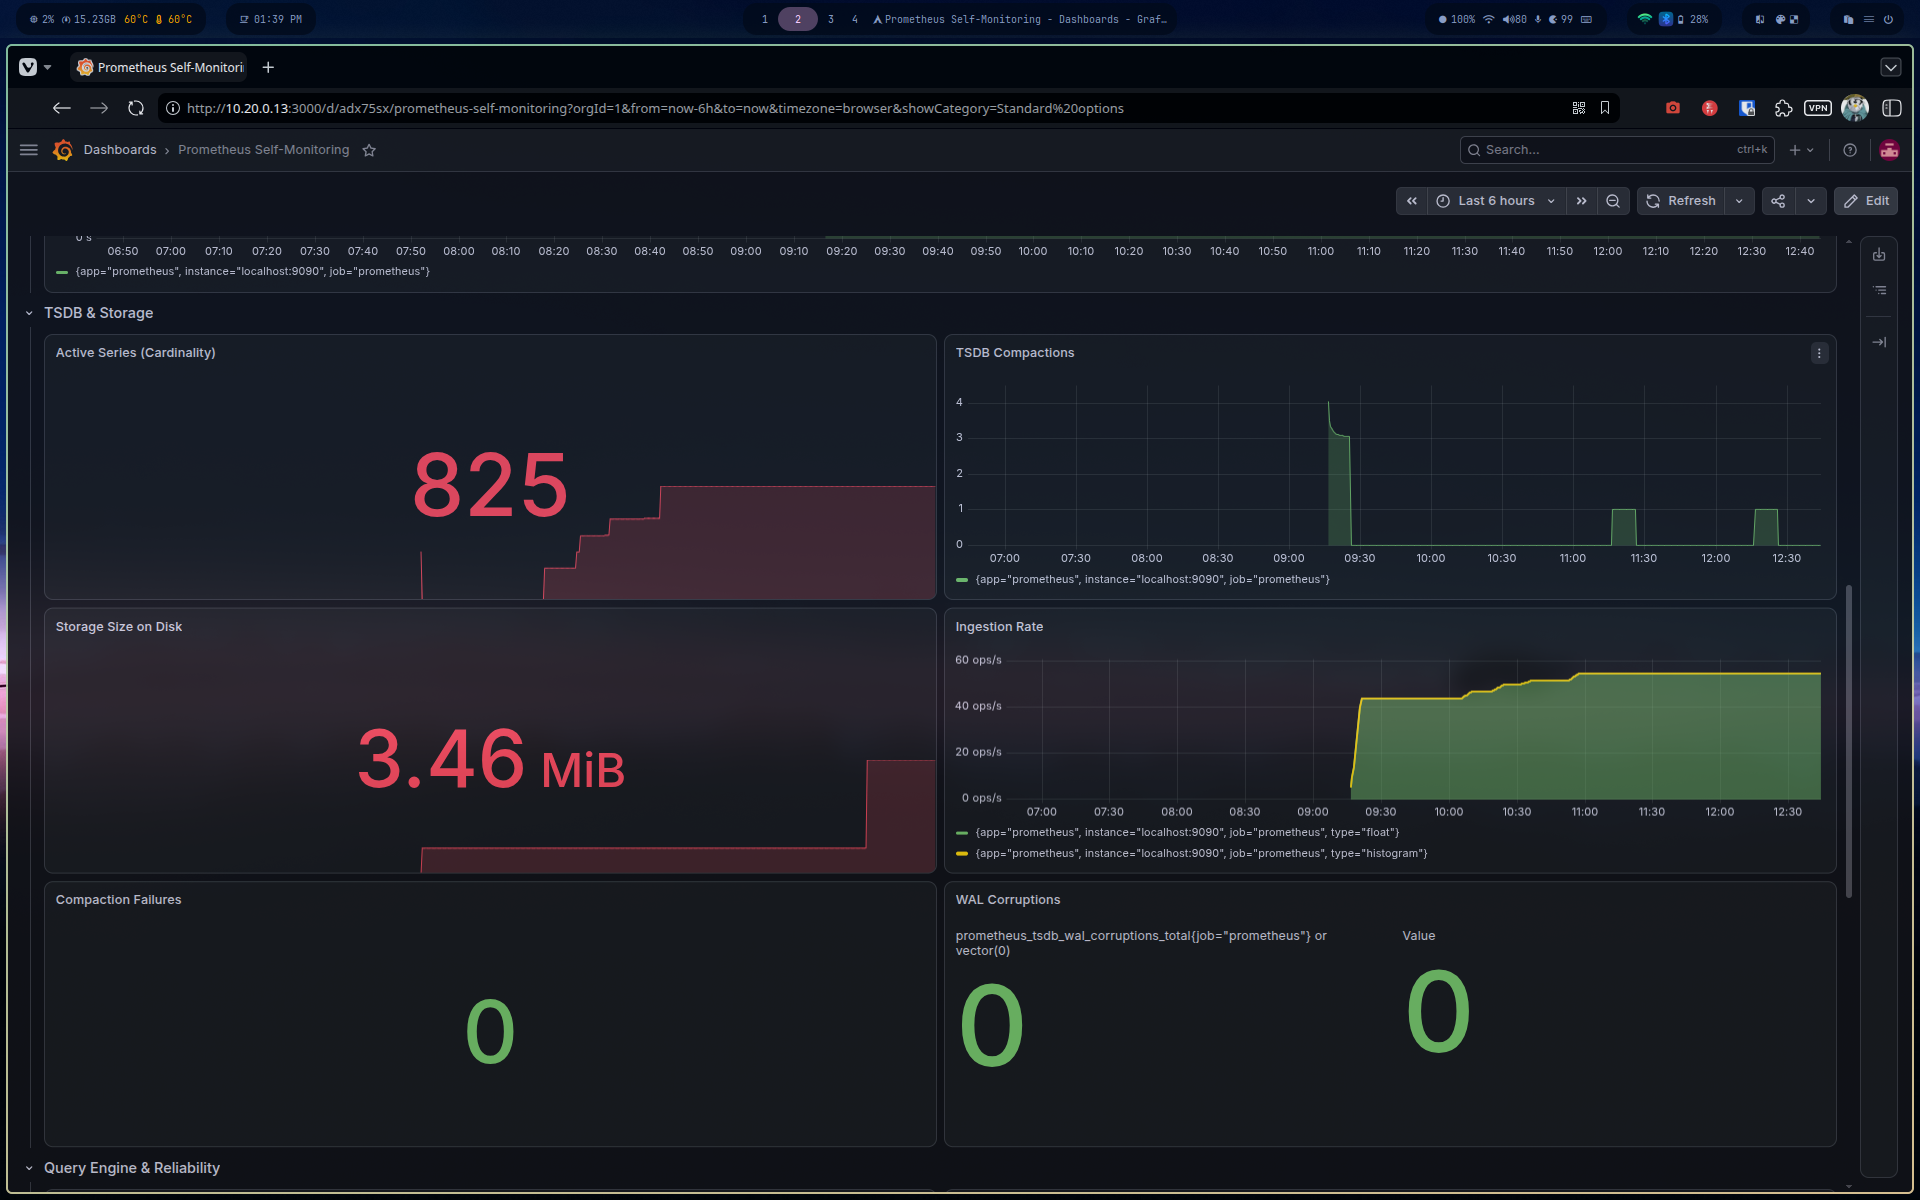
| Active series (cardinality) | Number of series currently in the TSDB head. The most important panel here, see below. |
| Ingestion rate | Samples appended per second, one line per instance. A sudden drop means targets stopped responding; a sudden spike means someone added a noisy exporter. |
| TSDB compactions | Head blocks being compacted to disk on schedule. A stalled counter means compaction is stuck and memory will grow. |
| Storage size on disk | Growth of the data directory. Useful to project when the disk fills up and to validate your retention settings. |
| Compaction failures | Must stay at zero. Any increment means blocks are not being written correctly and data loss is possible. |
| WAL corruptions | Must stay at zero, one value per instance. A corruption here usually follows an unclean shutdown or a full disk. |
Query Engine & Reliability
| Panel | What it tells you |
|---|---|
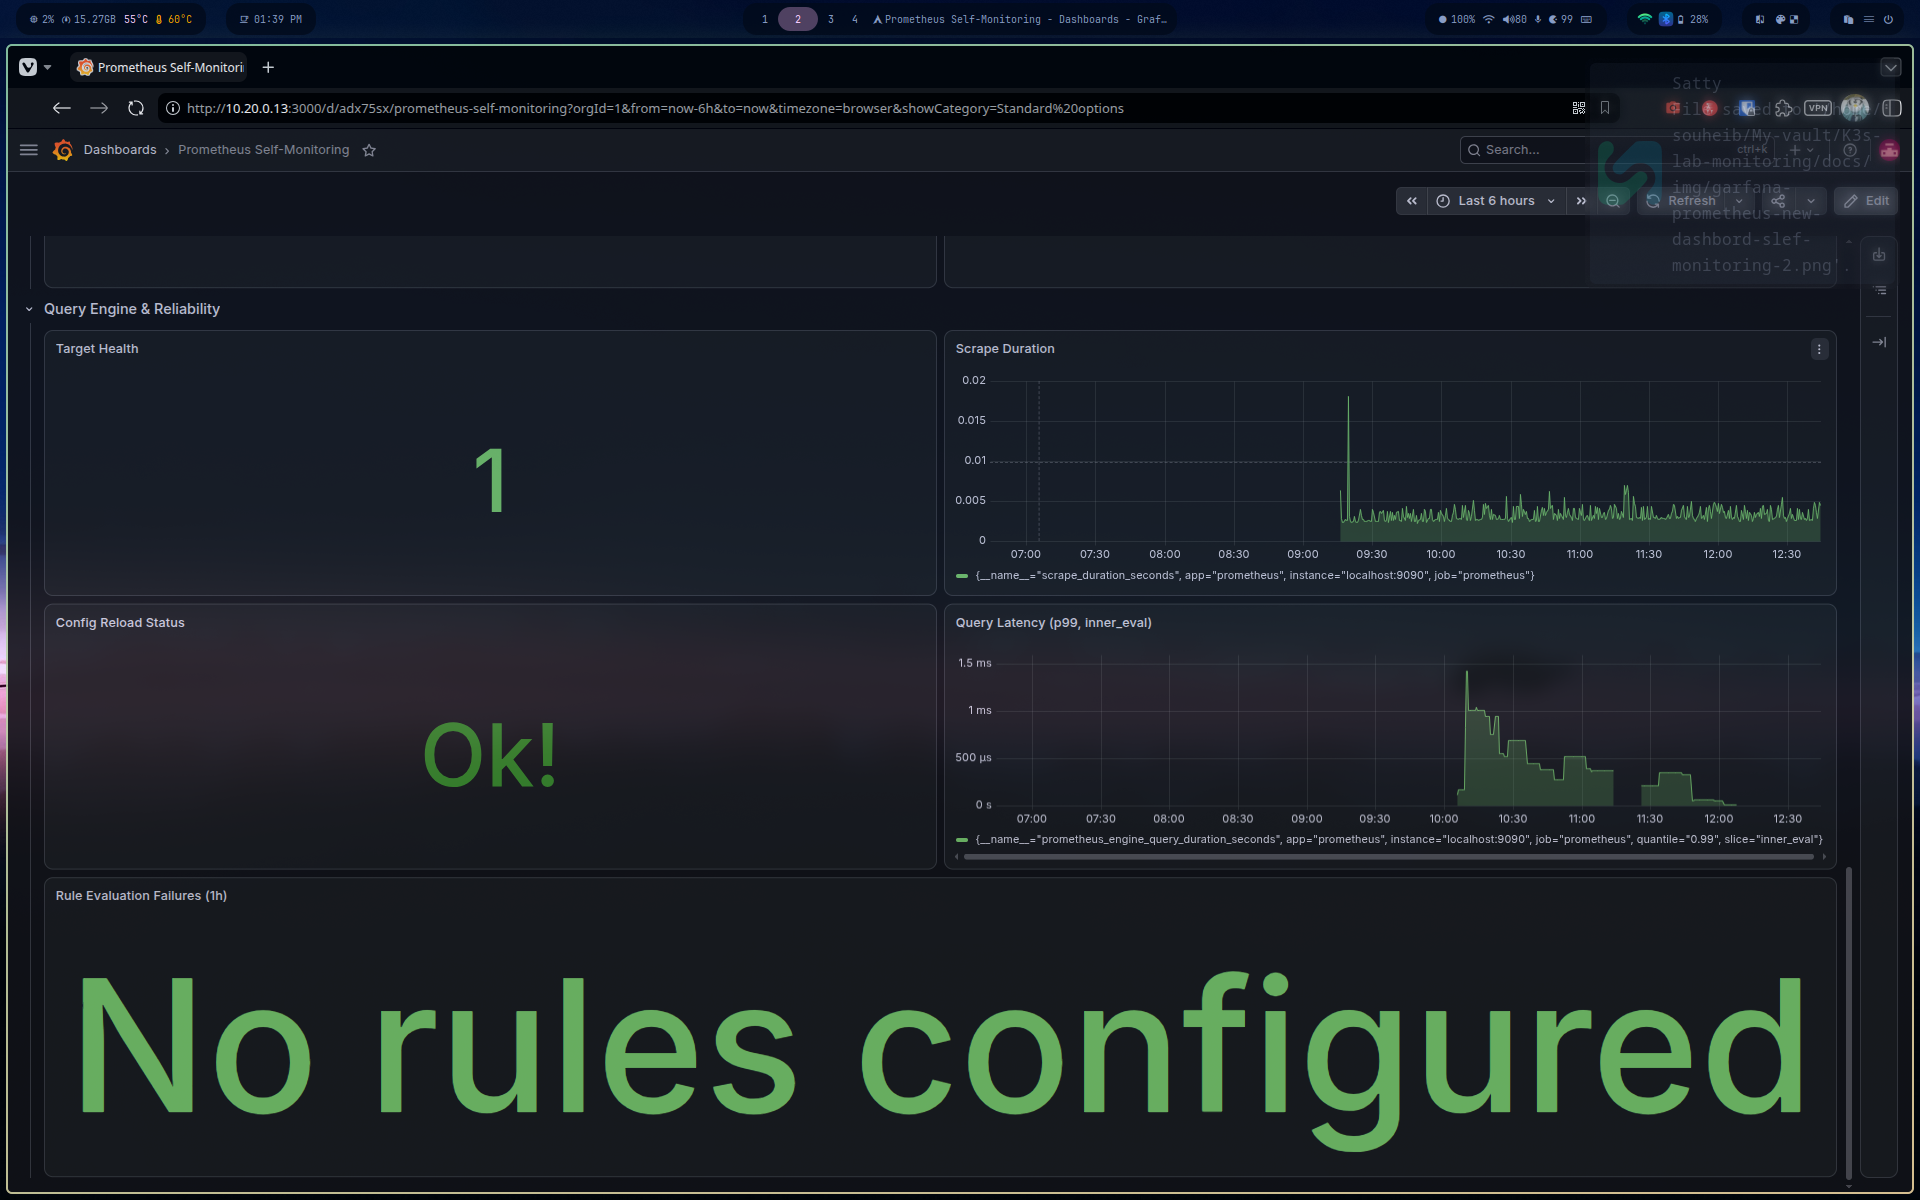
| Target health | Up/down state of Prometheus' own self-scrape. If this is 0, every other panel is showing stale data. |
| Scrape duration | How long the self-scrape takes. A self-scrape creeping toward the scrape interval means the process itself is struggling. |
| Query latency (p99, inner_eval) | Time spent in the evaluation engine itself, which isolates slow PromQL from slow network or slow disk. |
| Config reload status | 1 or 0. A failed reload means Prometheus is silently running the previous configuration, which is easy to miss for days. |
| Rule evaluation failures | Recording or alerting rules that error out. A failing alert rule is worse than no rule: you believe you are covered when you are not. |
The panel to watch first: Active Series
prometheus_tsdb_head_series is the best leading indicator of future memory pressure. A monotonic climb without a plateau signals label explosion, usually a misbehaving exporter or an unbounded label value, long before RSS or an OOM kill makes the problem visible. During incident triage, check this panel first.
Scope: process-level only
This dashboard covers the Prometheus process, not the host it runs on. Host-level metrics (total RAM, disk usage, load average) are out of scope on purpose. Pair it with a node_exporter dashboard if you need machine-level visibility.
One expected behavior: if your Prometheus has no recording or alerting rules configured, the Rule Evaluation Failures panel displays "No rules configured" instead of a blank panel. That is normal, not a bug.
Requirements
- Prometheus scraping itself (any job name, one or several instances)
- Grafana 10+
- No plugins
- Tested on Prometheus 3.x, and the metric names are stable so 2.x should work too
Setup
- Dashboards, Import, Grafana.com ID:
25537 - Select your Prometheus datasource when prompted
- Pick your self-scrape job in the
Jobdropdown (it lists every job exposingprometheus_build_info, so only Prometheus servers show up) - Leave
InstanceonAll, or select specific servers
Background
This dashboard is the observability layer of a self-hosted NOC/SOC homelab: a 6-node K3s HA cluster monitored by Zabbix, Wazuh, and Prometheus behind a dedicated OPNsense firewall. Every panel and query was validated against a real running instance, and a few bugs got caught and fixed along the way: wrong byte units, misconfigured thresholds, a Go summary metric that does not expose the quantile you would expect, and two panels returning duplicate series.
Full build writeup, architecture, and troubleshooting notes: github.com/Souheib-h/K3s-lab-monitoring
Feedback, issues, or suggestions: open an issue on the repo.
Data source config
Collector config:
Upload an updated version of an exported dashboard.json file from Grafana
| Revision | Description | Created | |
|---|---|---|---|
| Download |

Metrics Endpoint (Prometheus)

Easily monitor any Prometheus-compatible and publicly accessible metrics URL with Grafana Cloud's out-of-the-box monitoring solution.
Learn more