
Itential Platform Monitoring
The official monitoring dashboard for the Itential Platform deployed on-premises, leveraging Prometheus. To use this dashboard, select your Prometheus datasource from the dropdown. Tabs: Overview, Workflow Engine, Platform Process, Redis, MongoDB.
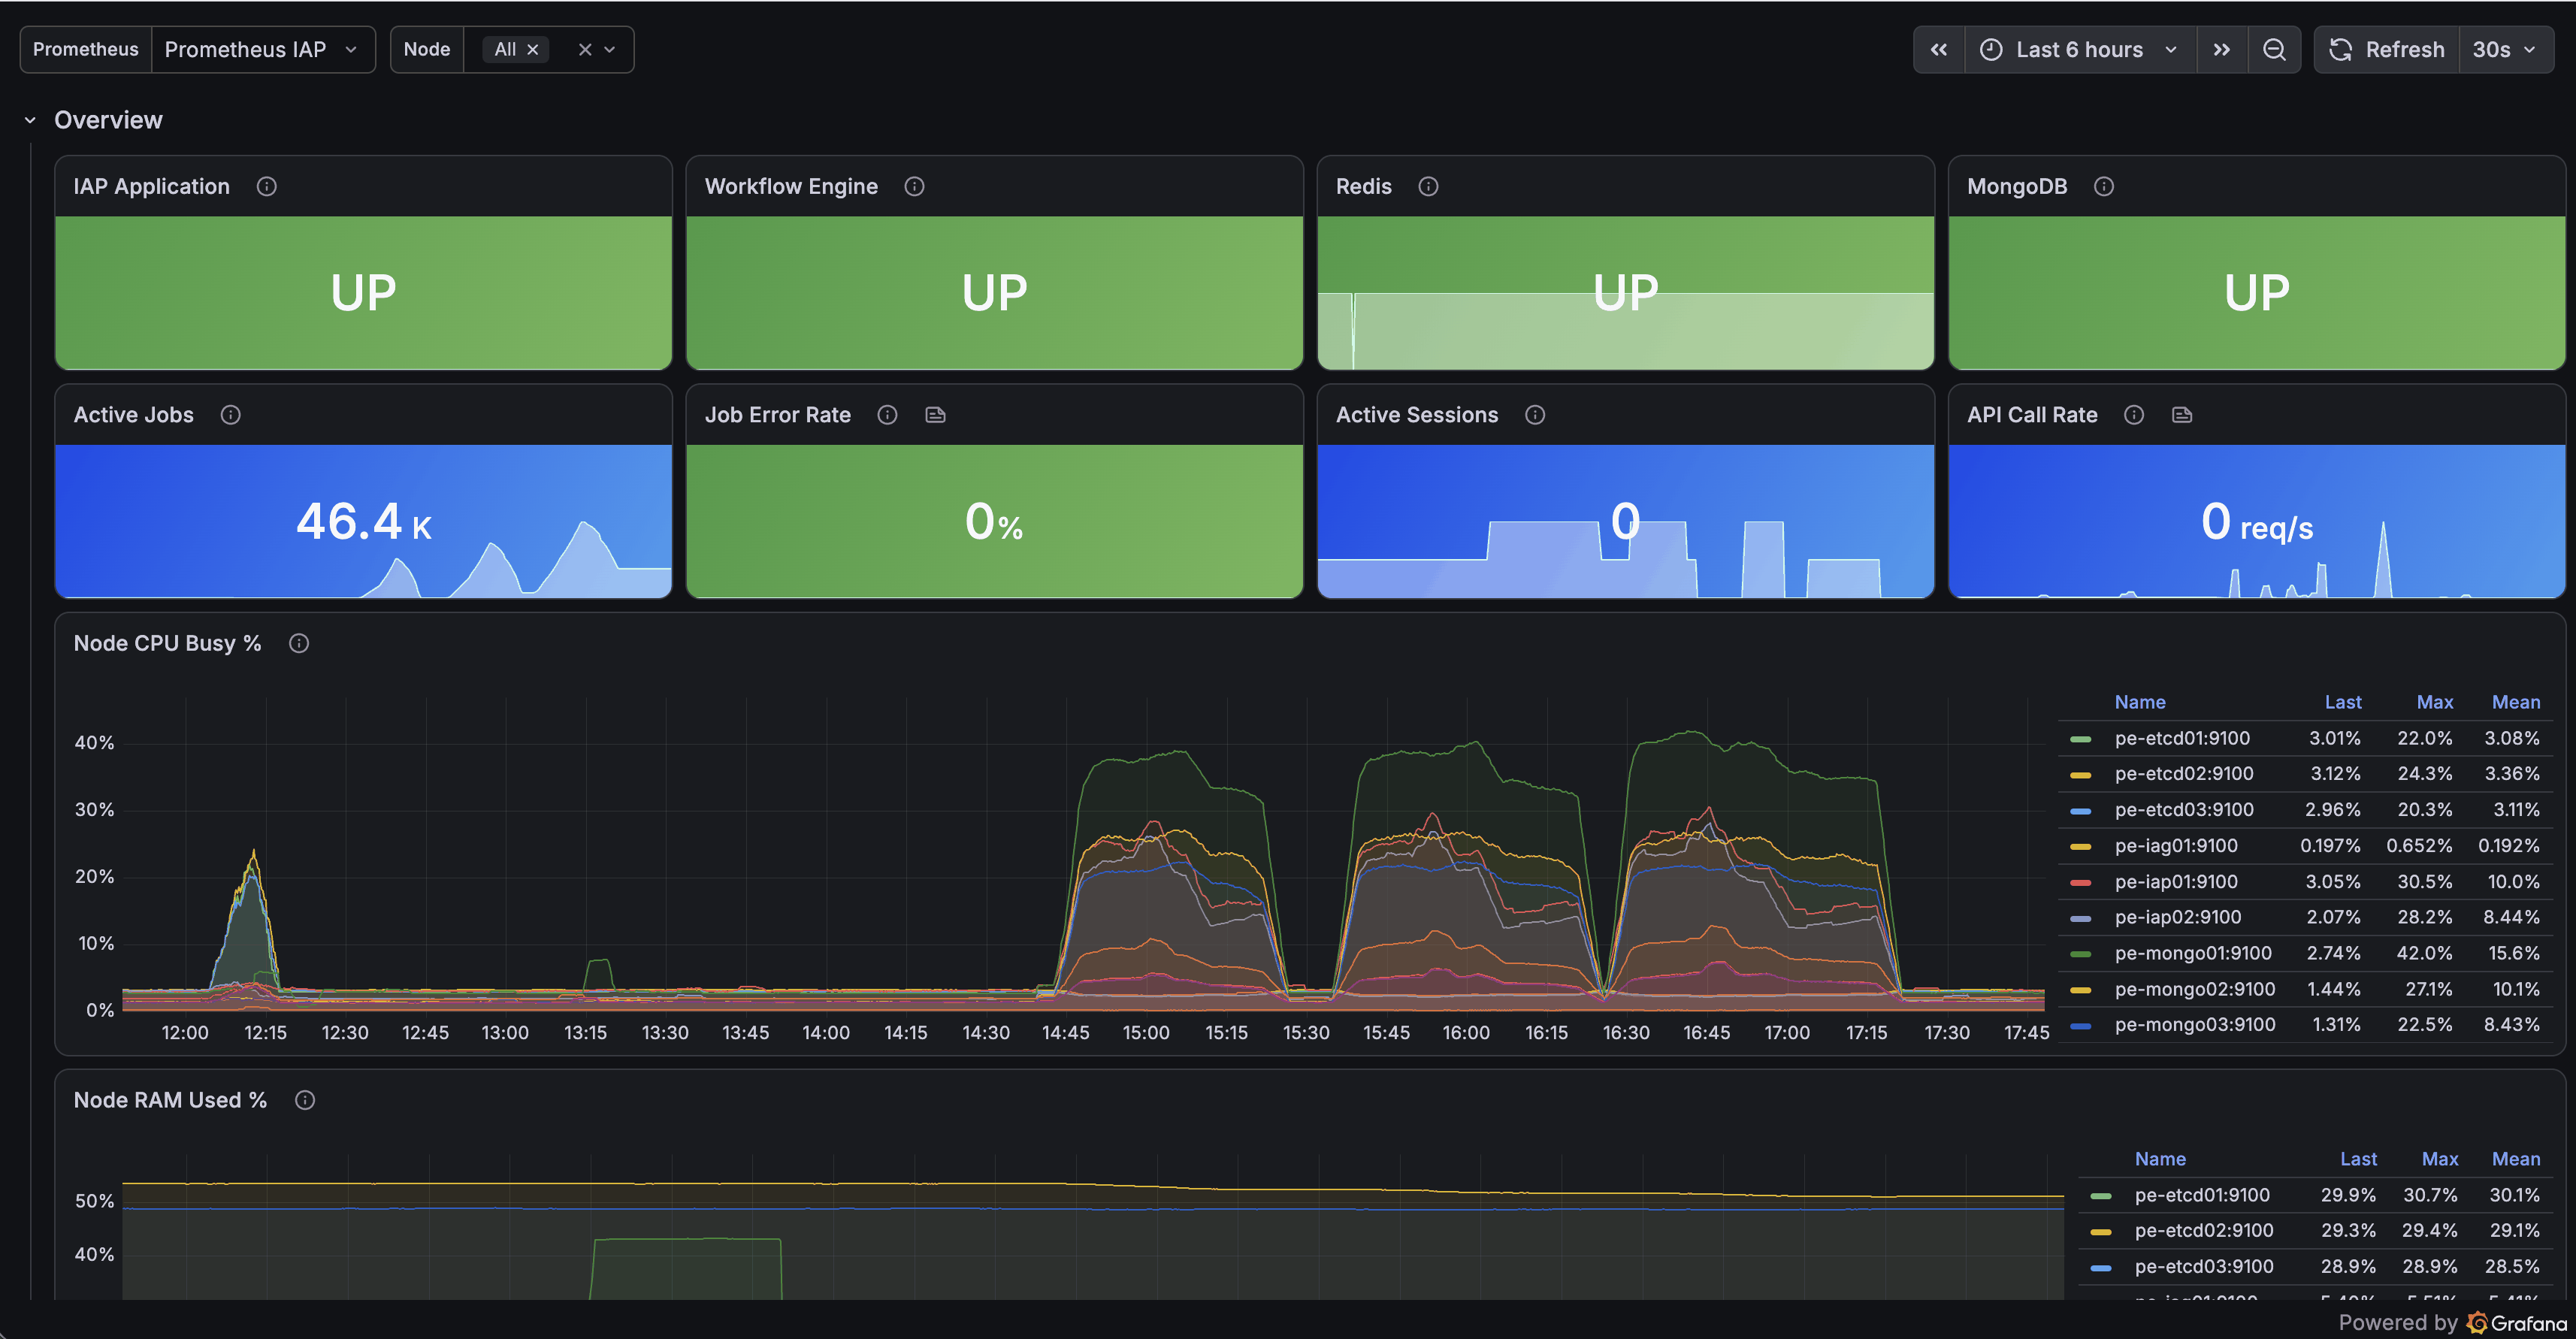
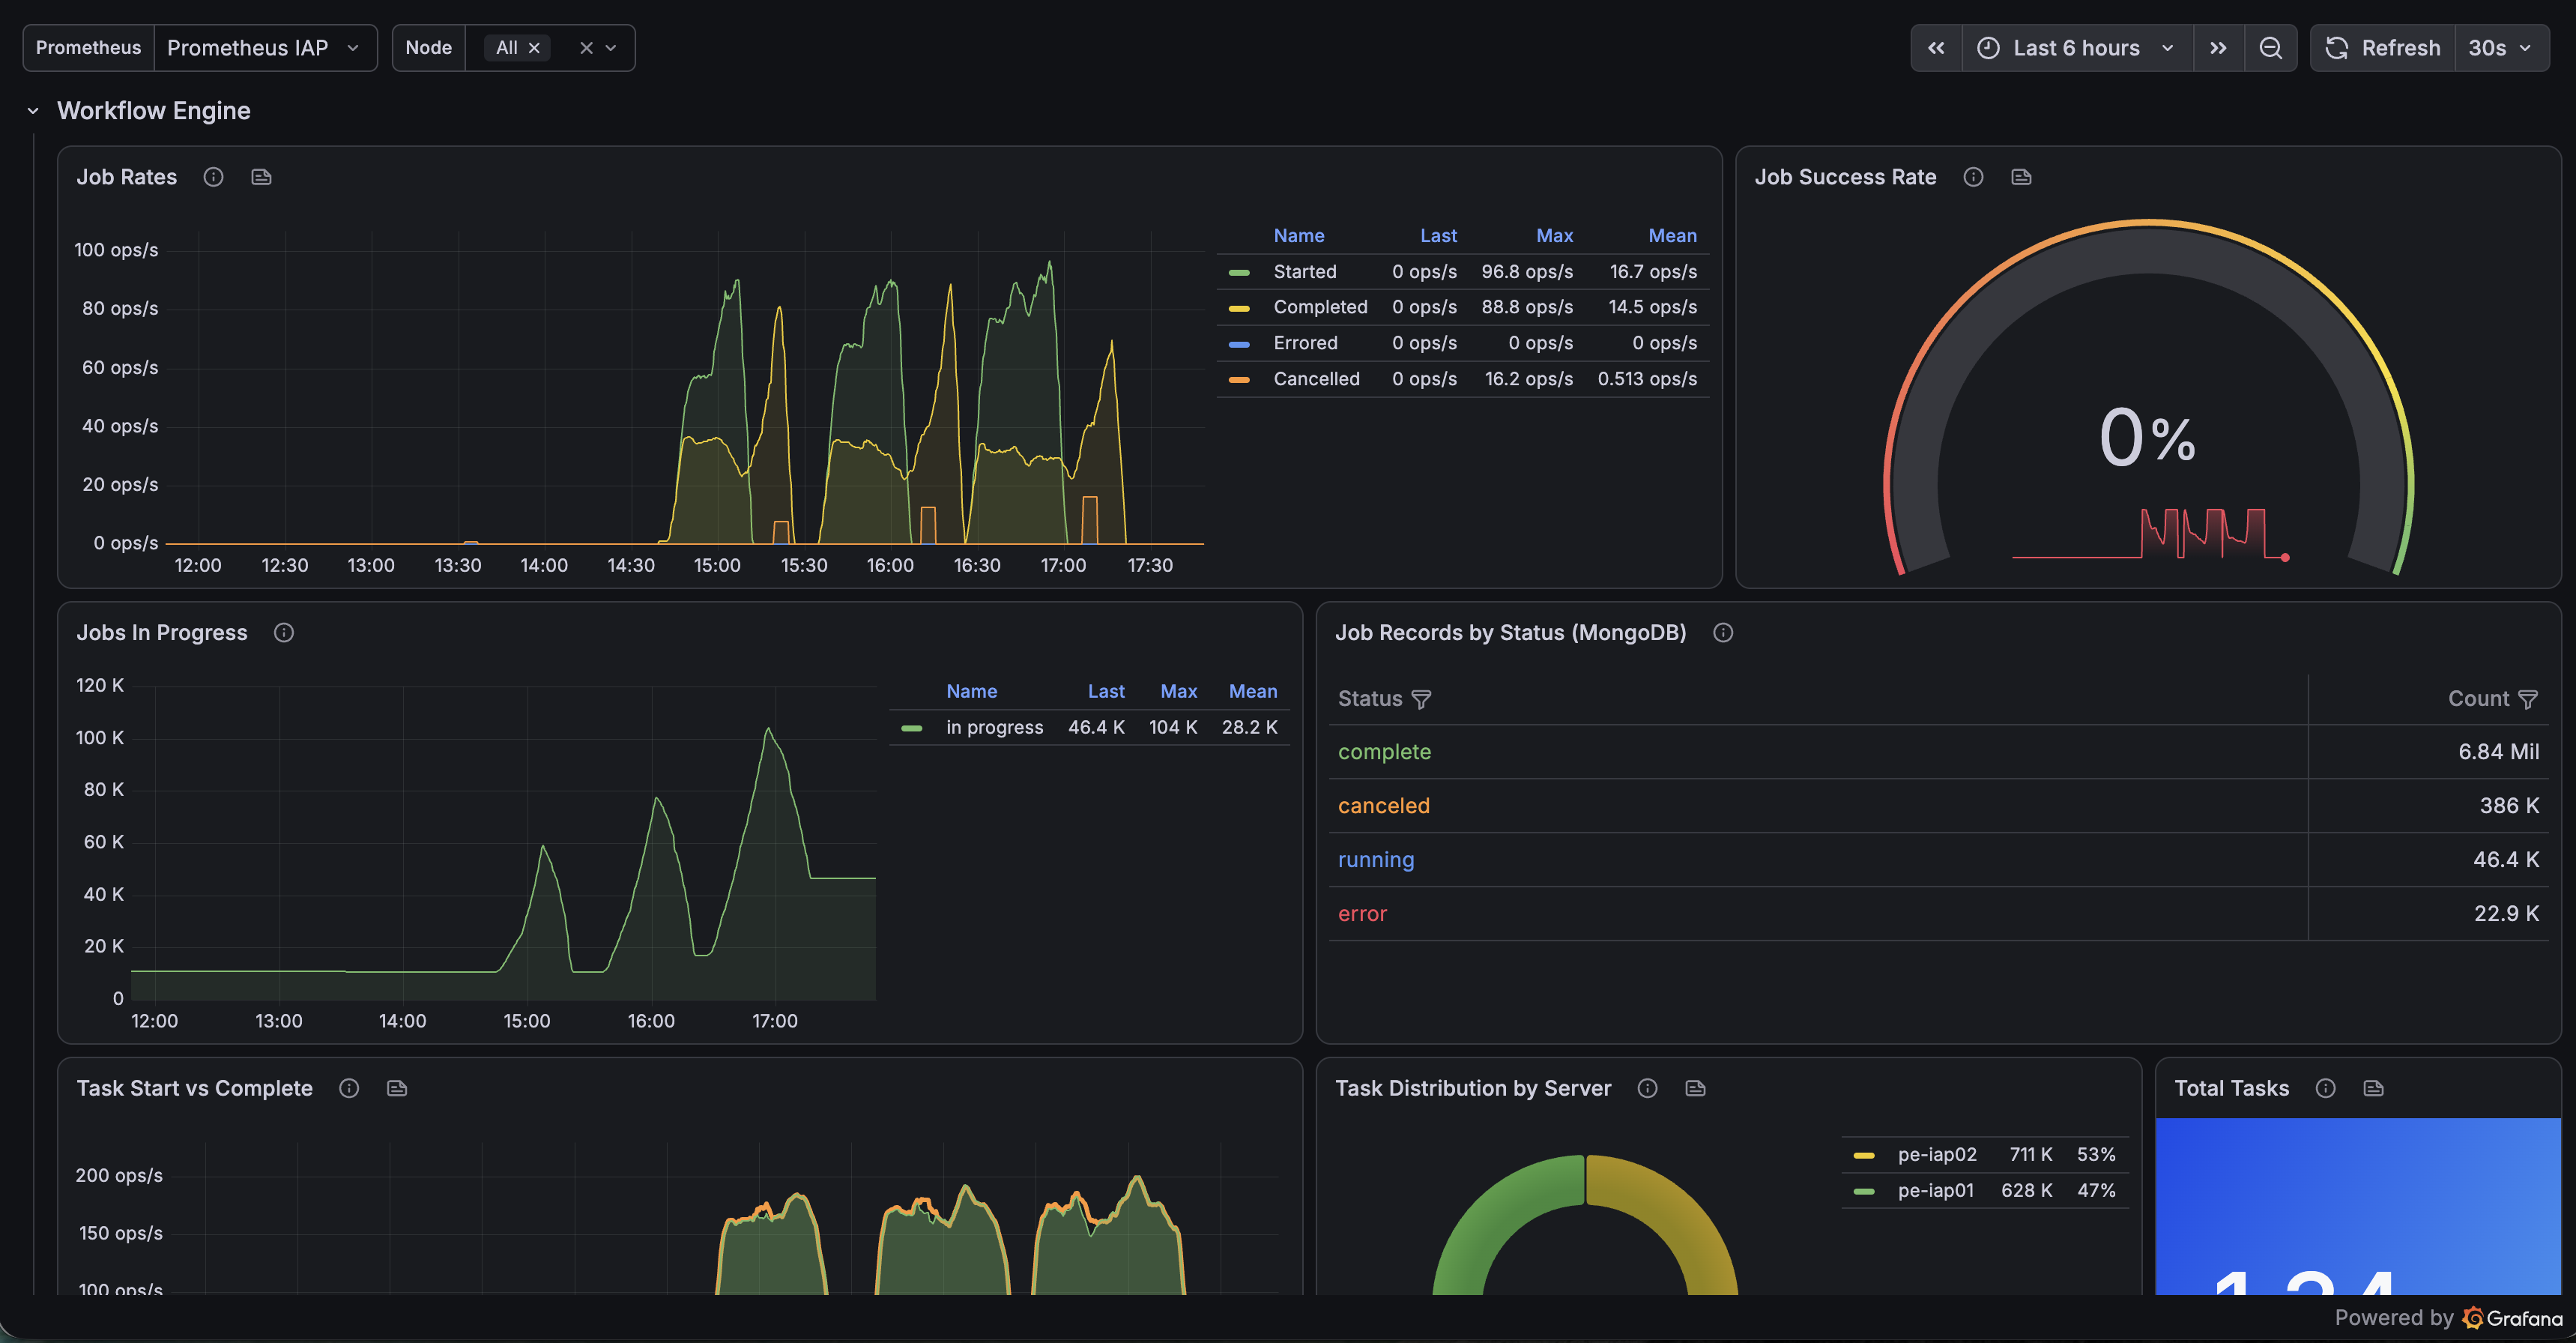
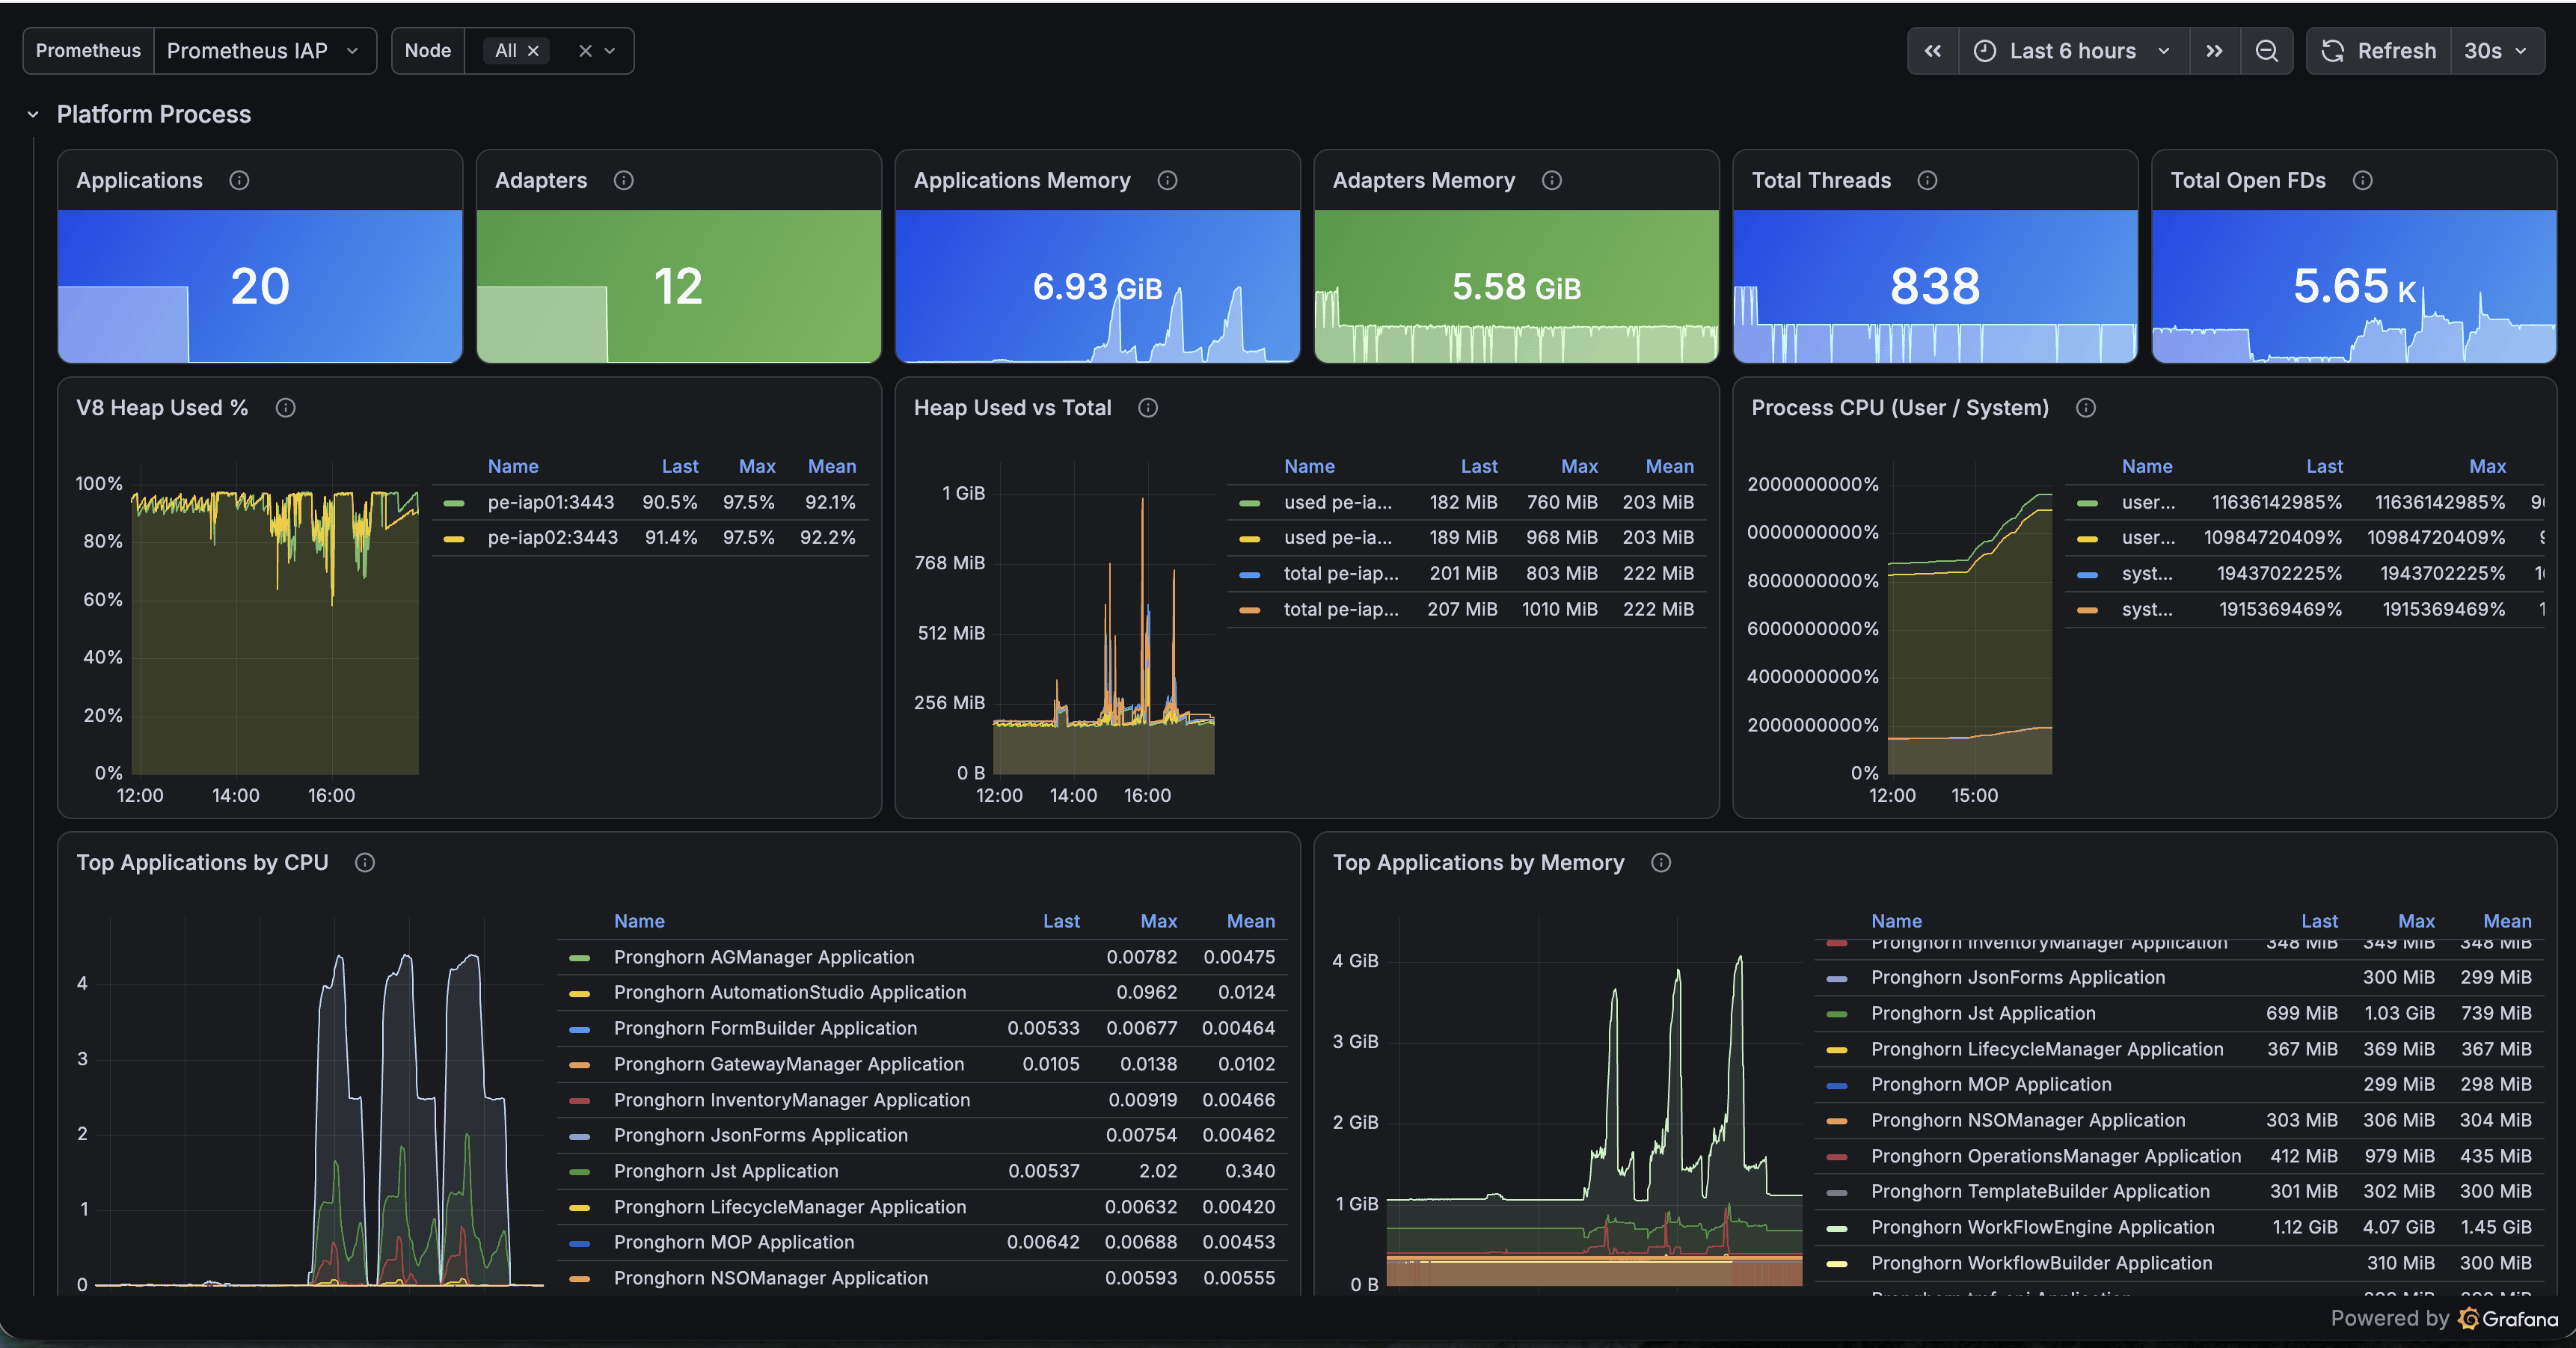
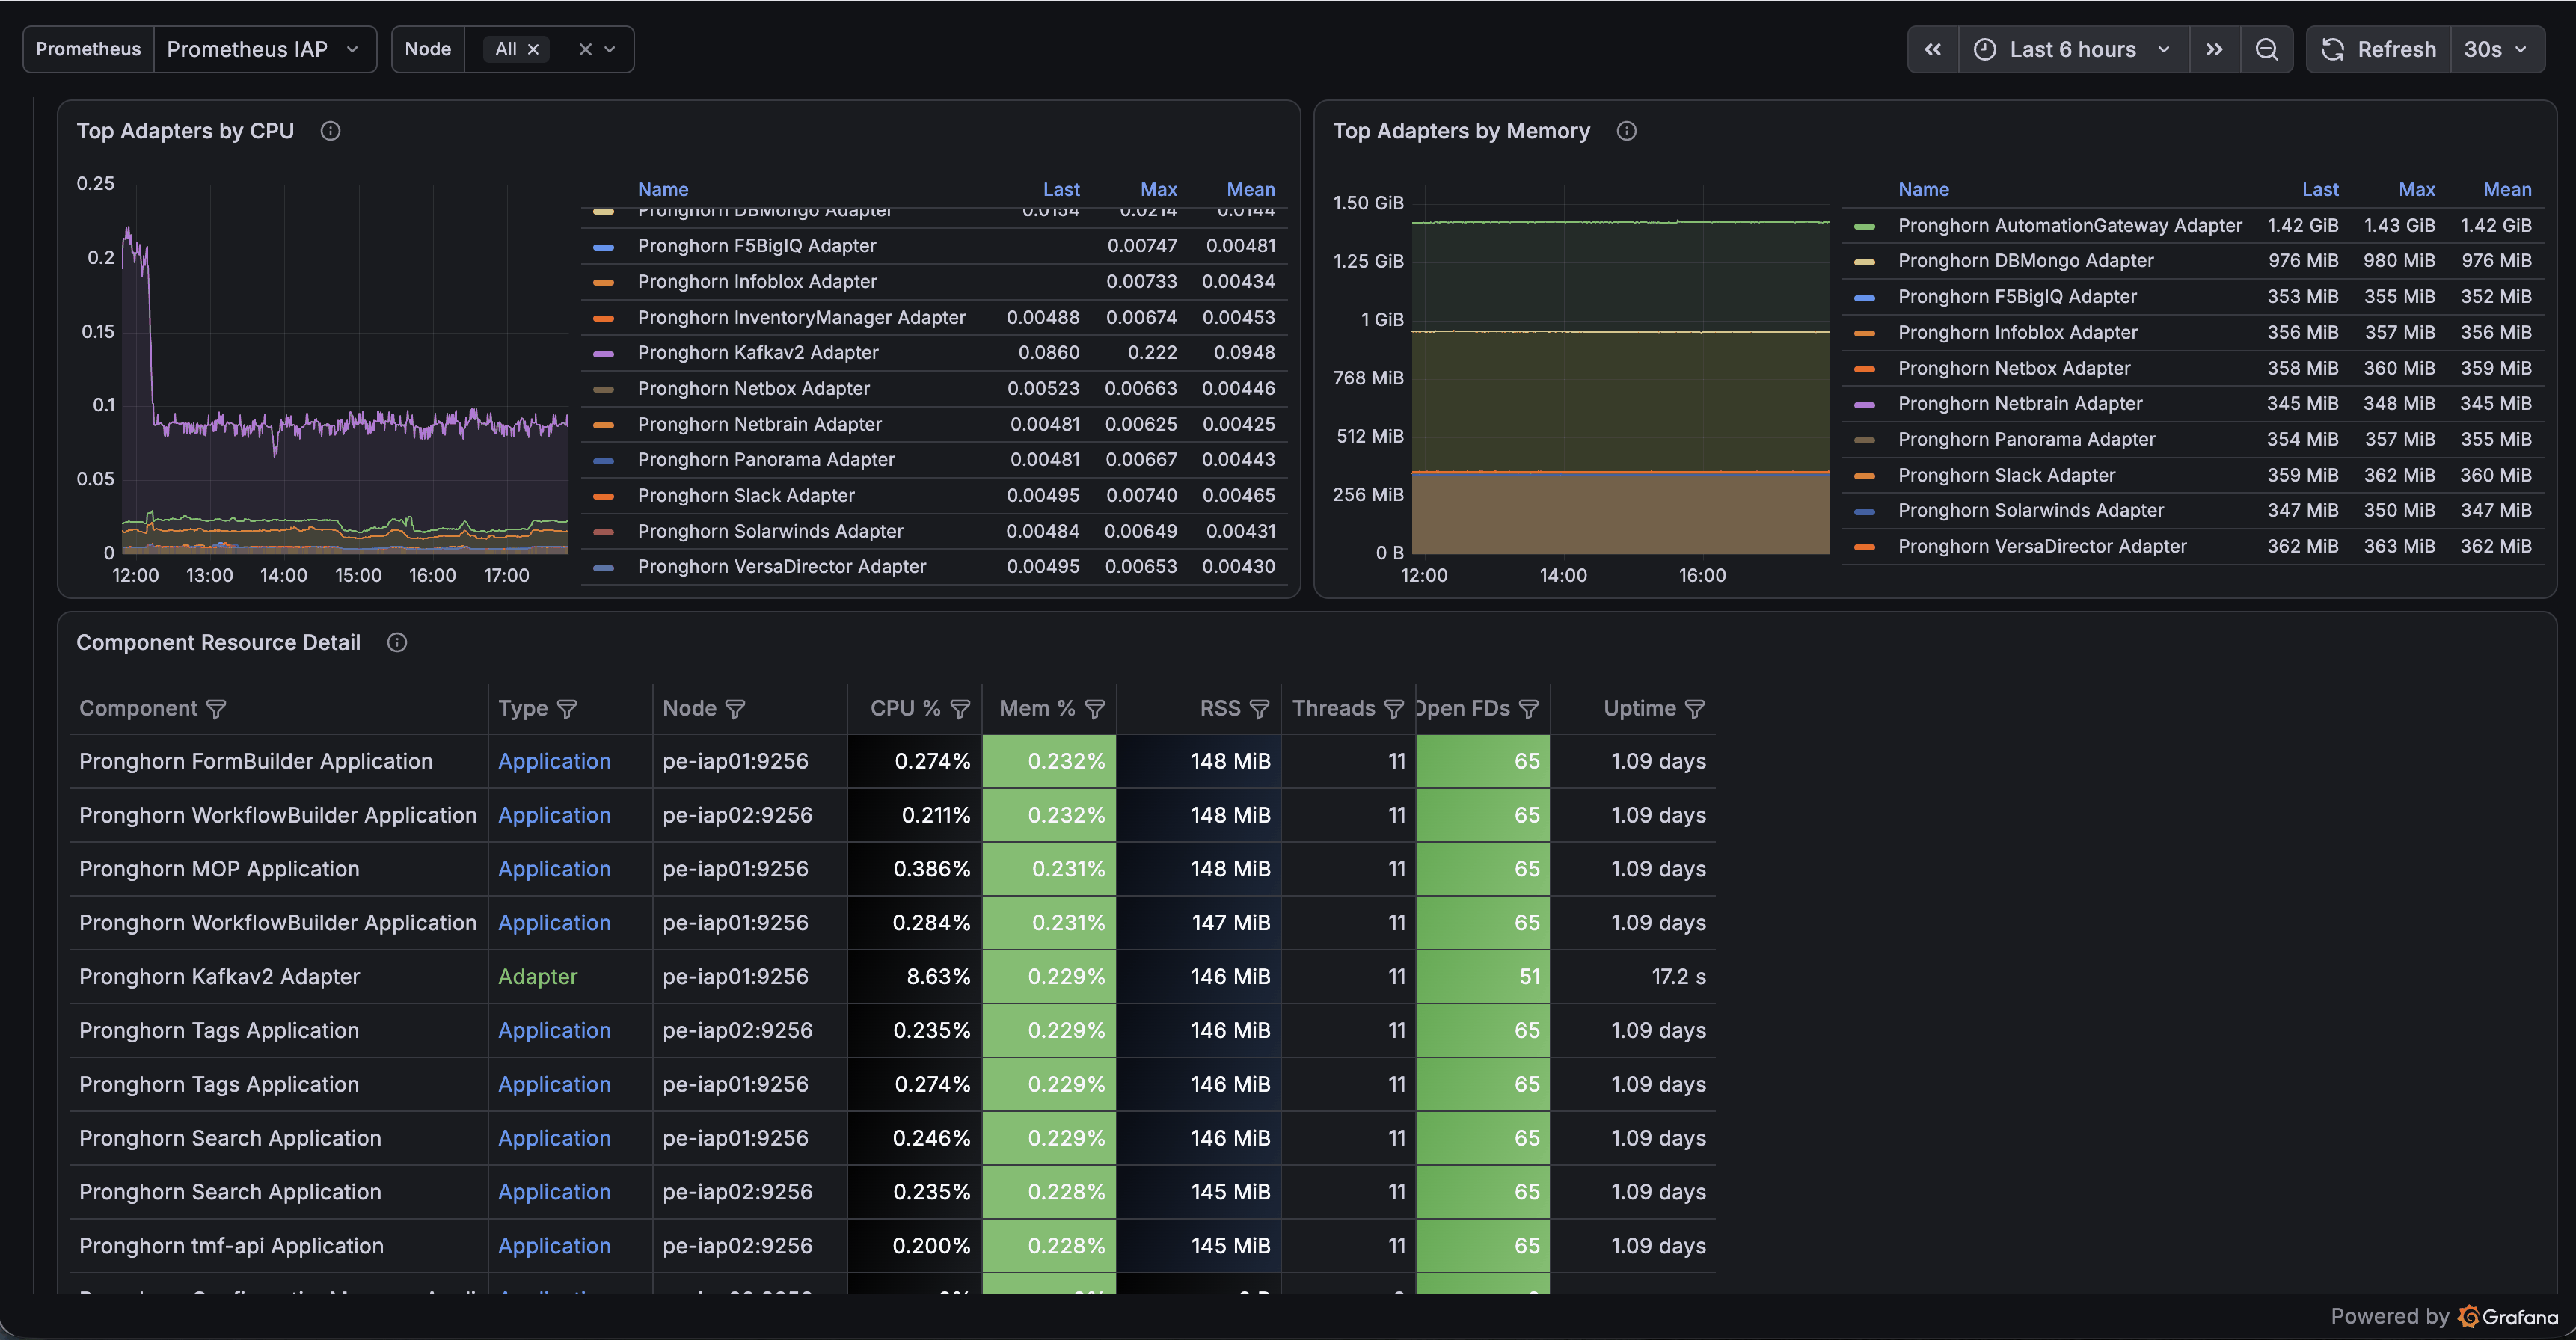
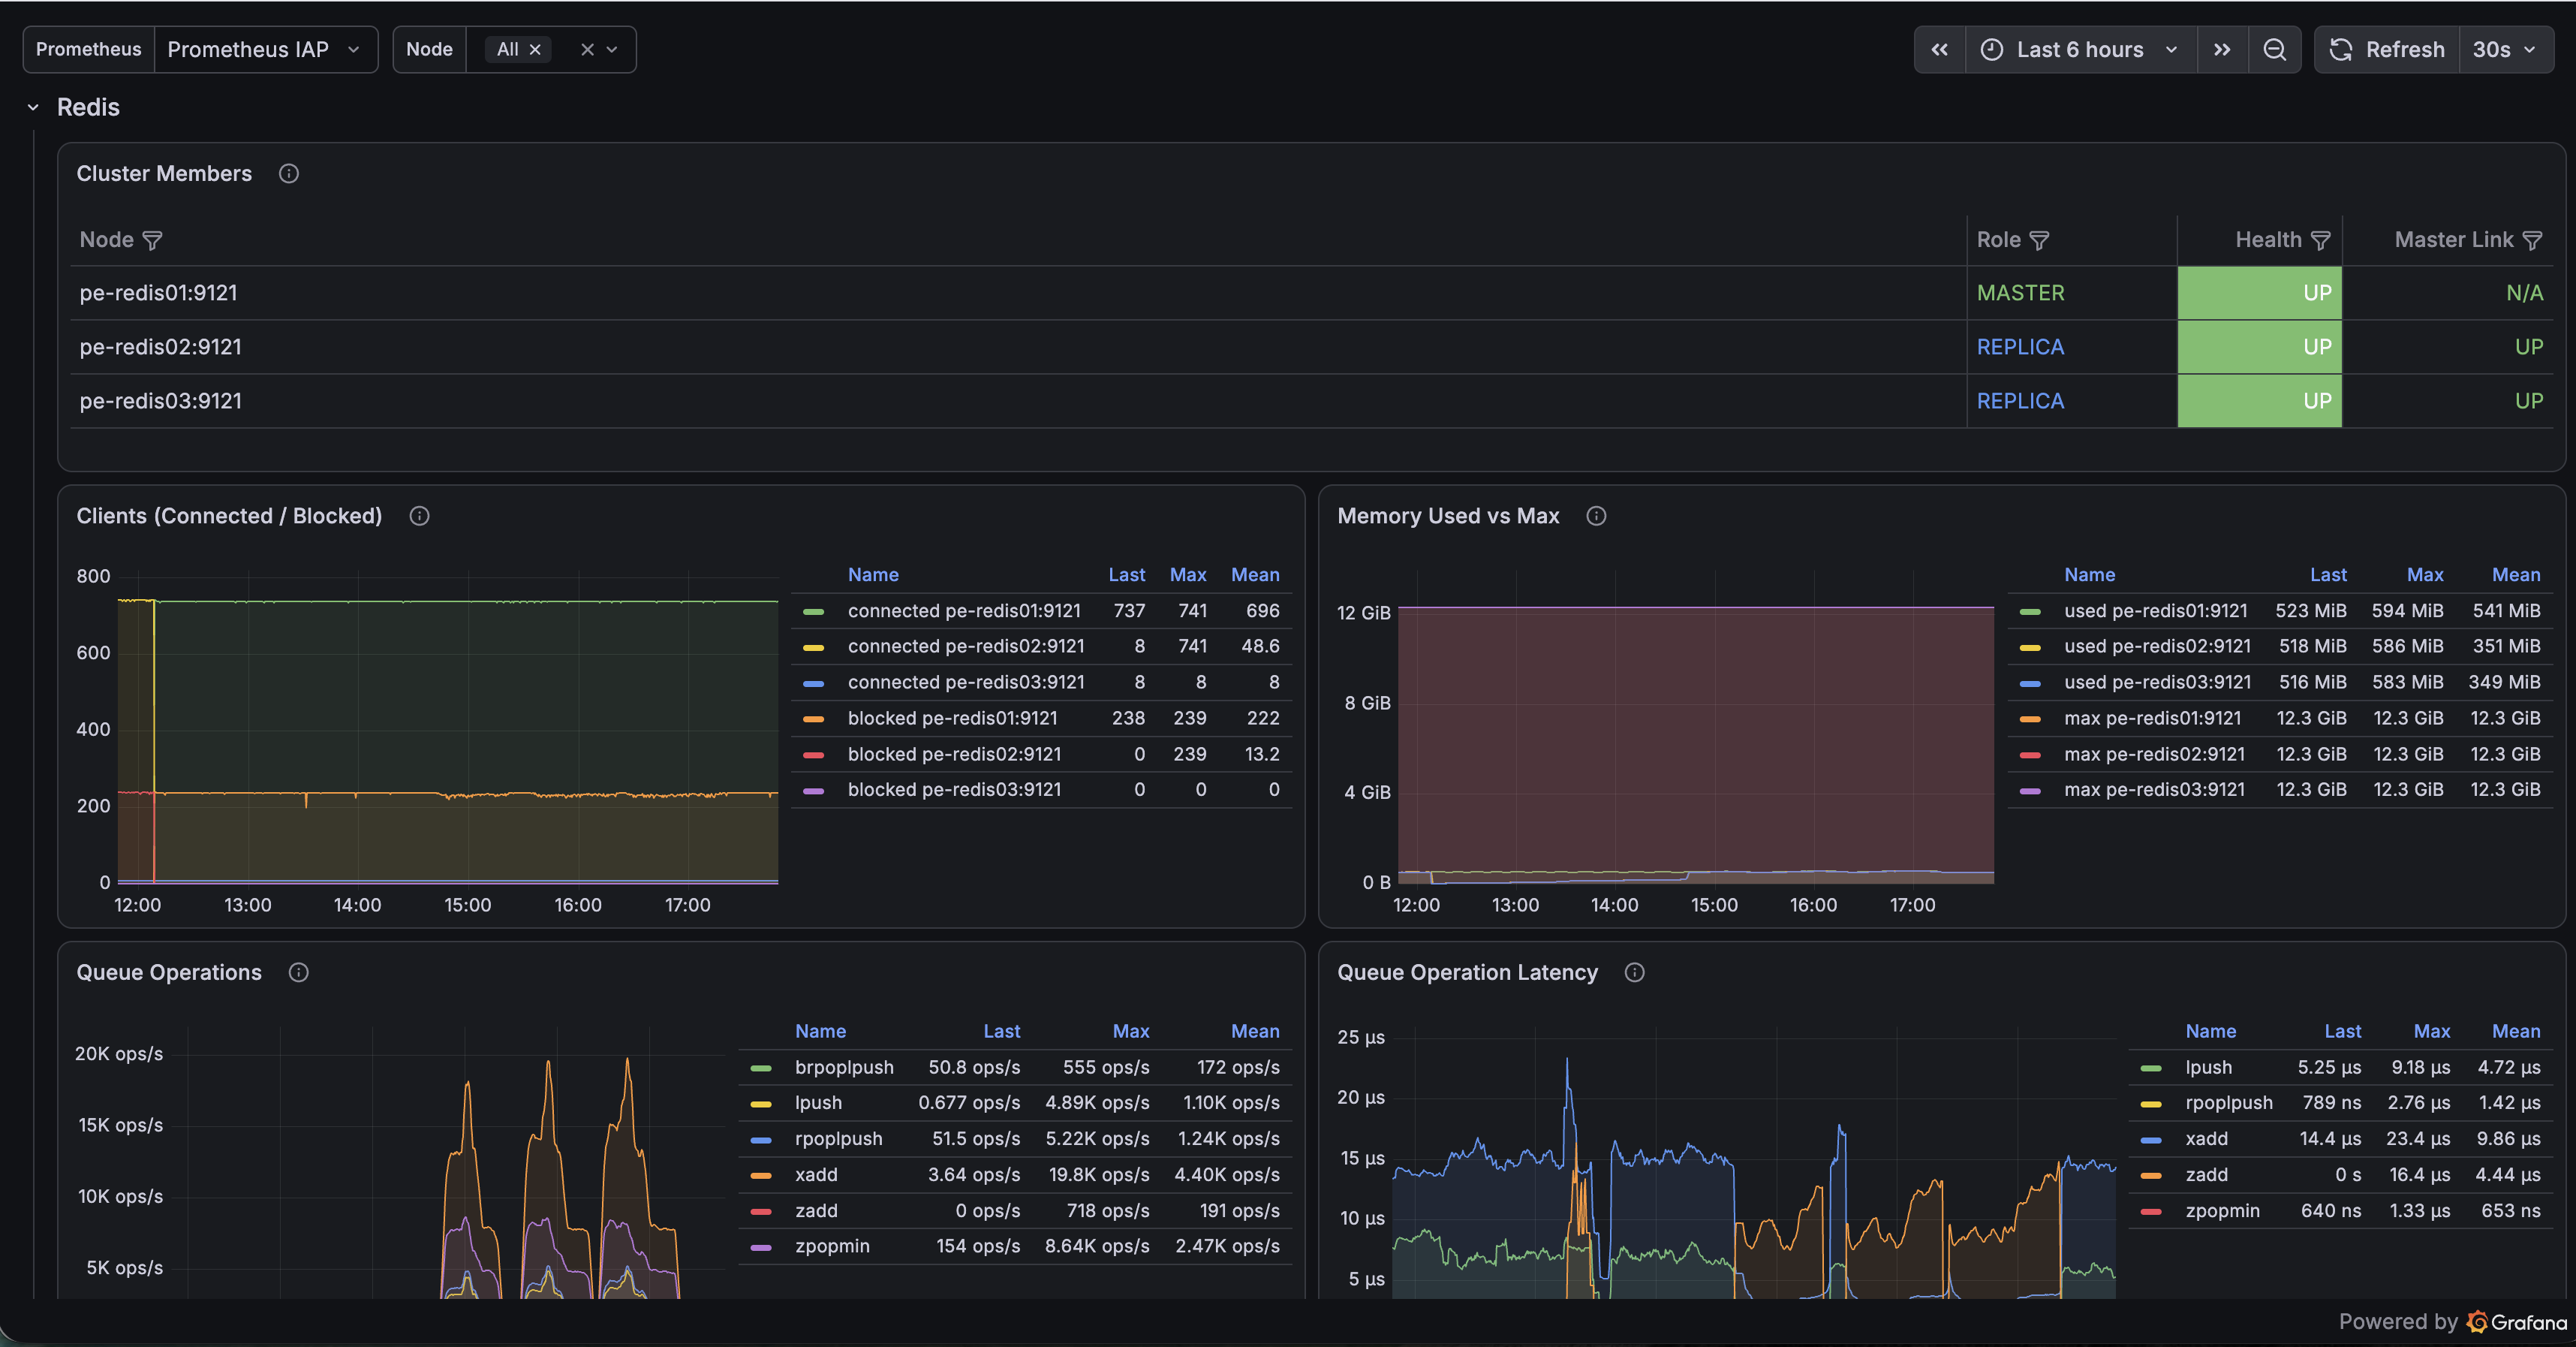
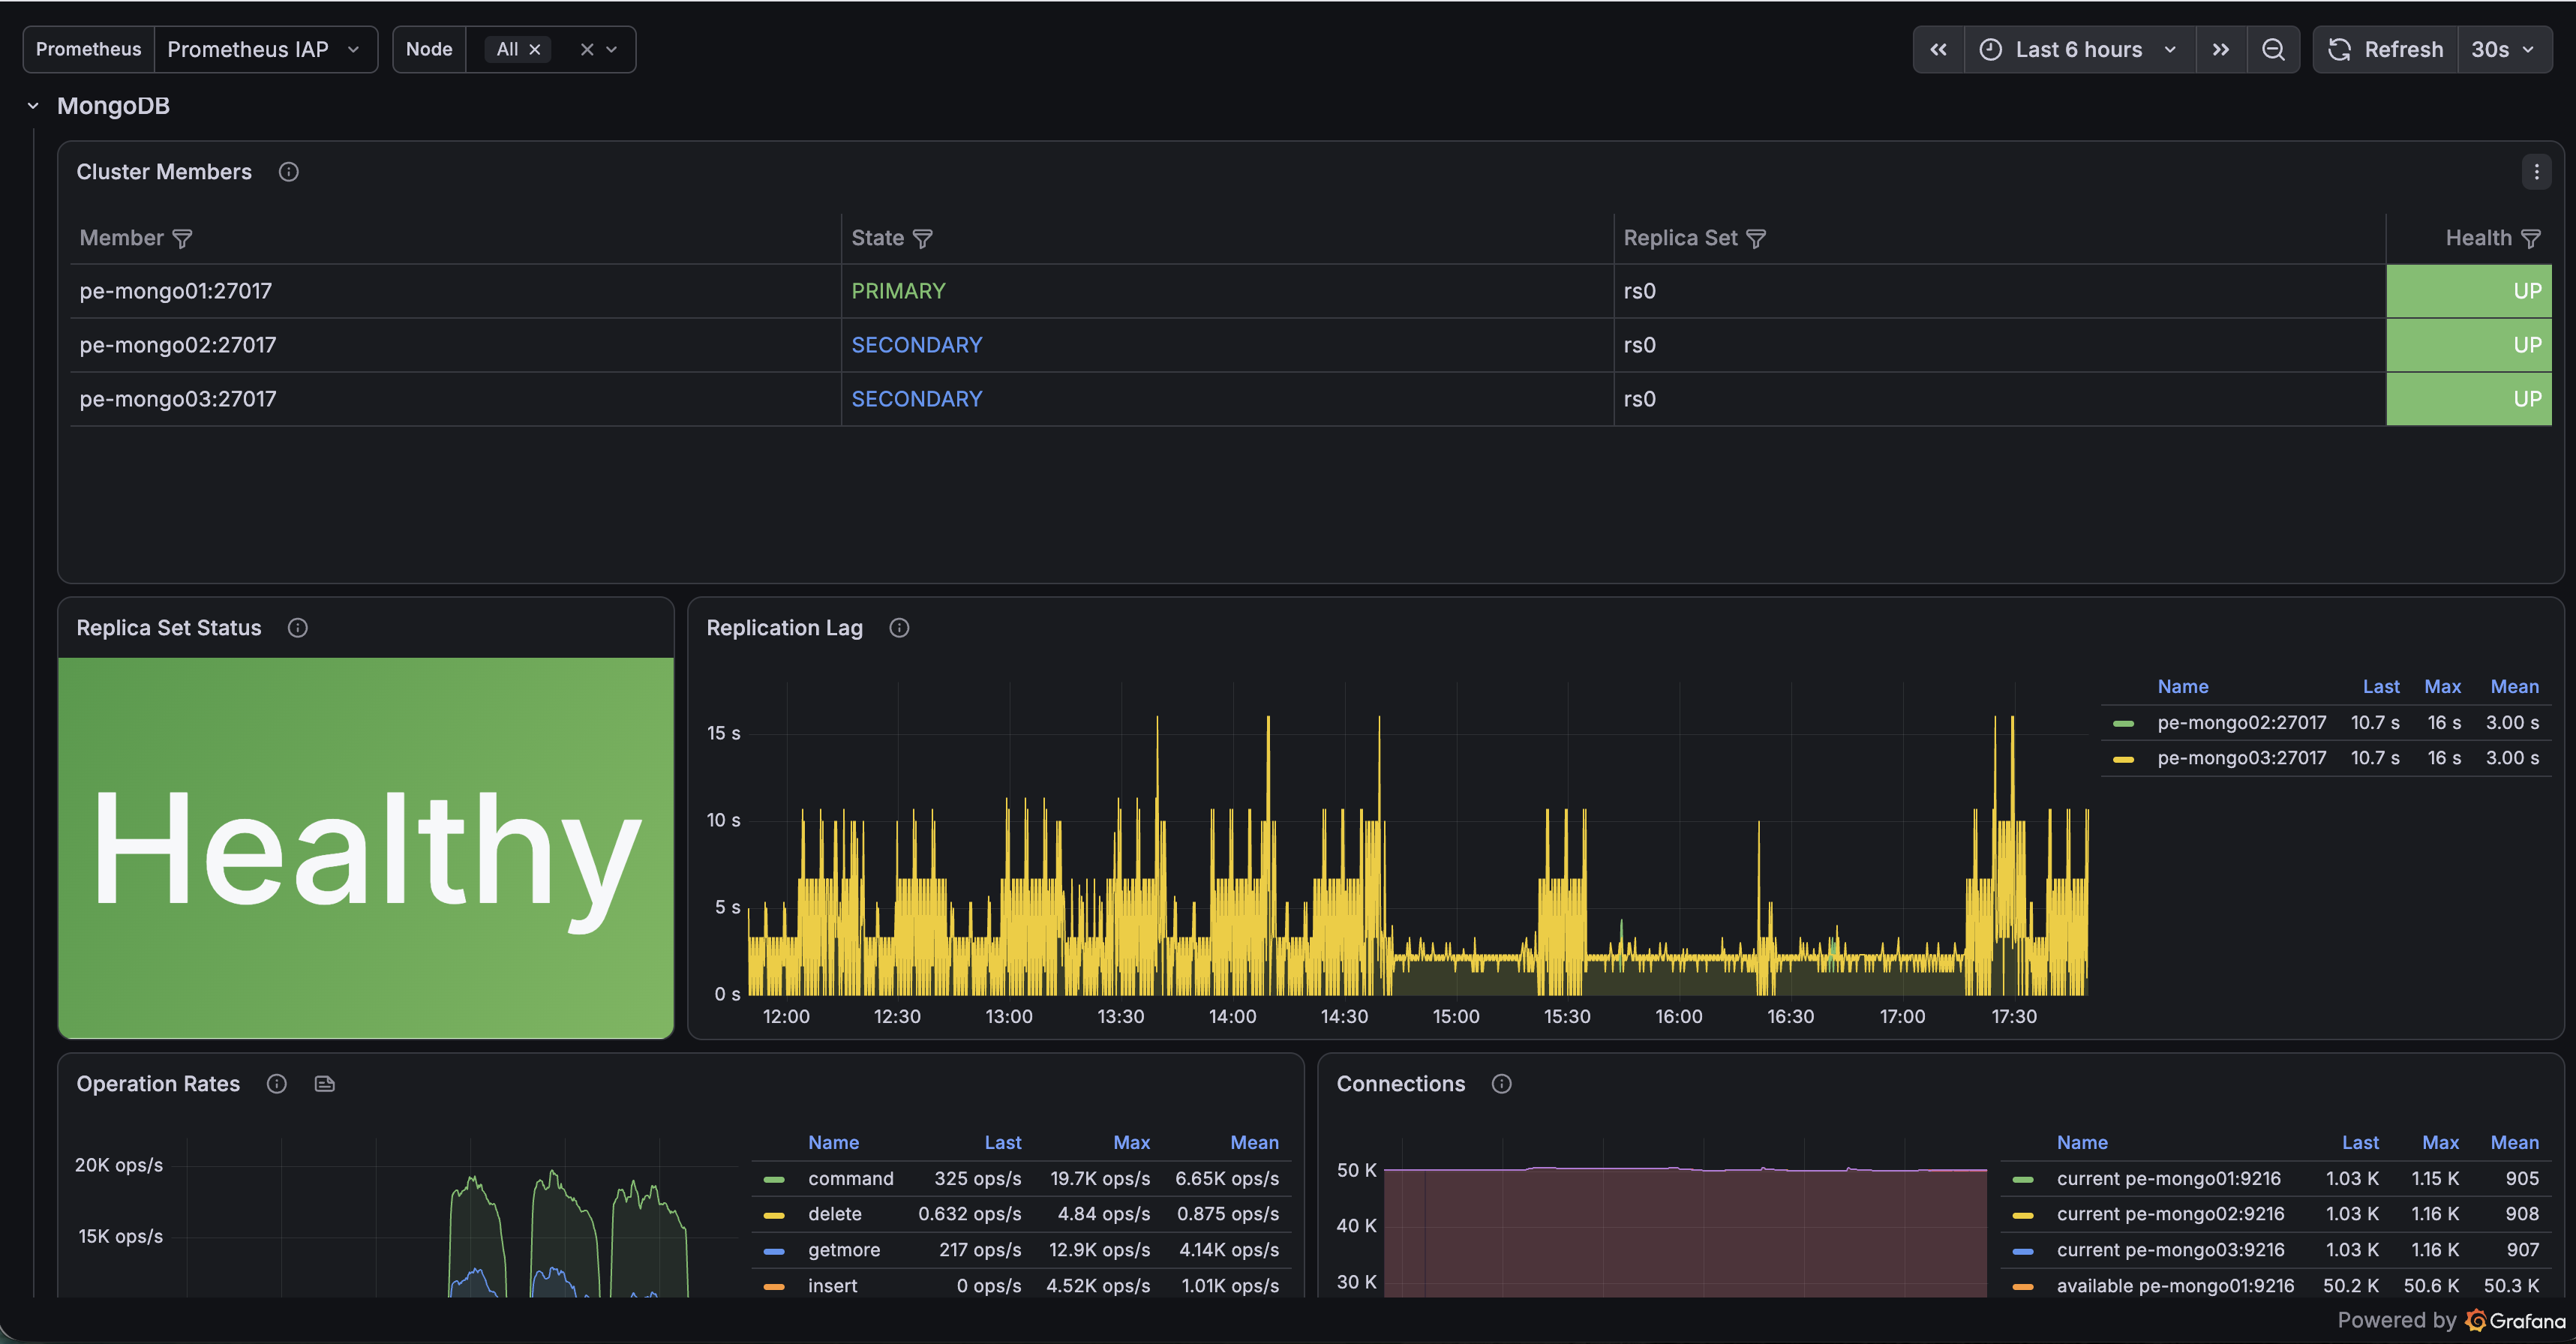
Monitor an Itential Platform on-premises deployment end-to-end: jobs, tasks, platform processes, and the Redis and MongoDB datastores. Prometheus only. No Loki or Elasticsearch required. Import it, pick your datasource, that's it.
What it shows
Overview. Core Platform, Workflow Engine, Redis, and MongoDB each roll up to UP / DEGRADED / DOWN, plus active jobs, job error rate, sessions, API rate, and per-node CPU / RAM / disk.
Workflow Engine. Job lifecycle rates (started / completed / errored / cancelled), success rate, jobs in progress, records by status, task throughput and per-server distribution, and task-error health.
Platform Process. Per-component Node.js health: V8 heap, process CPU, and a resource table covering CPU, memory share, RSS, threads, FDs, and uptime. Includes top applications and adapters.
Redis. Cluster members with replication-link health, connected vs blocked clients, memory, queue ops and latency, commands/sec, keys, and network I/O.
MongoDB. Replica-set members and status, replication lag, op rates, connections, WiredTiger cache, and page faults.
Requirements
Grafana 10+ and Prometheus scraping these exporters, with these job labels:
| Exporter | job label |
|---|---|
| Platform application exporter | iap_exporter |
| Workflow Engine metrics exporter | wfe-metrics |
| node_exporter (platform and datastore nodes) | node_exporter |
| process_exporter (platform nodes) | process_exporter |
| redis_exporter | redis_exporter |
| mongodb_exporter | mongo_exporter |
If an exporter is absent, only its panels are affected. The Platform Process section expects process_exporter to group platform processes under names prefixed Pronghorn.
Usage
Import, then select your Prometheus datasource from the dropdown. Every query uses that variable. Nothing is hardcoded. Use the Node dropdown to focus infrastructure panels on one host.
Health roll-ups are cluster-aware. Redis reads DOWN only when no master is reachable, and MongoDB only when no primary is elected, so a single downed replica shows DEGRADED rather than a false outage. Every panel carries a description of what it measures, what normal looks like, and what to investigate.
Data source config
Collector config:
Upload an updated version of an exported dashboard.json file from Grafana
| Revision | Description | Created | |
|---|---|---|---|
| Download |