
n8n Workflow Traces
Monitor n8n workflow and node executions via OpenTelemetry traces with Grafana Tempo. Requires n8n 2.19+
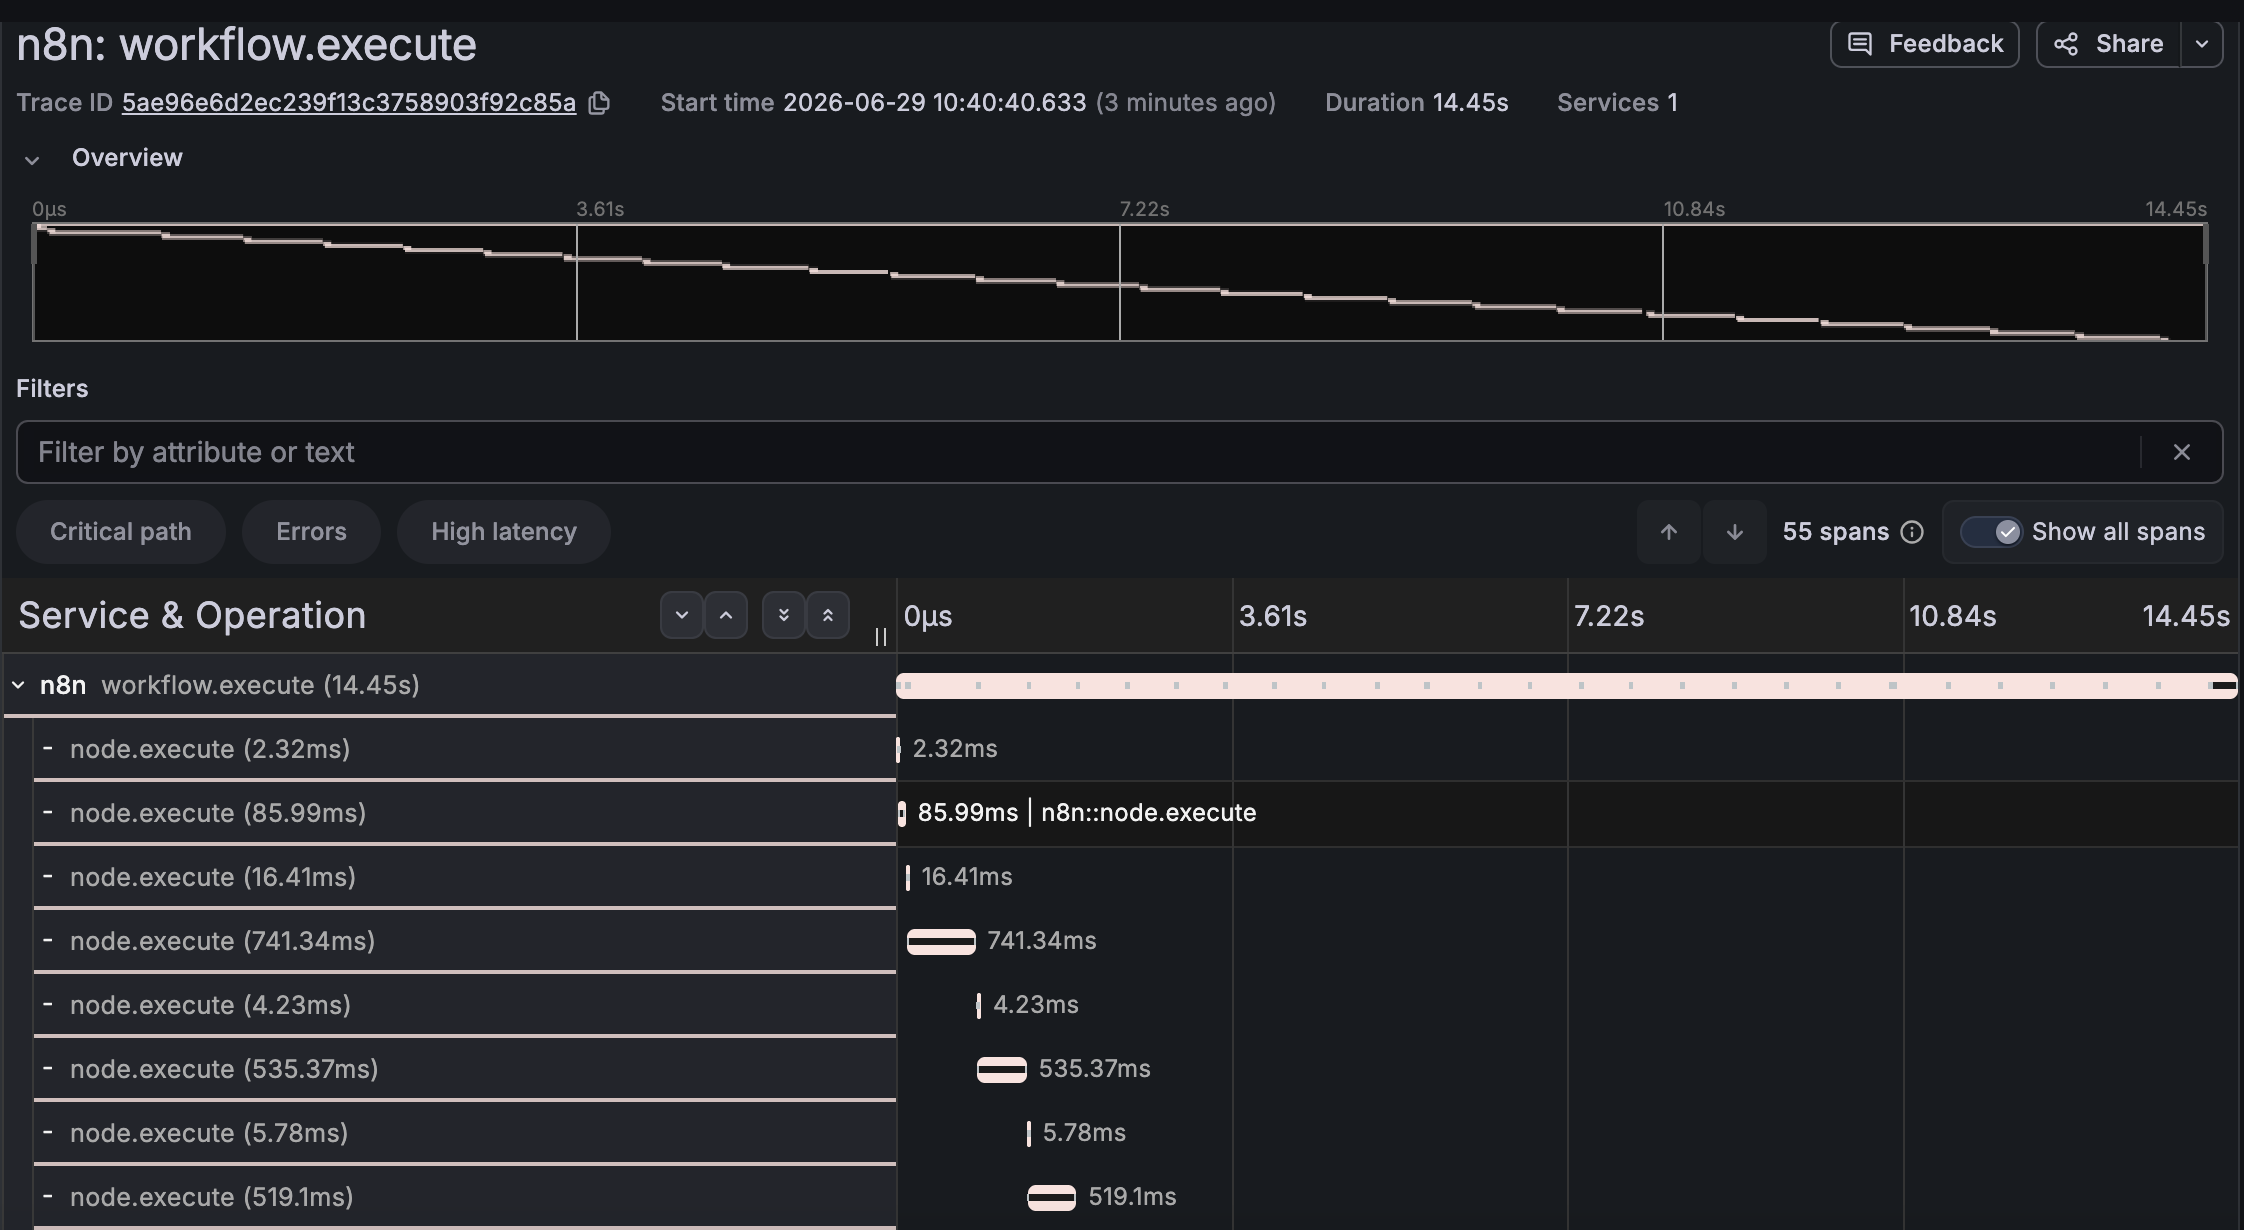
n8n Workflow Traces Dashboard
Monitor n8n workflow and node executions using OpenTelemetry traces with Grafana Tempo. This dashboard gives you full visibility into what happens inside each workflow execution — which nodes ran, how long they took, and where failures occurred.
> Requires n8n 2.19+ · Self-hosted only
What are traces and why do you need them?
n8n shows you whether a workflow execution succeeded or failed. Traces tell you why and how.
When tracing is enabled, n8n emits an OpenTelemetry span for every workflow execution (workflow.execute) and for every node within it (node.execute). Each span contains timing data, status, and metadata such as the workflow name, node type, and error details.
What you can do with traces
Debug failures faster Instead of reading through logs, you can click a failed execution and immediately see which node threw an error and what the exception message was — without needing to reproduce the issue.
Find performance bottlenecks A workflow taking 10 seconds is not useful information on its own. Traces show you that 9 of those seconds were spent in a single HTTP Request node calling a slow external API. That is actionable.
Track request flow across services
If another service calls n8n via webhook and includes a W3C traceparent header, the n8n trace is automatically linked to the upstream trace. You see the full request path across systems in one view.
Monitor production reliability The "Failed Executions" panel gives you a real-time view of which workflows are failing. Combined with Grafana alerting, you can get notified before users report issues.
Audit execution history Every execution is recorded as a trace with a timestamp, workflow name, execution mode (manual, webhook, trigger), and outcome. This gives you a searchable audit trail without any additional tooling.
Dashboard panels
| Panel | Description |
|---|---|
| All Workflow Executions | List of recent executions with Trace ID, start time, and duration. Click any Trace ID to open the full span detail view in Explore. |
| Failed Executions | Filtered view showing only executions with status = error. |
| Slowest Workflows | Workflow-level spans sorted by duration. Color-coded: green < 1s, yellow 1–5s, red > 5s. |
| Slowest Nodes | Node-level spans sorted by duration. Helps identify which node type is the bottleneck across all workflows. |
Requirements
- n8n 2.19 or later (self-hosted)
- Grafana with a Tempo datasource configured
- OpenTelemetry Collector (optional but recommended)
Quick start with Docker Compose
The following setup runs n8n, an OpenTelemetry Collector, Grafana Tempo, and Grafana together.
1. Create docker-compose.yml
services:
  n8n:
    image: n8nio/n8n
    environment:
      N8N_OTEL_ENABLED: "true"
      N8N_OTEL_EXPORTER_OTLP_ENDPOINT: "http://otel-collector:4318"
      OTEL_SERVICE_NAME: "n8n"
      N8N_OTEL_TRACES_PRODUCTION_ONLY: "false"
    ports:
      - "5678:5678"
    volumes:
      - n8n_data:/home/node/.n8n
    restart: on-failure
    depends_on:
      - otel-collector
otel-collector:
image: otel/opentelemetry-collector-contrib
volumes:
- ./otel-collector.yaml:/etc/otelcol-contrib/config.yaml
ports:
- "4317:4317"
- "4318:4318"
depends_on:
- tempo
tempo:
image: grafana/tempo:latest
user: "0"
volumes:
- ./tempo.yaml:/etc/tempo.yaml
- tempo_data:/tmp/tempo
command: ["-config.file=/etc/tempo.yaml"]
ports:
- "3200:3200"
grafana:
image: grafana/grafana:latest
ports:
- "3000:3000"
environment:
GF_AUTH_ANONYMOUS_ENABLED: "true"
GF_AUTH_ANONYMOUS_ORG_ROLE: "Admin"
volumes:
- grafana_data:/var/lib/grafana
depends_on:
- tempo
volumes:
n8n_data:
tempo_data:
grafana_data:
2. Create otel-collector.yaml
extensions:
  health_check:
    endpoint: 0.0.0.0:13133
receivers:
otlp:
protocols:
http:
endpoint: 0.0.0.0:4318
grpc:
endpoint: 0.0.0.0:4317
exporters:
otlp:
endpoint: tempo:4317
tls:
insecure: true
service:
extensions: [health_check]
pipelines:
traces:
receivers: [otlp]
exporters: [otlp]
3. Create tempo.yaml
server:
  http_listen_port: 3200
distributor:
receivers:
otlp:
protocols:
grpc:
endpoint: 0.0.0.0:4317
storage:
trace:
backend: local
local:
path: /tmp/tempo/blocks
wal:
path: /tmp/tempo/wal
query_frontend:
search:
duration_slo: 5s
4. Start the stack
docker compose up -d
5. Configure Grafana
Open Grafana at http://localhost:3000 and add Tempo as a datasource:
- Go to Connections → Add new datasource → Tempo
- Set URL to
http://tempo:3200 - Click Save & Test
6. Import the dashboard
- Go to Dashboards → New → Import
- Upload the dashboard JSON or paste the Grafana.com dashboard ID
- Select your Tempo datasource when prompted
7. Run a workflow
Execute any workflow in n8n (http://localhost:5678) and switch back to Grafana. The execution will appear in the dashboard within seconds.
Environment variables reference
| Variable | Default | Description |
|---|---|---|
N8N_OTEL_ENABLED | false | Enables OpenTelemetry tracing |
N8N_OTEL_EXPORTER_OTLP_ENDPOINT | — | Base URL of your OTLP collector |
N8N_OTEL_TRACES_PRODUCTION_ONLY | true | Set to false to also trace manual executions |
N8N_OTEL_TRACES_SAMPLE_RATE | 1 | Sampling rate between 0 and 1 |
N8N_OTEL_TRACES_INCLUDE_NODE_SPANS | true | Set to false to emit workflow spans only |
OTEL_SERVICE_NAME | n8n | Service name shown in Tempo and Grafana |
In queue mode, set these variables on every instance (main, worker, webhook processor).
Troubleshooting
No traces appear in Grafana
Check the n8n logs for a startup error:
docker compose logs n8n | grep -i otel
If you see Failed to connect to OpenTelemetry OTLP endpoint during startup, n8n could not reach the collector at startup. Restart n8n after the collector is healthy:
docker compose restart n8n
Dashboard shows "No data"
Make sure the time range in Grafana covers the period when you ran workflows. The default is "Last 1 hour". Also verify that N8N_OTEL_TRACES_PRODUCTION_ONLY is set to false if you are testing with manual executions.
Tempo fails to start with permission error
If you see mkdir /tmp/tempo/blocks: permission denied, add user: "0" to the tempo service in your docker-compose.yml as shown above.
Further resources
- n8n OpenTelemetry documentation
- Grafana Tempo documentation
- OpenTelemetry Collector documentation
- obscademy.com — German-language Grafana & OpenTelemetry training for the DACH region
Data source config
Collector config:
Upload an updated version of an exported dashboard.json file from Grafana
| Revision | Description | Created | |
|---|---|---|---|
| Download |