
HAProxy Service Analytics (Loki Logs)
A comprehensive Grafana dashboard for analyzing HAProxy access logs stored in Loki. This dashboard provides a service-centric view of all applications behind HAProxy, helping operations, DevOps, SRE, and development teams monitor traffic patterns, service health, latency, error rates, and user behavior from a single place.
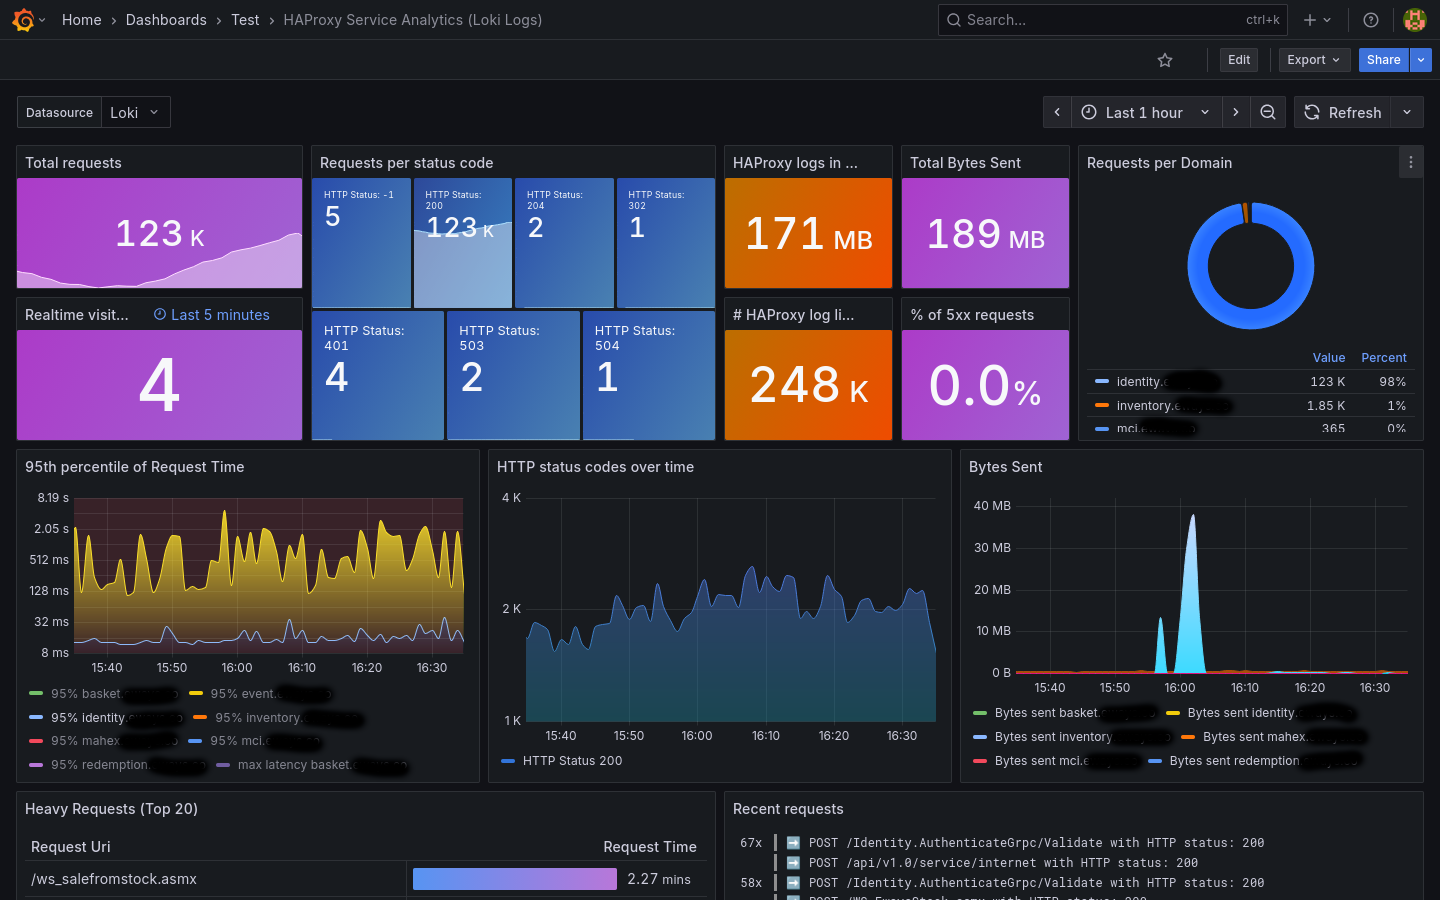
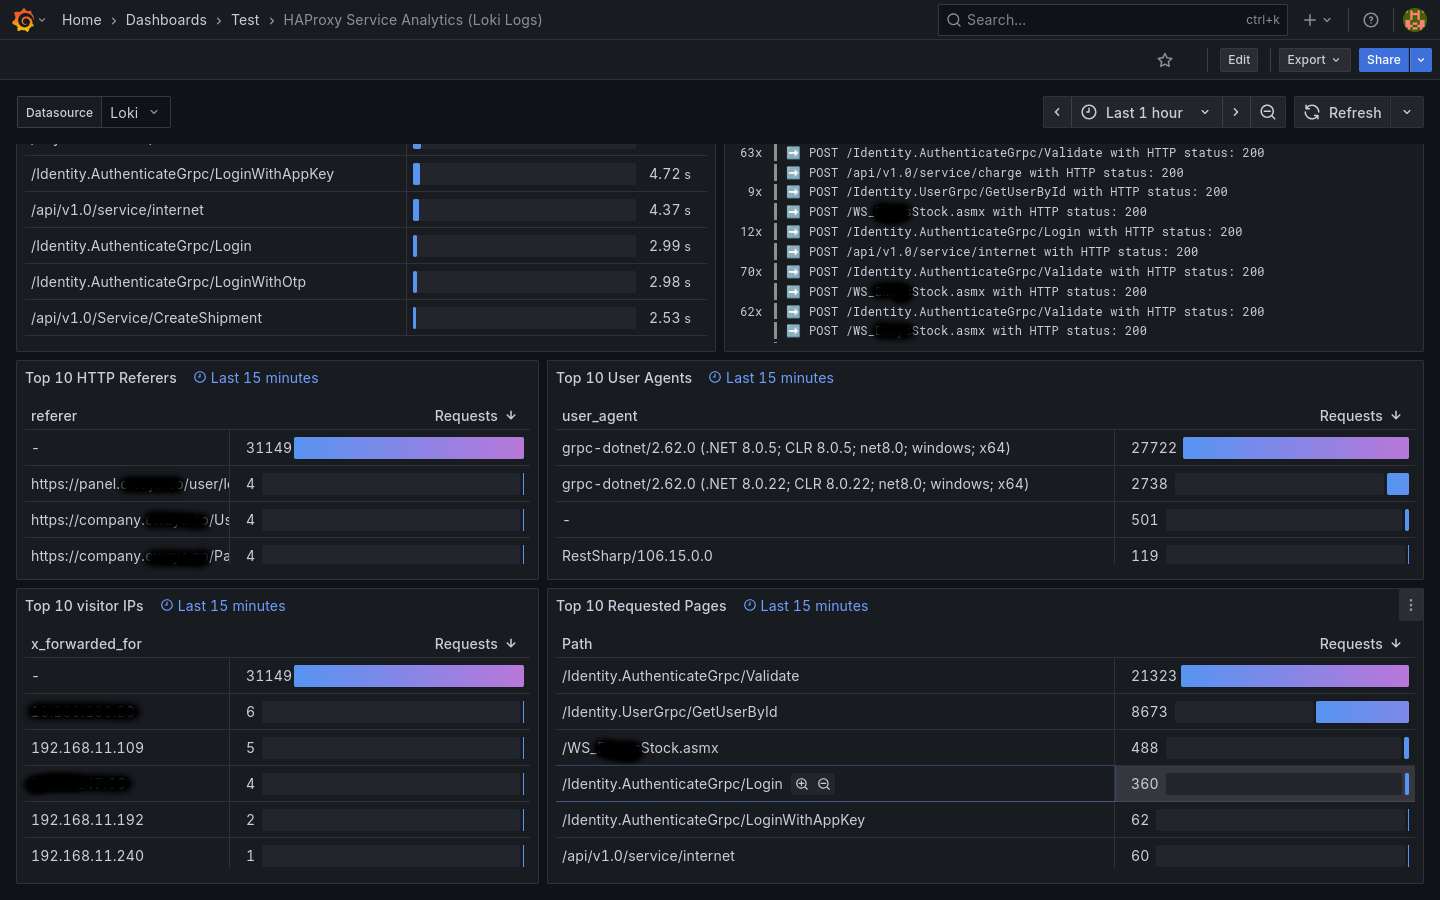
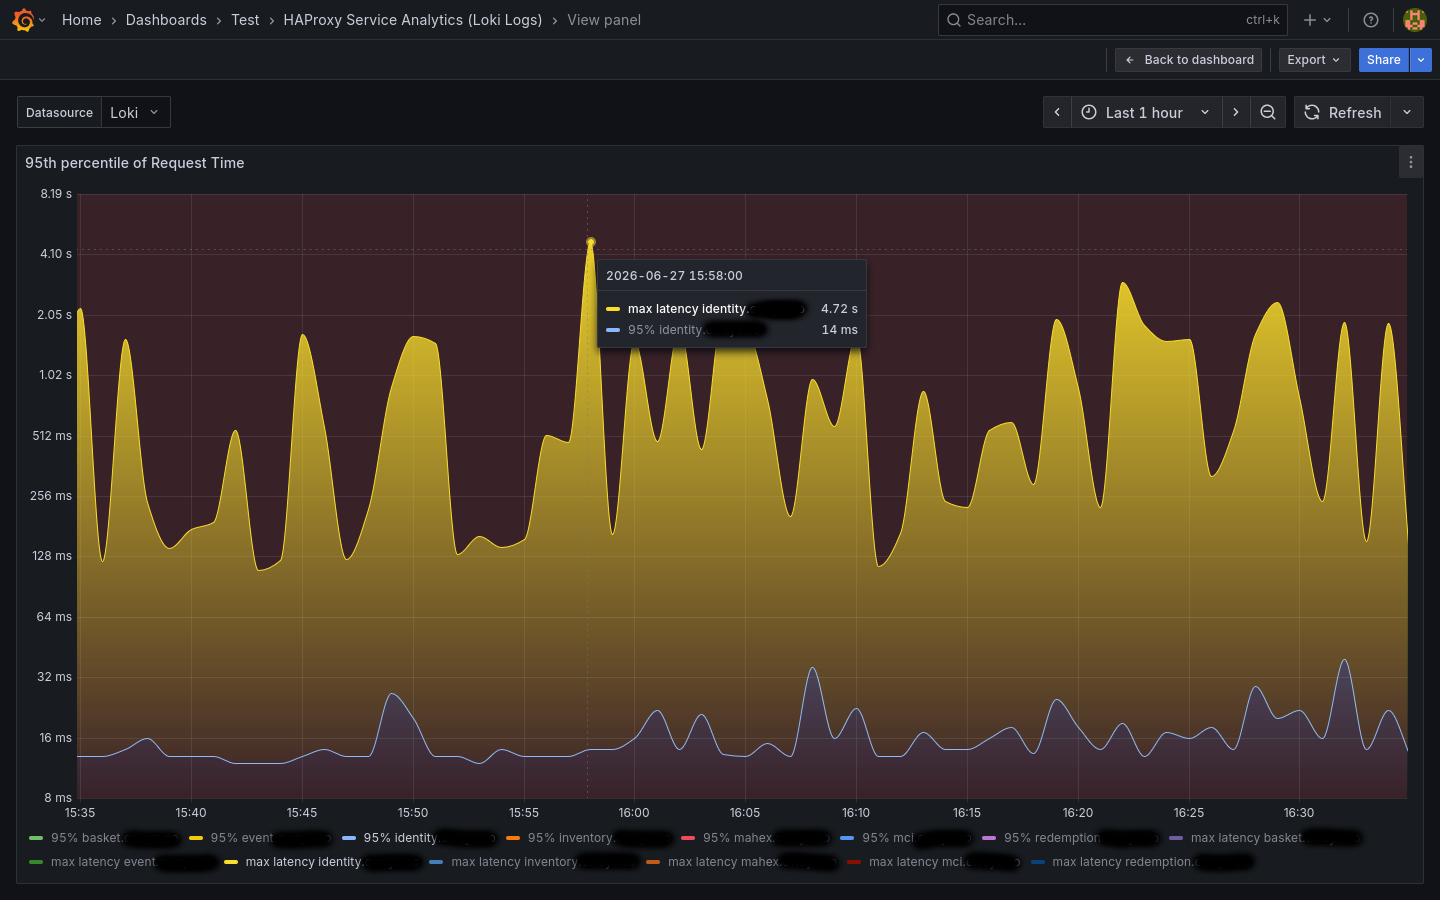
HAProxy Service Analytics (Loki Logs)
A comprehensive Grafana dashboard for analyzing HAProxy access logs stored in Loki.
This dashboard provides a service-centric view of all applications behind HAProxy, helping operations, DevOps, SRE, and development teams monitor traffic patterns, service health, latency, error rates, and user behavior from a single place.
Features
- Total request volume and real-time visitor statistics
- HTTP status code distribution and trends over time
- 5xx error rate monitoring
- Request distribution by domain/host
- Traffic volume and bytes transferred per application
- 95th percentile response time and maximum request latency
- Detection of slow and heavy requests
- Top requested pages and endpoints
- Top visitor IP addresses
- Top user agents and HTTP referrers
- Recent request stream for quick troubleshooting
- Use Cases
- Monitor application availability and service quality
- Detect traffic spikes and unusual request patterns
- Identify slow endpoints and performance bottlenecks
- Investigate HTTP errors and failed requests
- Analyze user behavior and traffic sources
- Track bandwidth consumption across hosted applications
The dashboard was inspired by the Loki NGINX Service Mesh dashboard and adapted specifically for HAProxy log formats and fields, with additional queries and improvements focused on real-world production environments.
Installation
Complete installation instructions, required HAProxy configuration, Promtail configuration and sample log format are available in the GitHub repository: HAProxy Service Analytics This repository also contains the latest dashboard version, screenshots, configuration examples, and future updates.
Data source config
Collector config:
Upload an updated version of an exported dashboard.json file from Grafana
| Revision | Description | Created | |
|---|---|---|---|
| Download |

Adobe Analytics

With the Grafana plugin for Adobe Analytics, you can quickly visualize and query your Adobe Analytics data from within Grafana.
Learn more