Azure / Insights / Applications / OTel / HTTP Cumulative
OpenTelemetry dashboard providing HTTP request/response cumulative metrics.
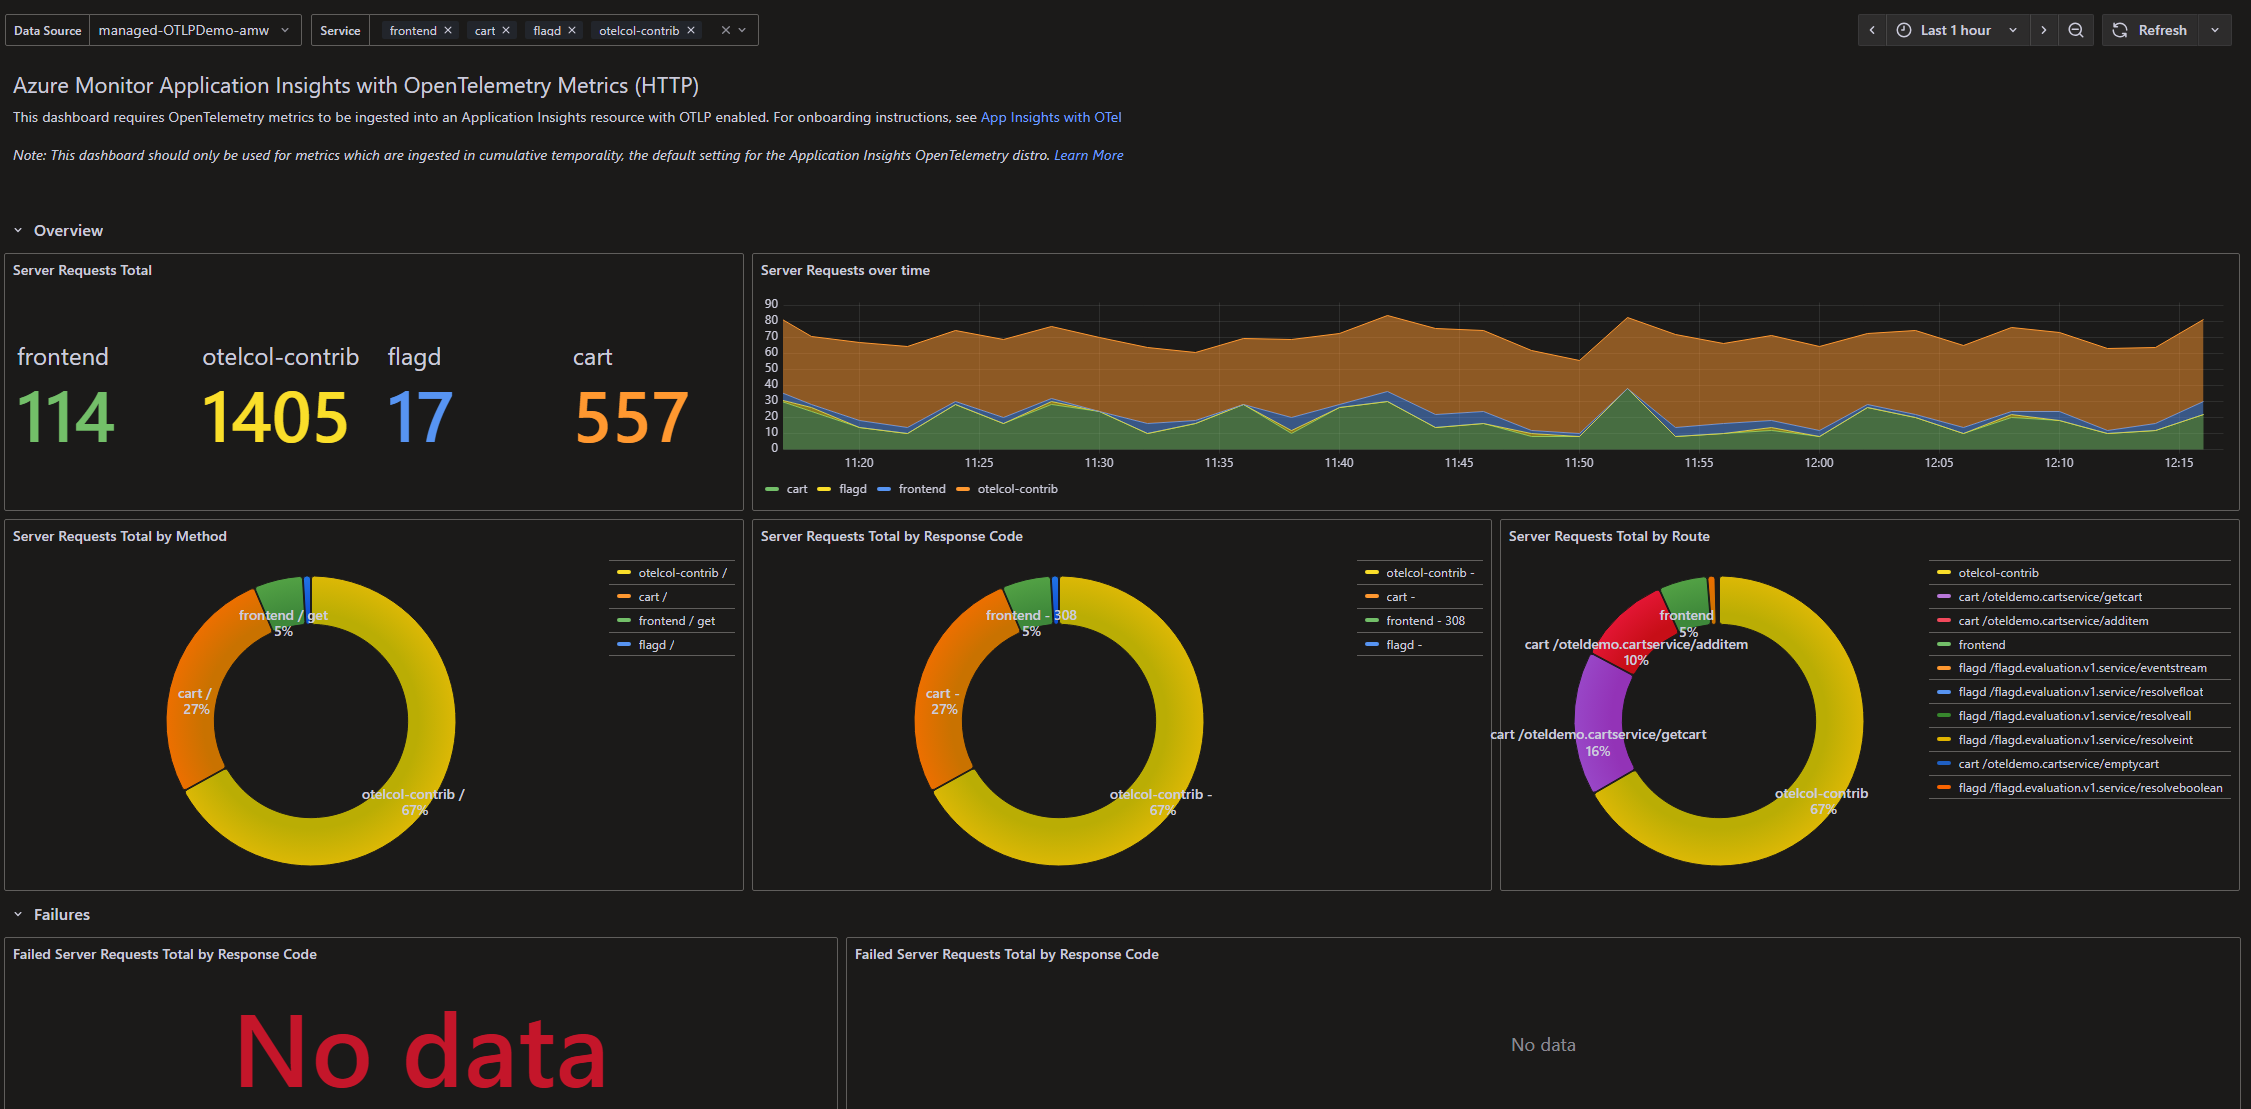
The Azure / Insights / Applications / OTel / HTTP Cumulative dashboard uses the grafana-azure-monitor-datasource and prometheus data sources to create a Grafana dashboard with the bargauge, piechart, stat, table, text and timeseries panels.
Data source config
Collector type:
Collector plugins:
Collector config:
Revisions
Upload an updated version of an exported dashboard.json file from Grafana
| Revision | Description | Created | |
|---|---|---|---|
| Download |
Apache HTTP Server
Easily monitor Apache HTTP Server, an open source HTTP server for modern operating systems including UNIX and Windows, with Grafana Cloud's out-of-the-box monitoring solution.
Learn more