
EdgeGuard — proxy overview
https://github.com/lucheeseng827/eggrd
EdgeGuard — proxy overview
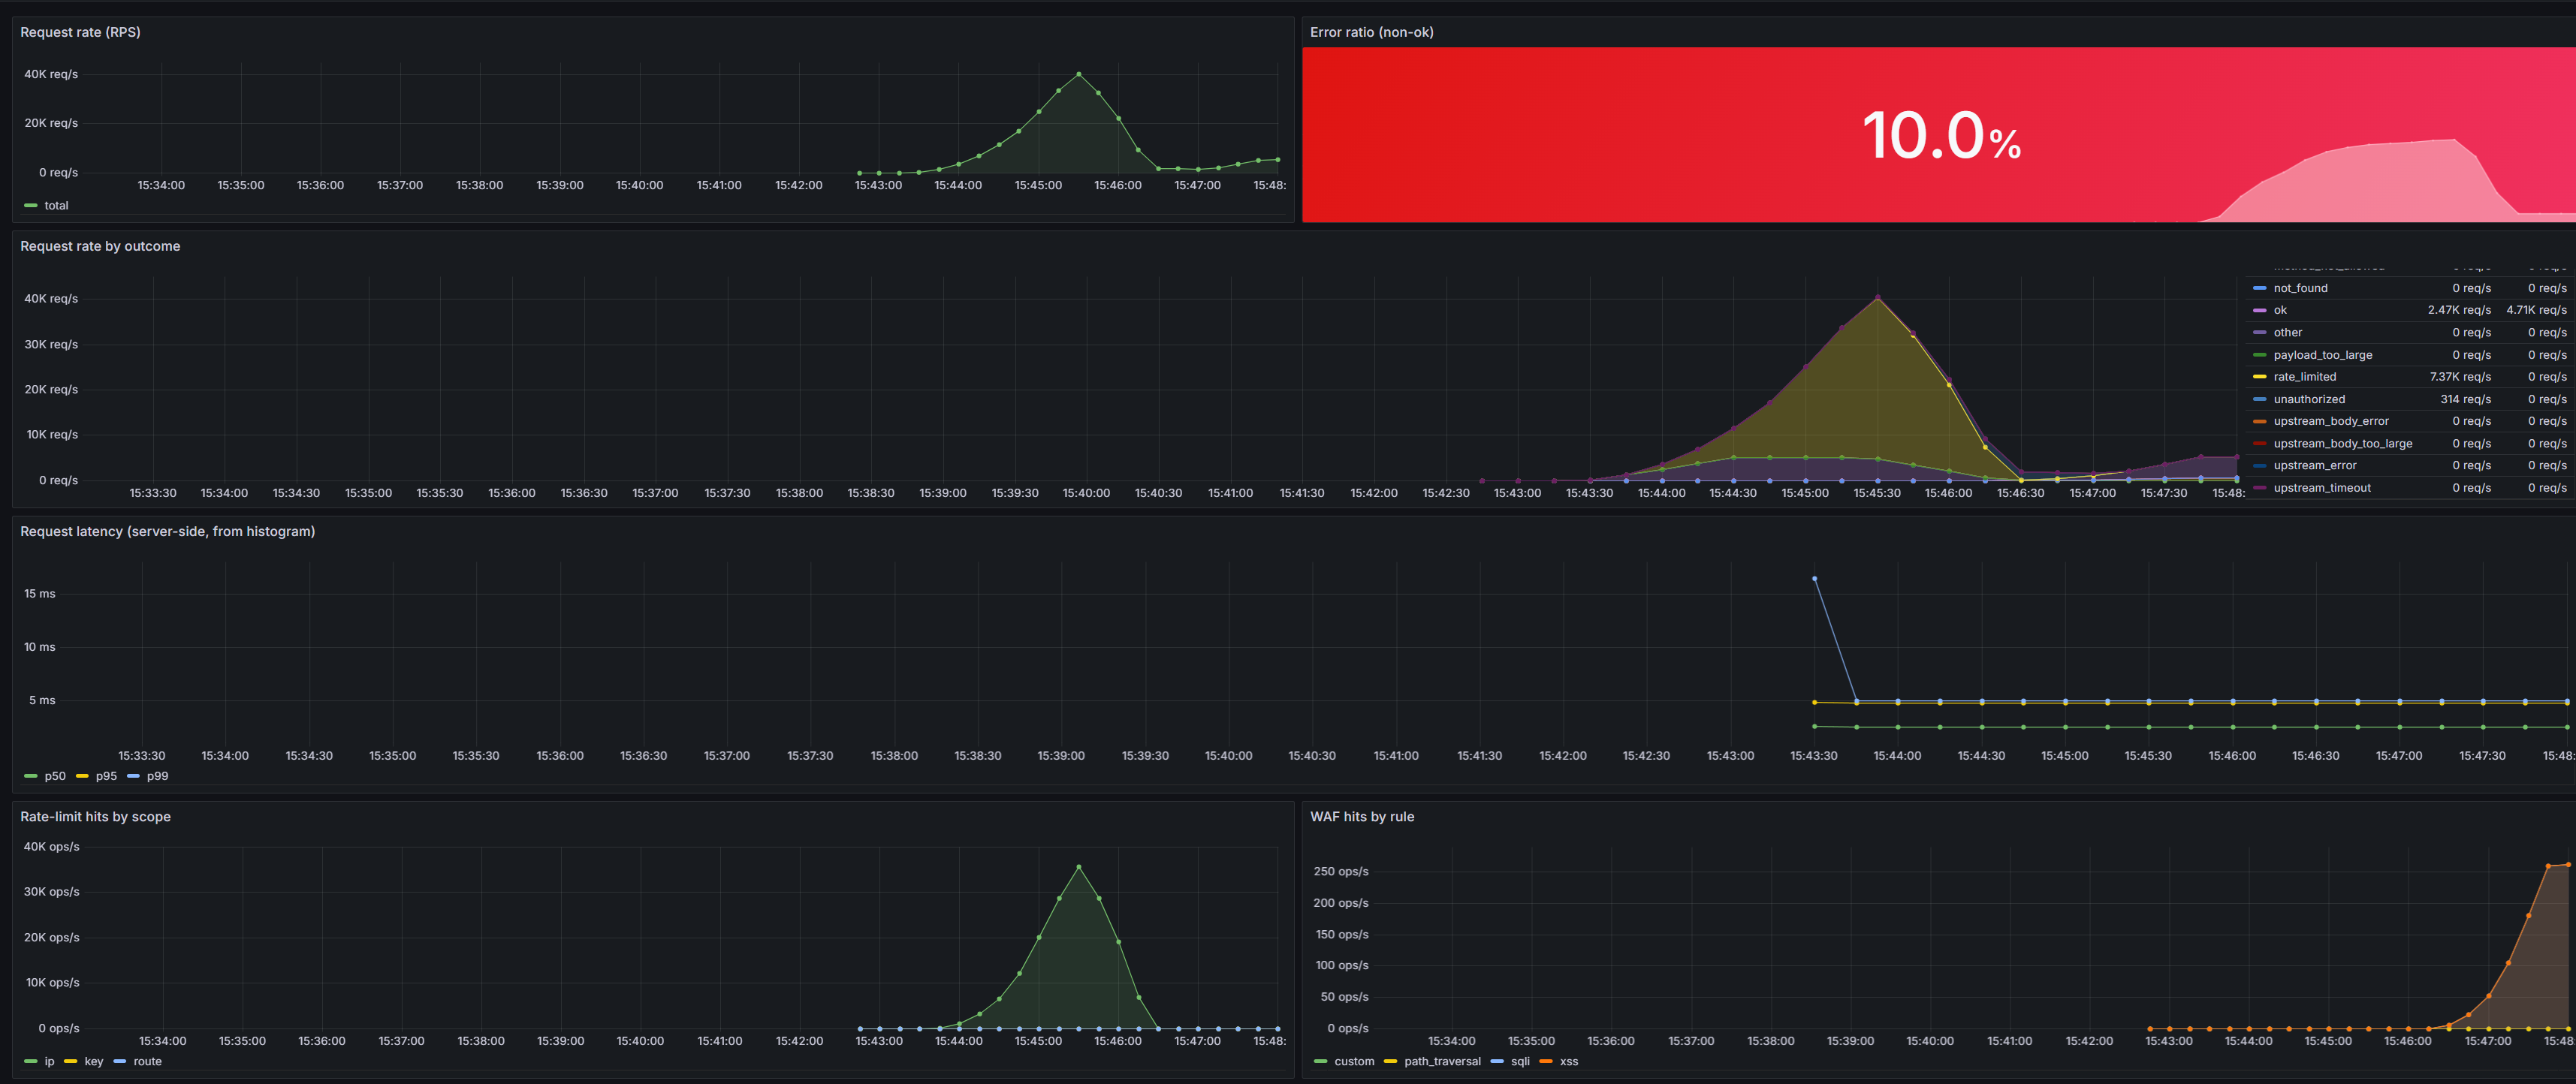
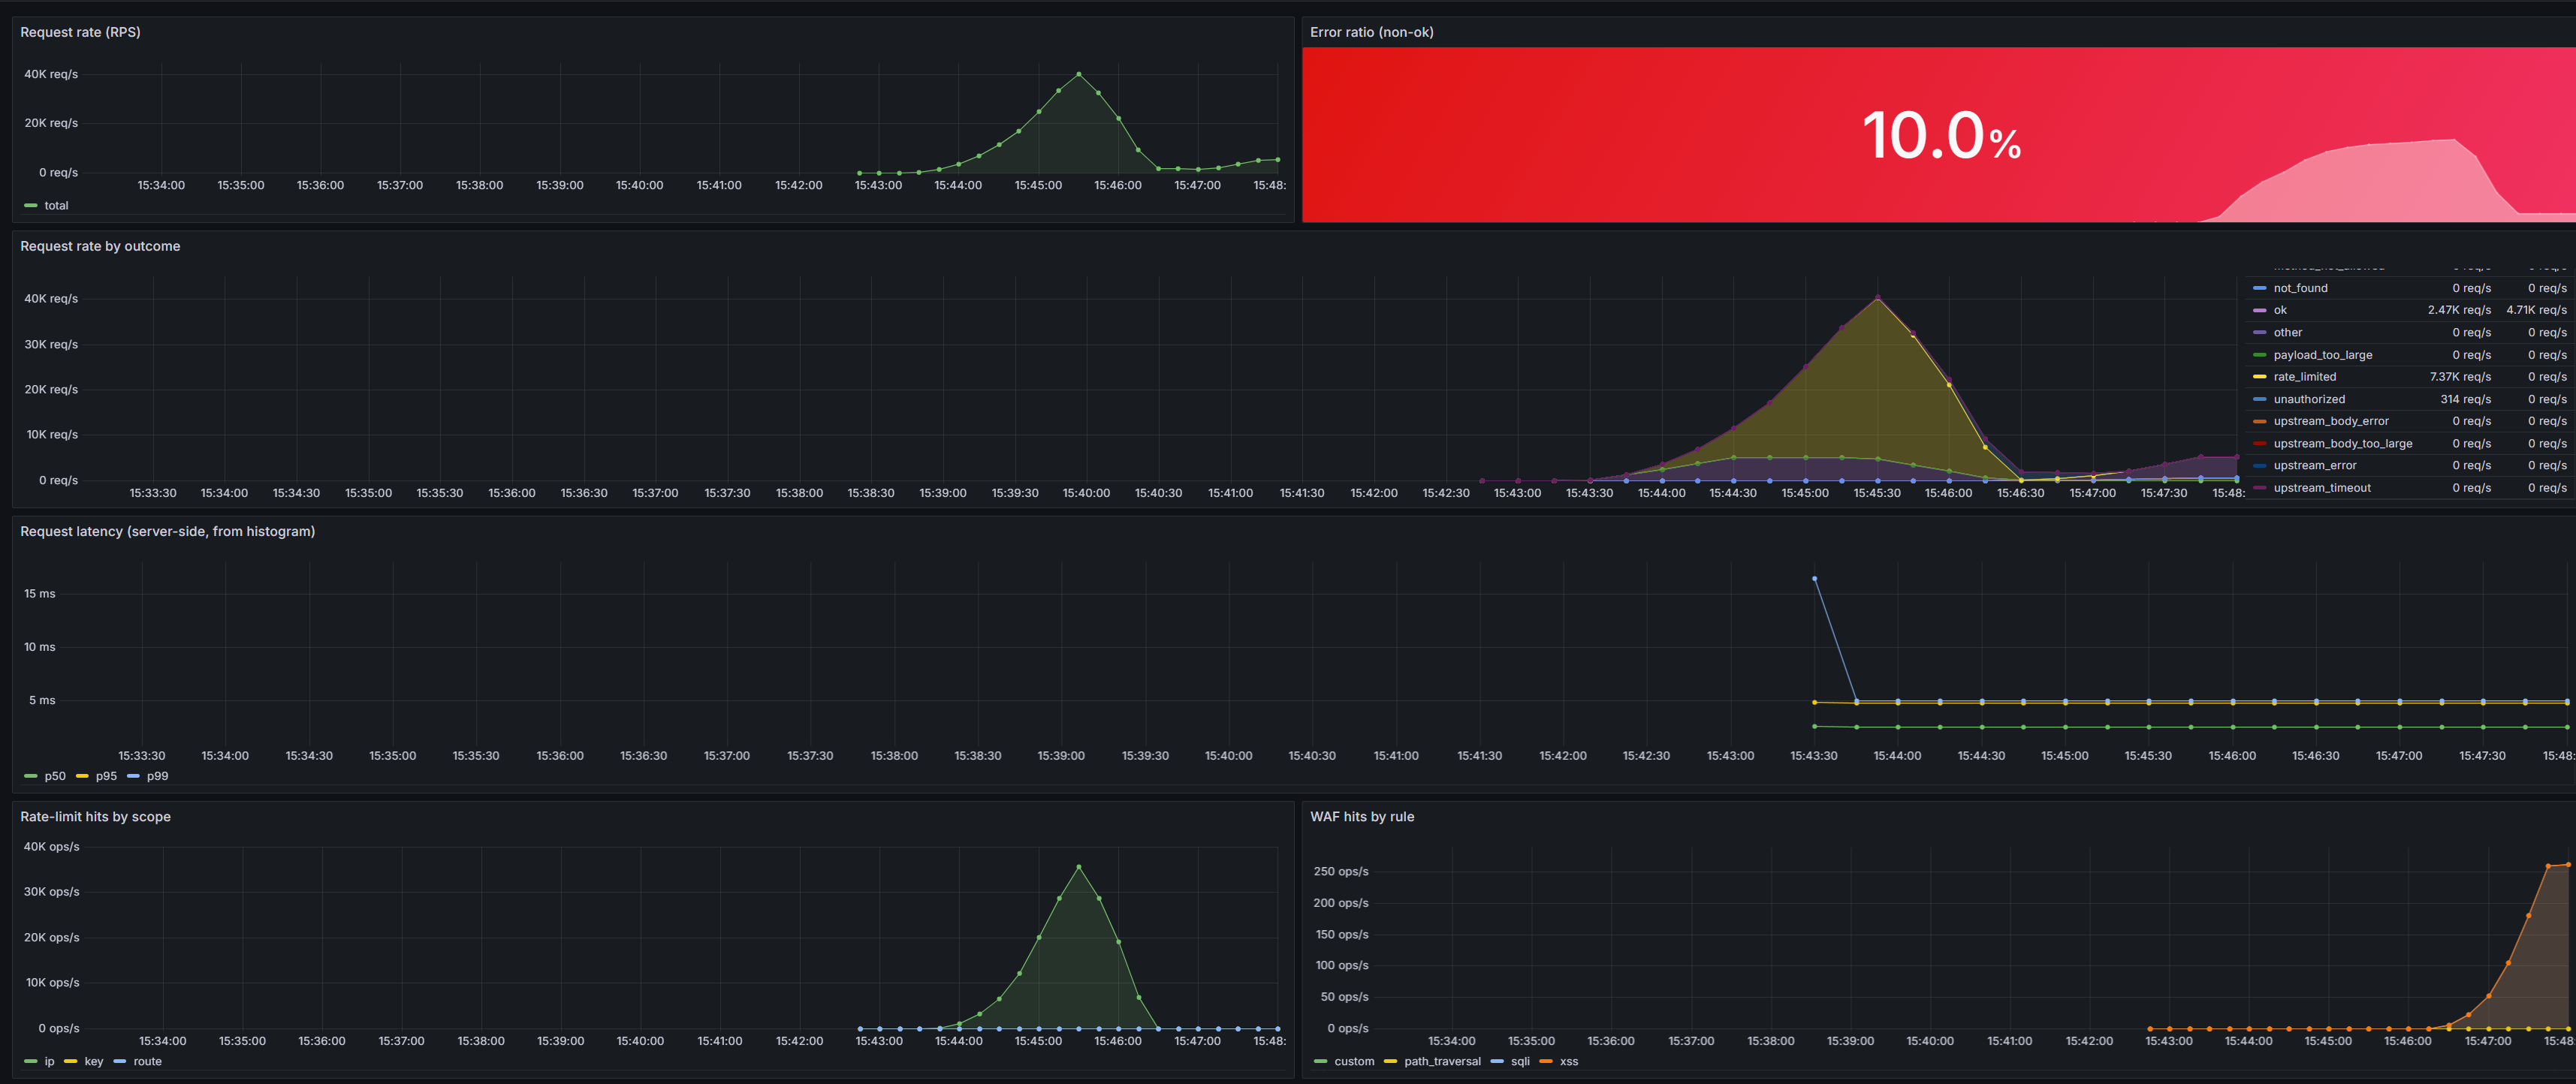
Live view of EdgeGuard's own server-side metrics (/__edgeguard/metrics, scraped by Prometheus). Shows how much traffic the proxy is taking, how fast it serves, and what it's blocking — at a glance, under load.
Monitors (6 panels):
- Request rate (RPS) — total throughput through the proxy.
- Error ratio — share of non-ok responses (green/yellow/red).
- Rate by outcome — requests split by result (ok, unauthorized, forbidden, rate_limited, upstream_error, …) — see what is failing.
- Latency p50/p95/p99 — server-side request duration from the histogram.
- Rate-limit hits by scope — limiter activity (per-IP / per-route / per-key) under overload.
- WAF hits by rule — blocked attacks by class (sqli / xss / path_traversal / custom).
In one line: traffic + latency + what's getting auth-gated, rate-limited, or WAF-blocked — the proxy's health and security posture in real time.
Data source config
Collector type:
Collector plugins:
Collector config:
Revisions
Upload an updated version of an exported dashboard.json file from Grafana
| Revision | Description | Created | |
|---|---|---|---|
| Download |