JMX Exporter
JMX Exporter Dashboard
Overview
The JMX Exporter dashboard provides a comprehensive view of YouTrack's health, performance, and resource utilization. It is designed to assist administrators in monitoring the internal state of the YouTrack application, ensuring high availability and optimal performance.
The dashboard combines several layers of monitoring:
- Application-level metrics: Specific to YouTrack's functionality, such as active users, version information, and database sizes.
- Database performance: Detailed insights into the Xodus environment, including transaction rates and disk usage.
- JVM statistics: Low-level data on heap and off-heap memory, garbage collection, thread counts, and file descriptor usage.
- Host resources: High-level metrics like CPU load relative to the host system.
By centralizing these metrics, the dashboard enables quick identification of bottlenecks, resource exhaustion, or unusual patterns in application behavior, facilitating proactive maintenance and troubleshooting.
Data Collection and Flow
The monitoring stack follows this architecture:
- JMX Exporter (Java Agent): YouTrack is configured with the
jmx_prometheus_javaagentas a JVM option. It runs inside the YouTrack JVM, reads MBeans from the platform MBean server, and translates them into Prometheus-compatible metrics. - Metrics Endpoint: The Java agent exposes these metrics on port
9404at the/metricspath. - Prometheus: A Prometheus instance scrapes the YouTrack metrics endpoint at regular intervals.
- Grafana: Grafana uses Prometheus as a data source to visualize the collected metrics via this dashboard.
- Grafana Foundation SDK: The dashboard is programmatically generated using a Kotlin-based Grafana Foundation SDK.
Key Metrics Shown
The dashboard is organized into several functional rows:
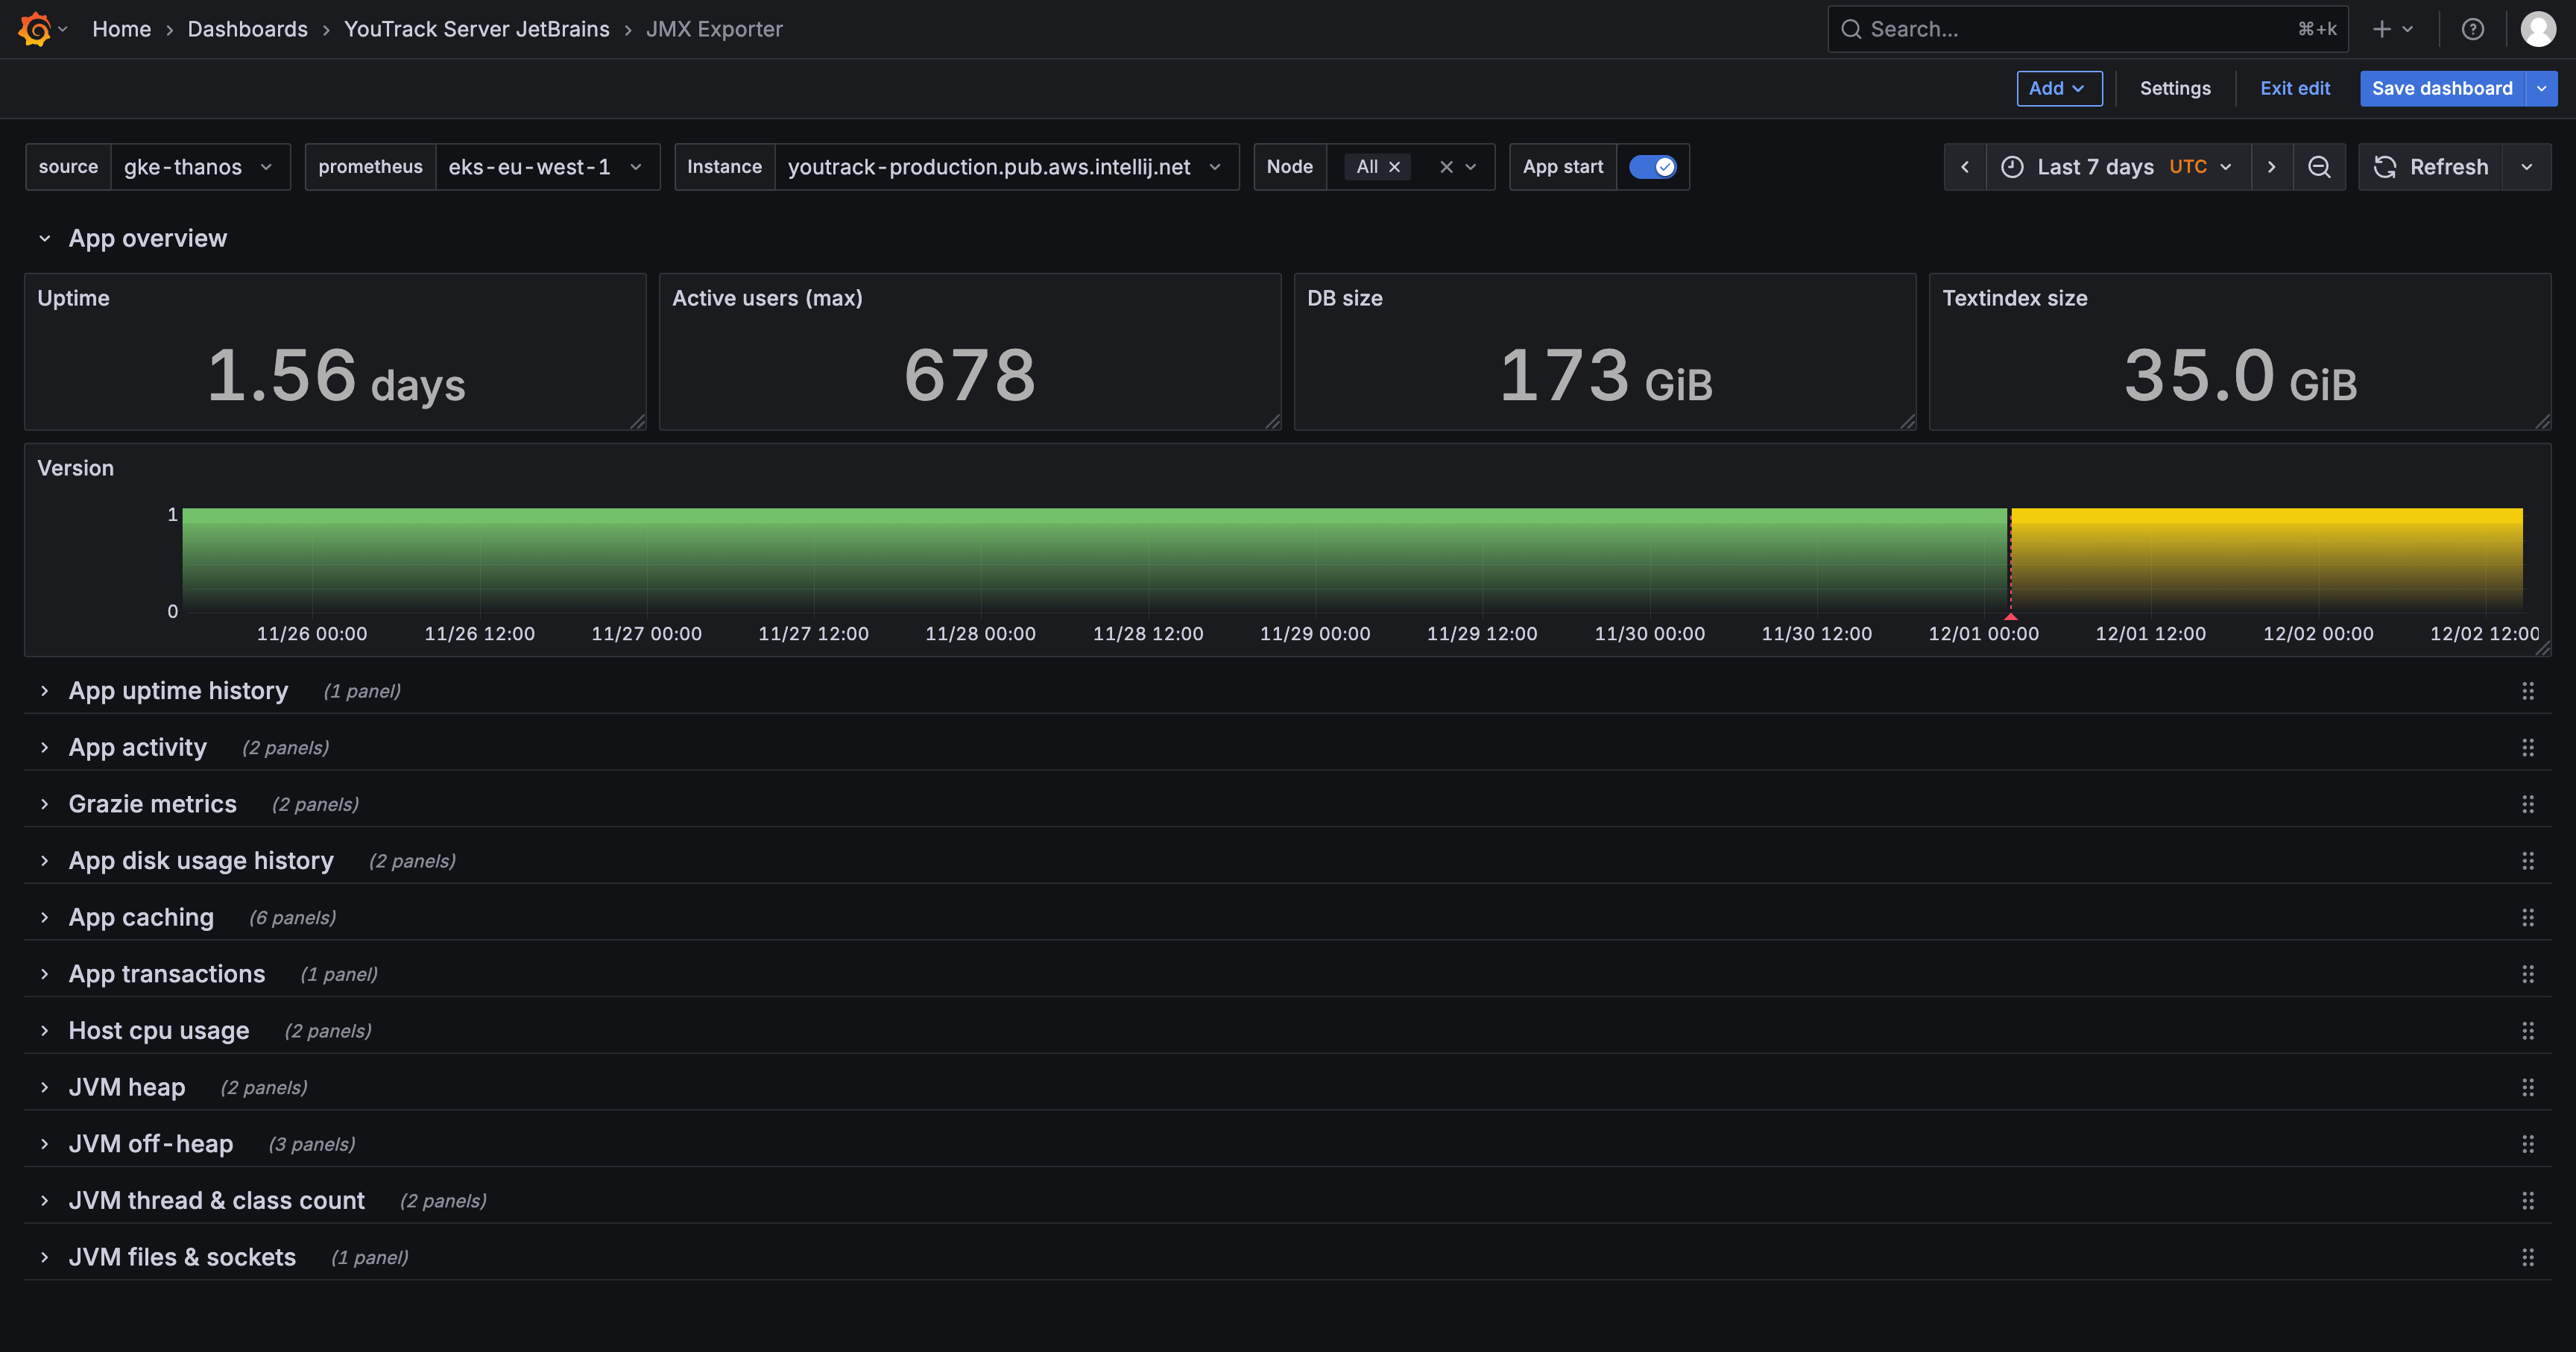
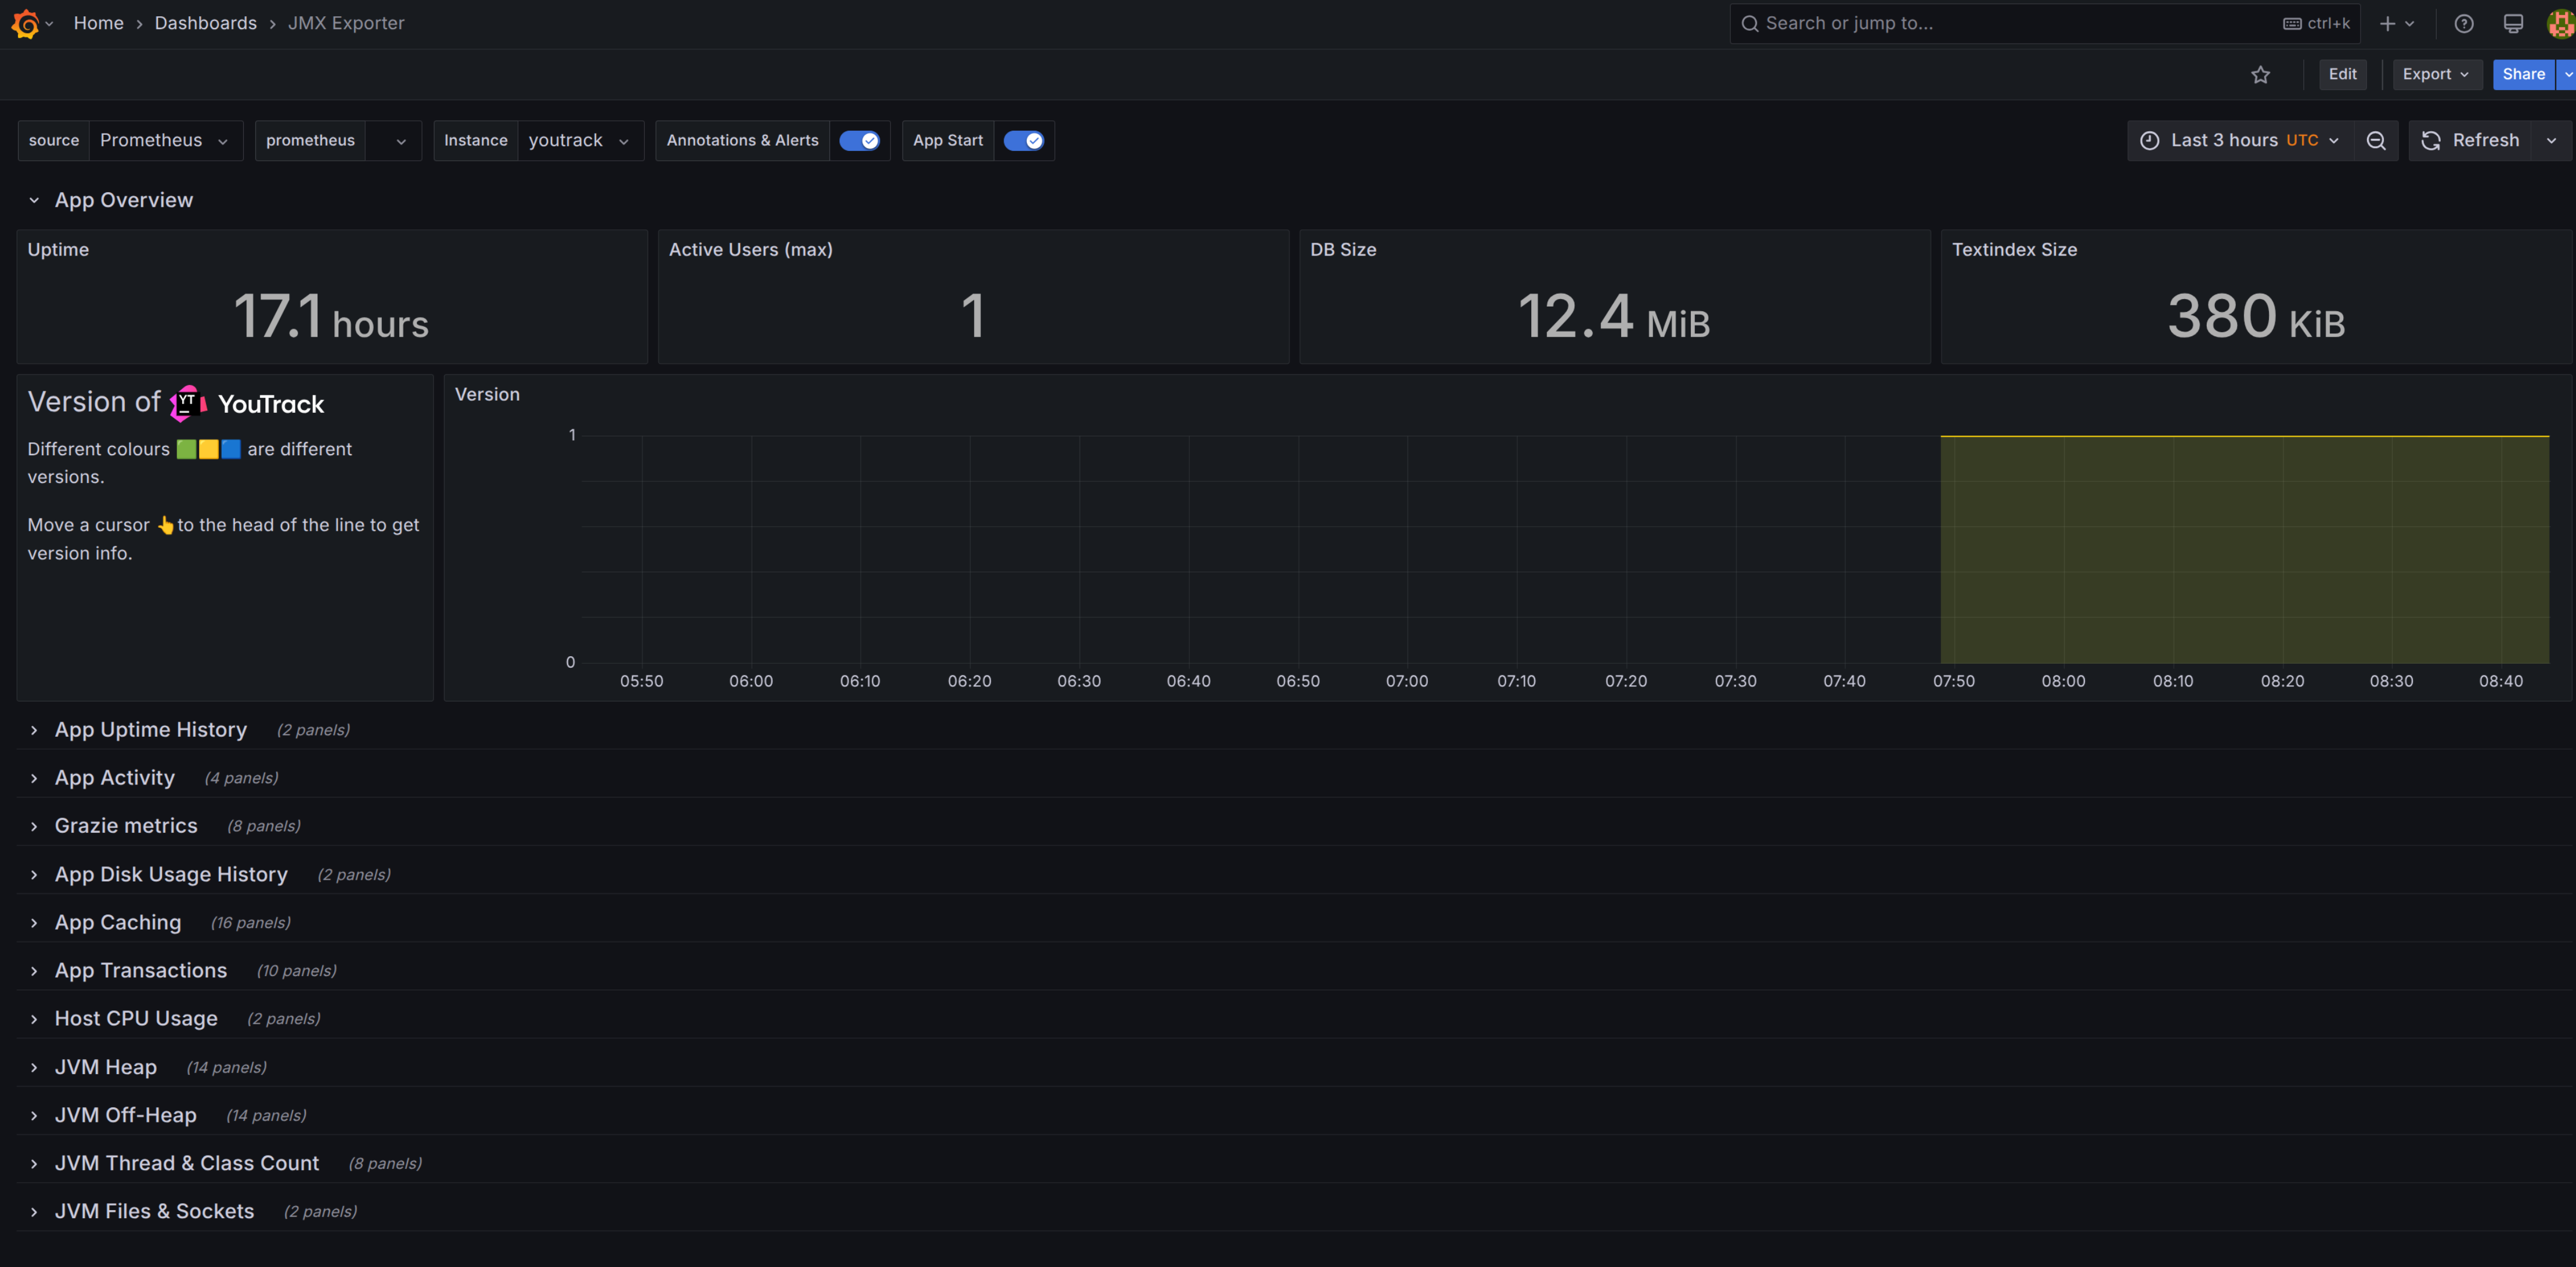
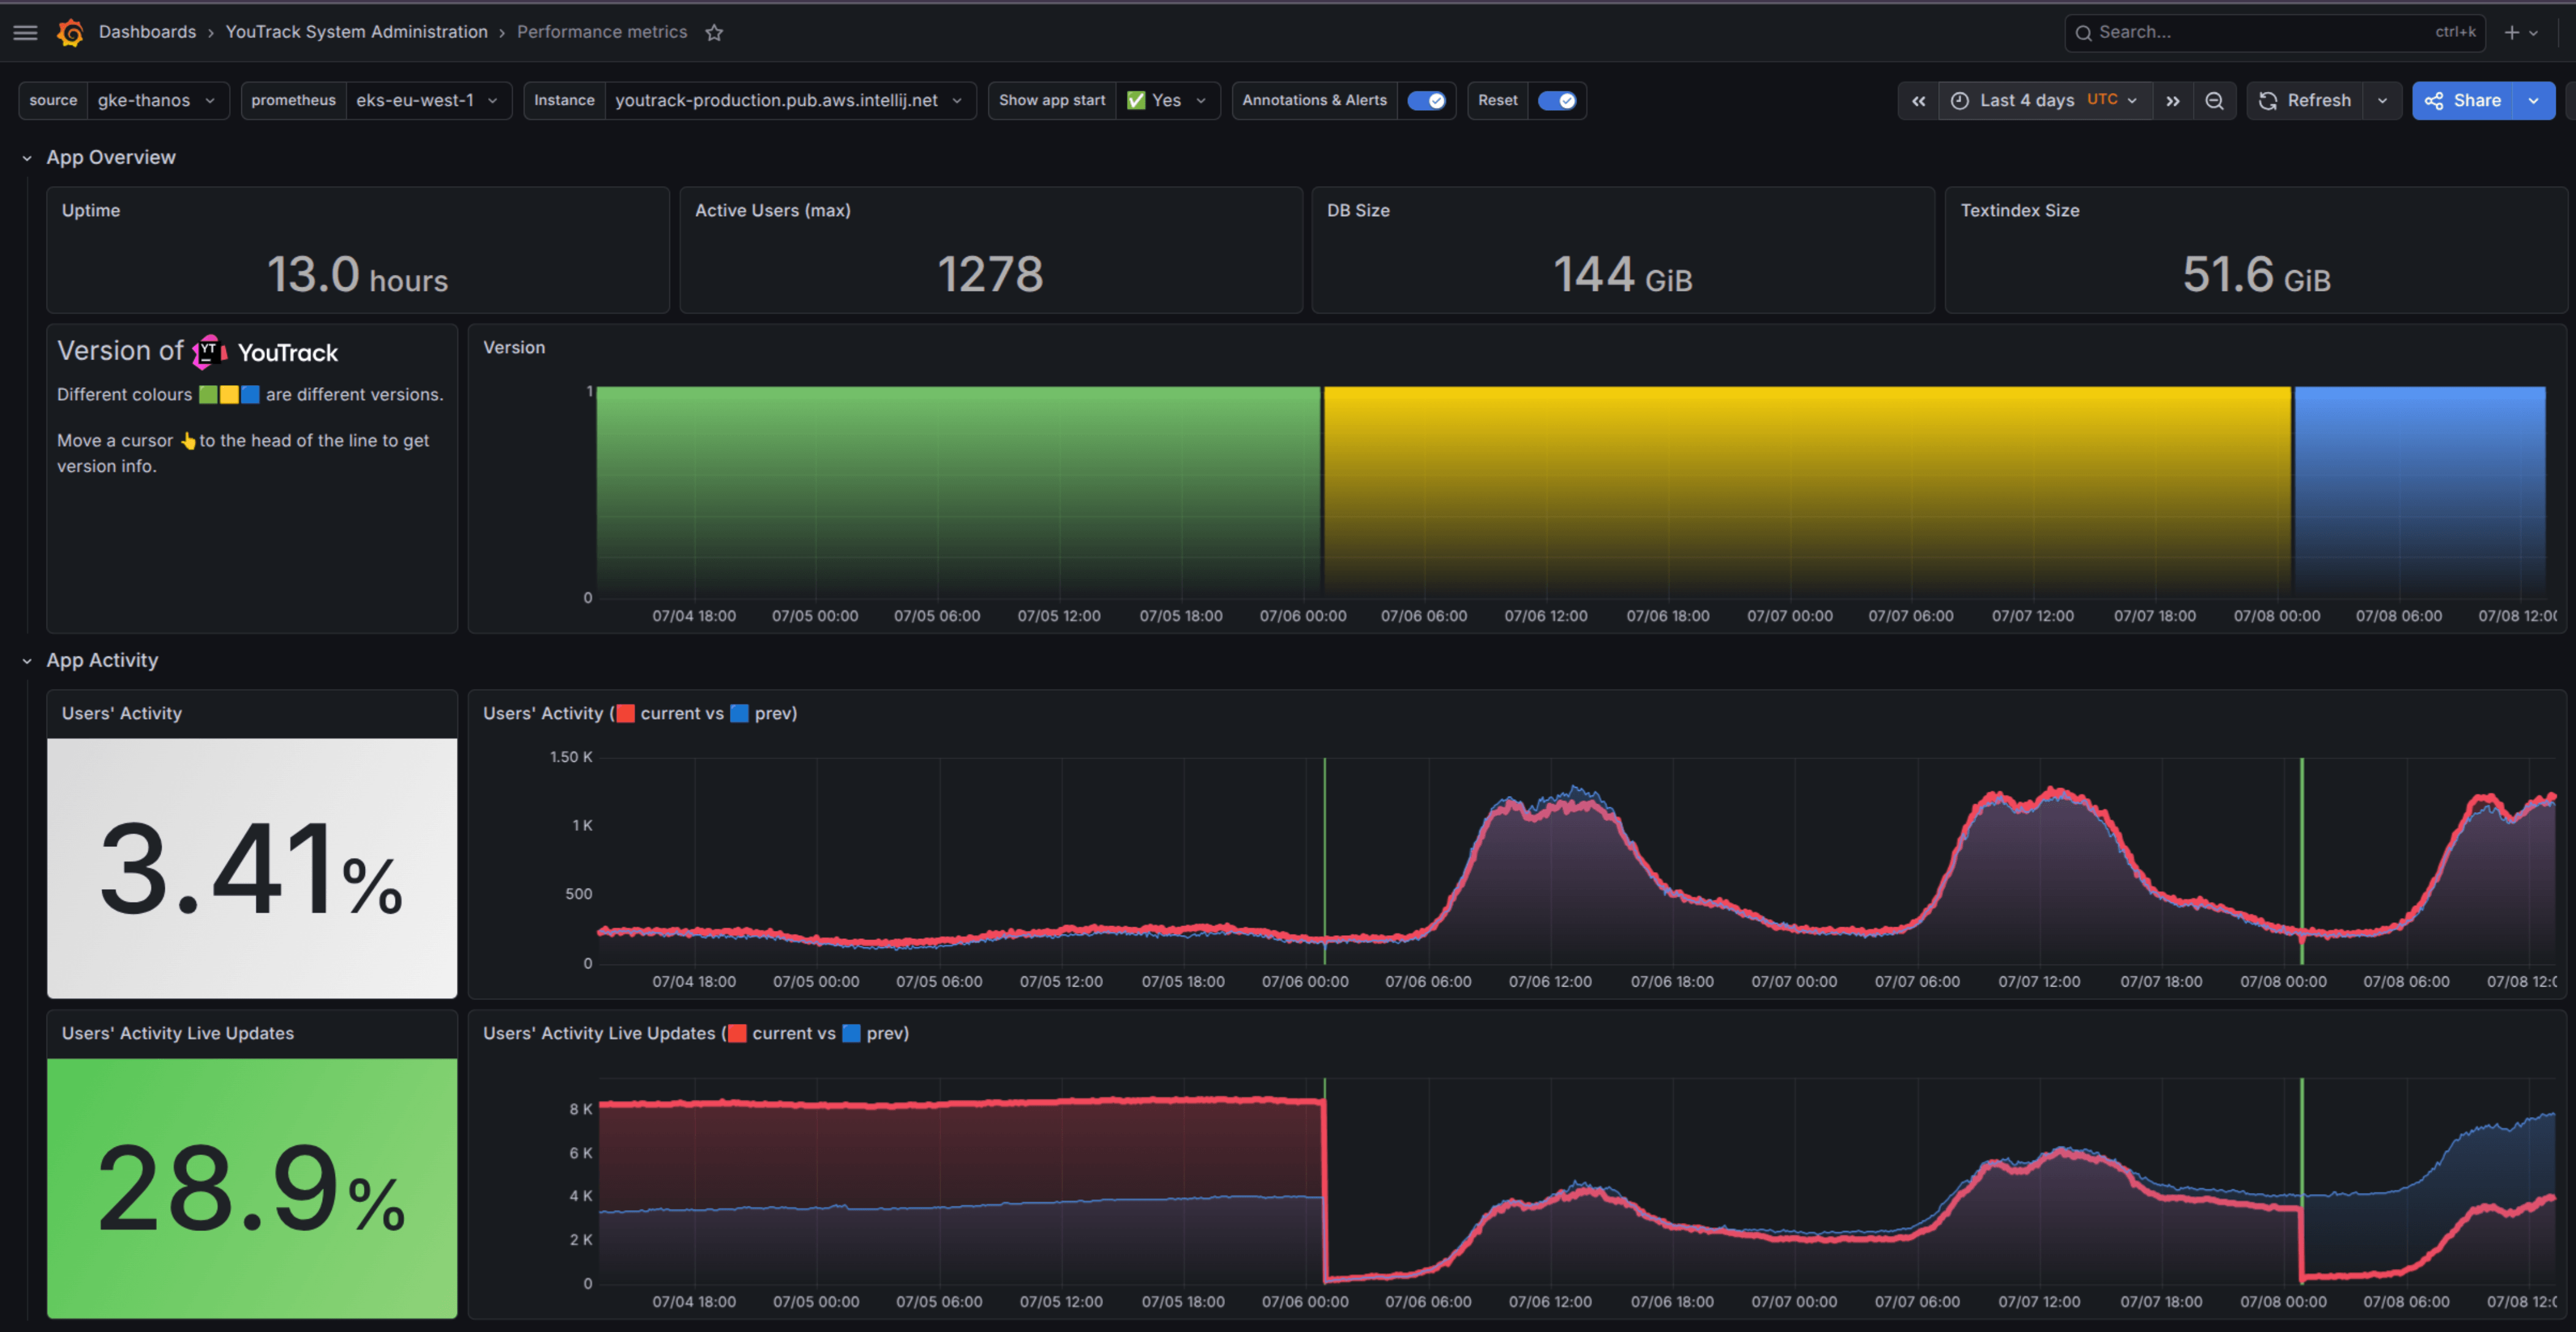
1. App Overview
| Panel name | Description |
|---|---|
| Uptime | Current running time of the YouTrack process. |
| Active Users | Maximum number of active user sessions. |
| DB & Textindex Size | Physical disk space occupied by the Xodus database and text indexes. |
| Version | The version of the running YouTrack instance. |
2. Application Activity & Performance
| Panel name | Description |
|---|---|
| Users' Activity | Tracks user interactions and live updates. |
| Disk Usage | Historical trends of physical storage usage. |
| Transactions | Xodus transaction rates and performance. |
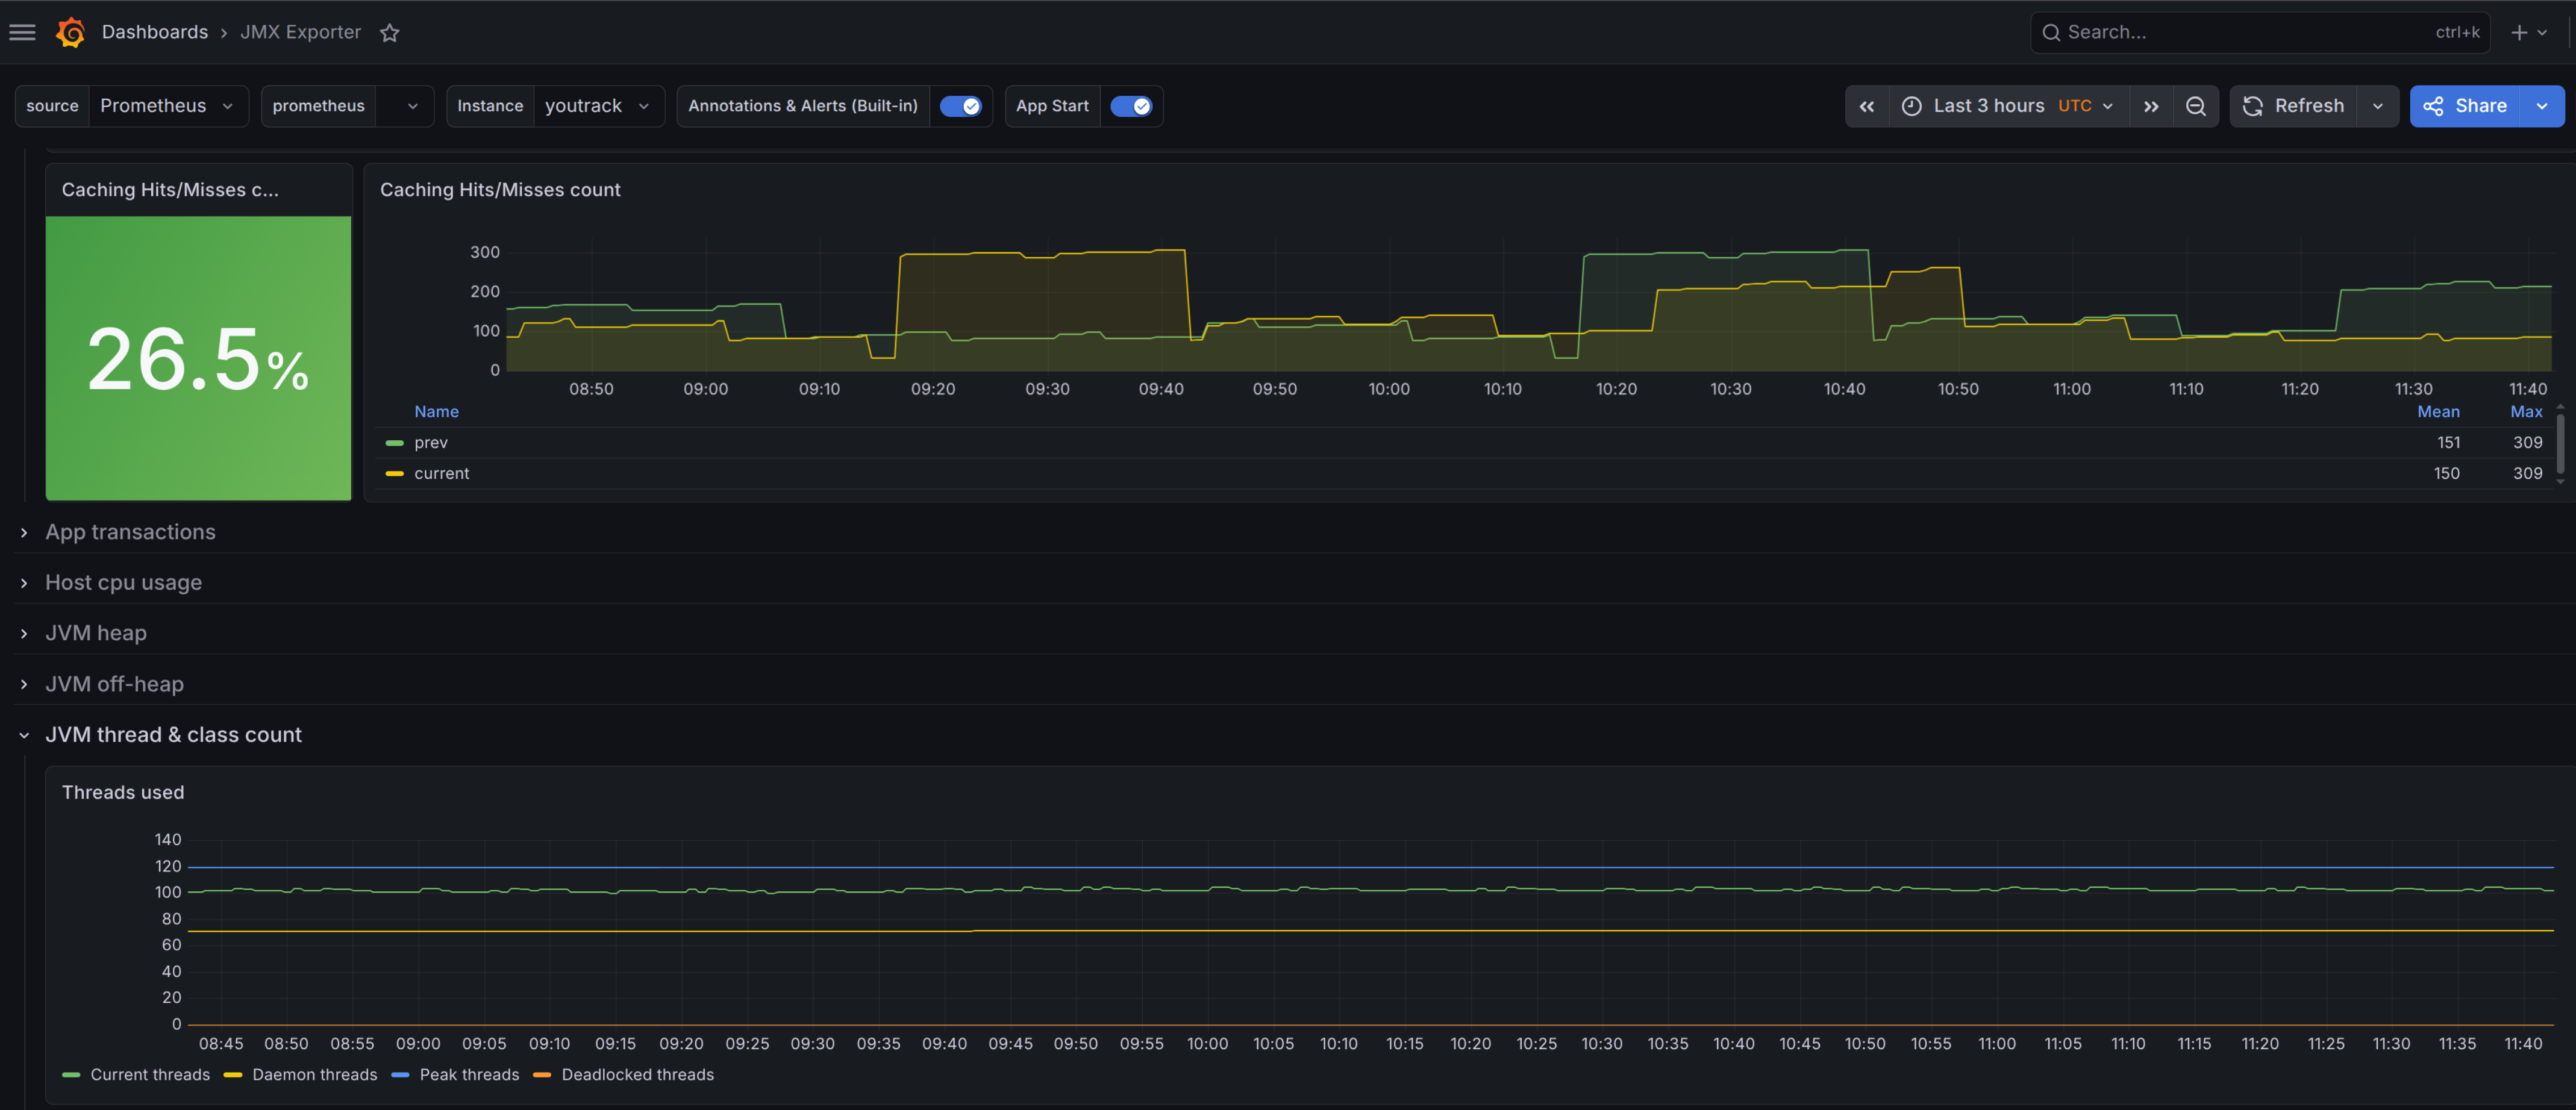
| Caching | Hit/Miss rates and job queue status for application-level caches. |
| Grazie Metrics | Performance data for Grazie-related integrations. |
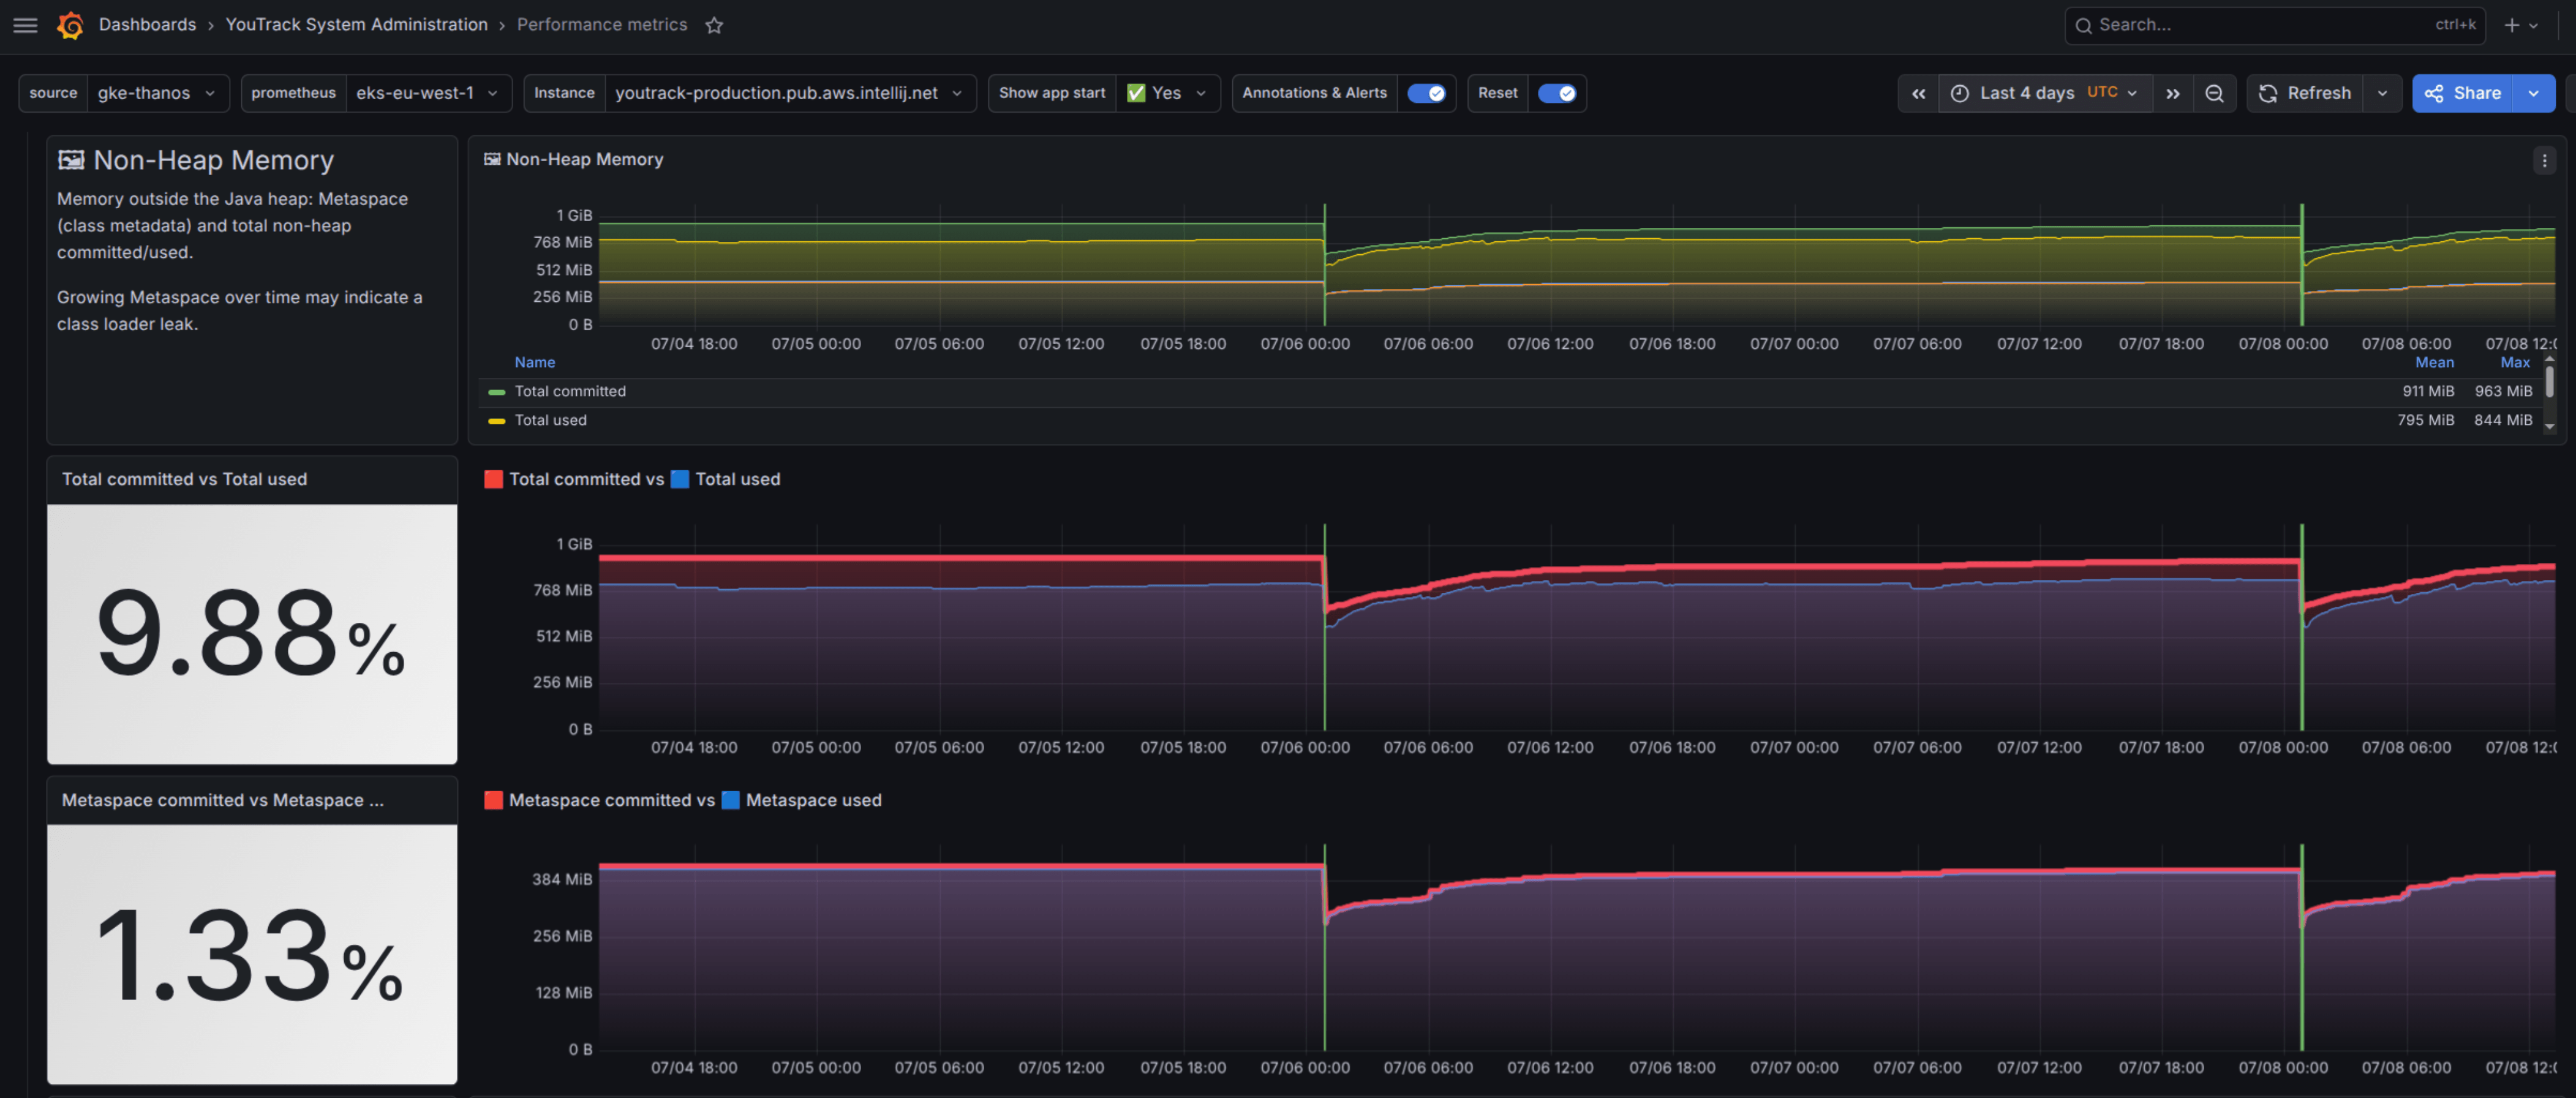
3. JVM Internals
| Panel name | Description |
|---|---|
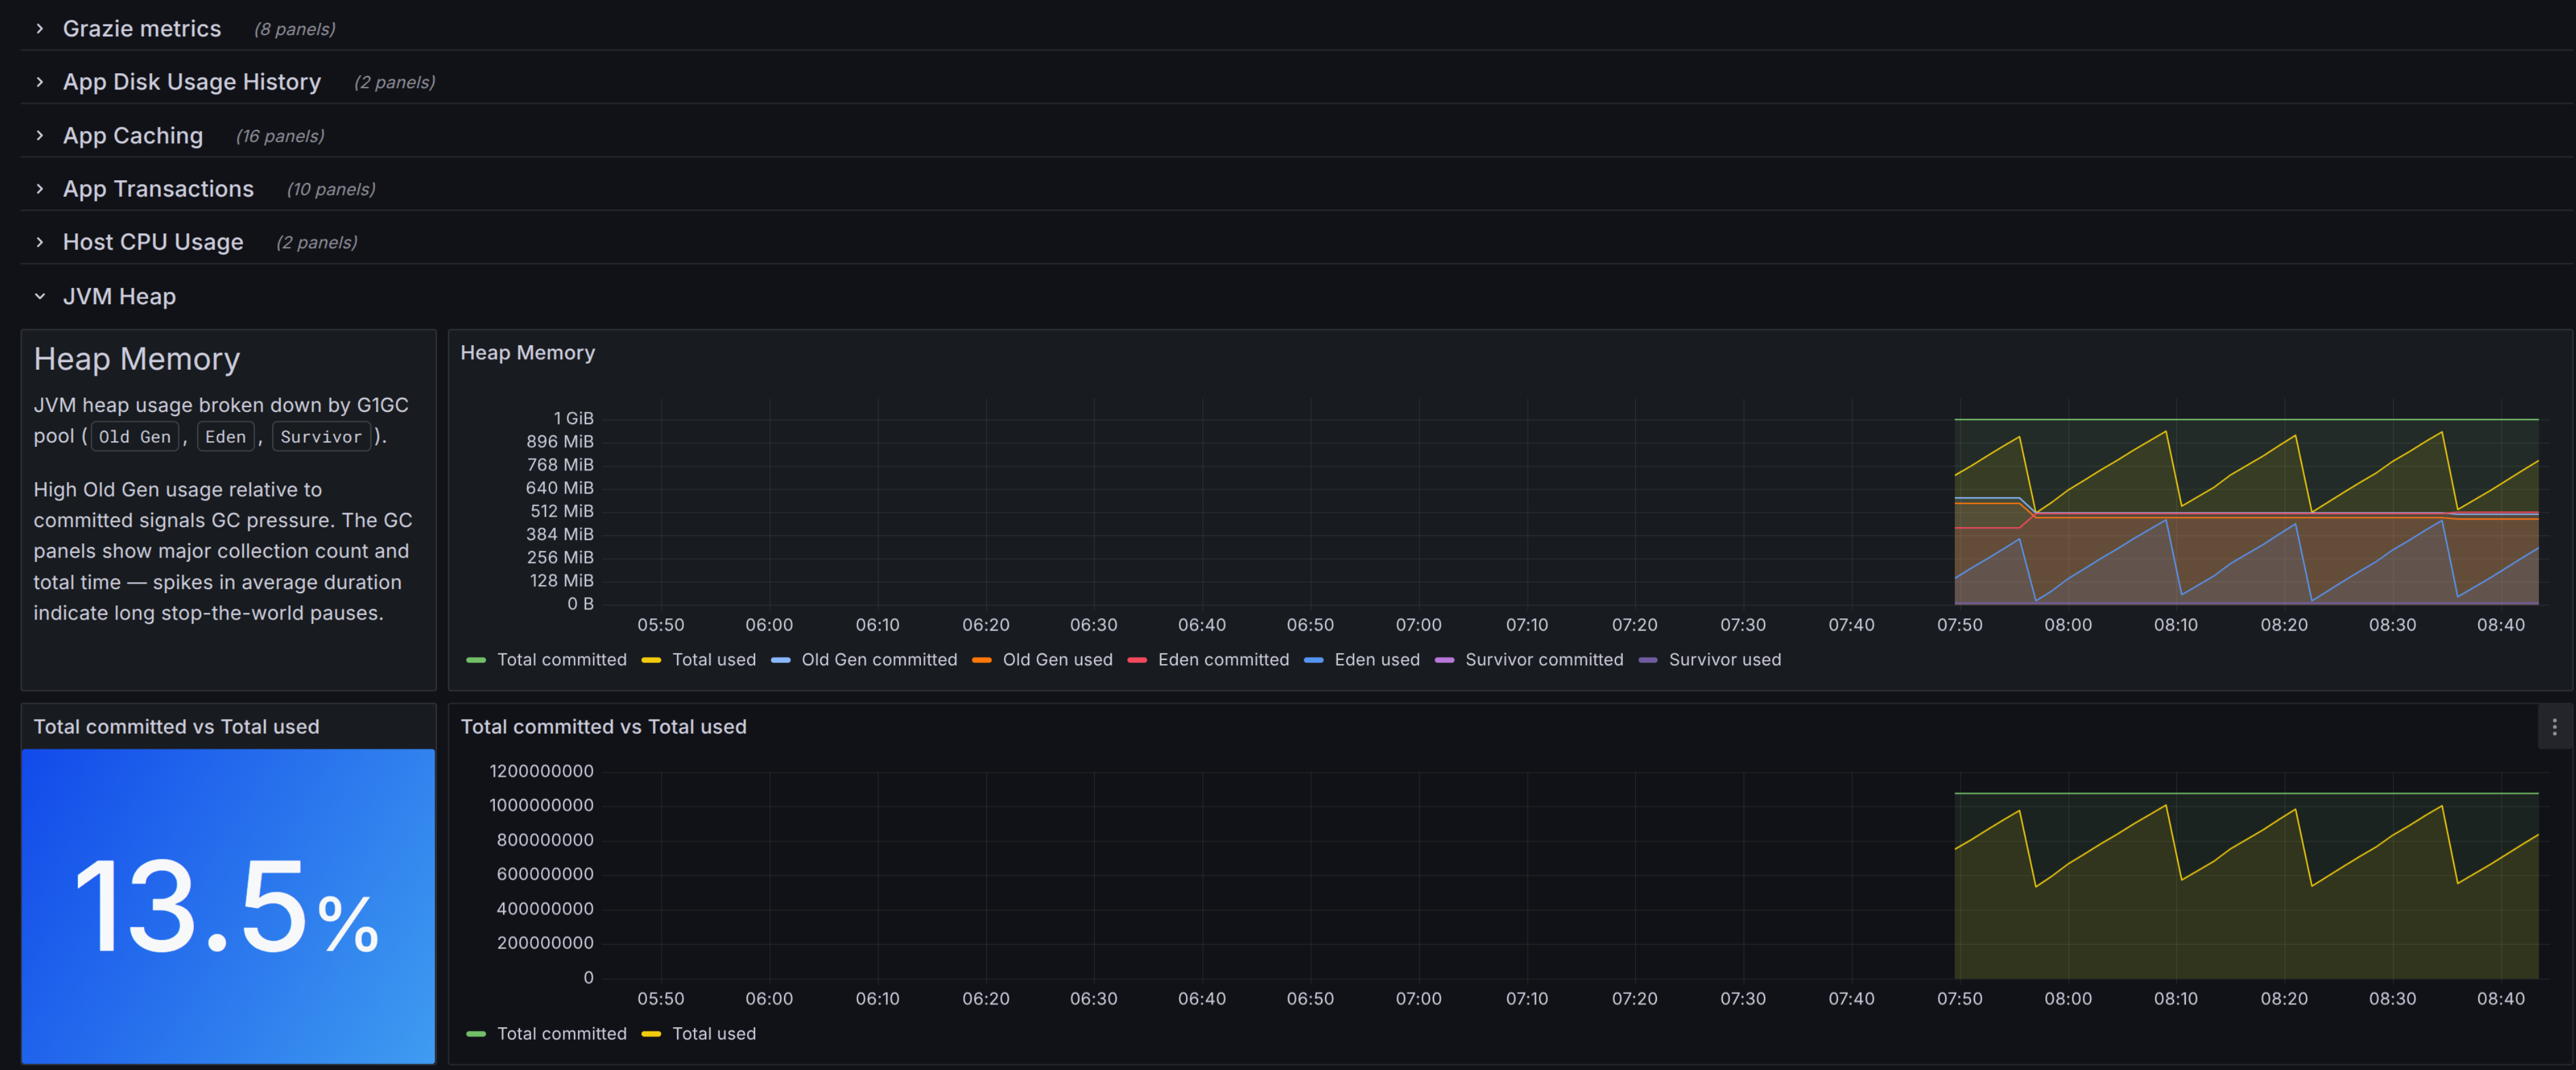
| JVM Heap | Memory usage in the heap (Total, Used, Max). |
| Garbage Collection (GC) | Count and average duration of GC events. |
| JVM Off-heap | Non-heap and native memory usage. |
| Threads & Classes | Number of active threads and loaded classes. |
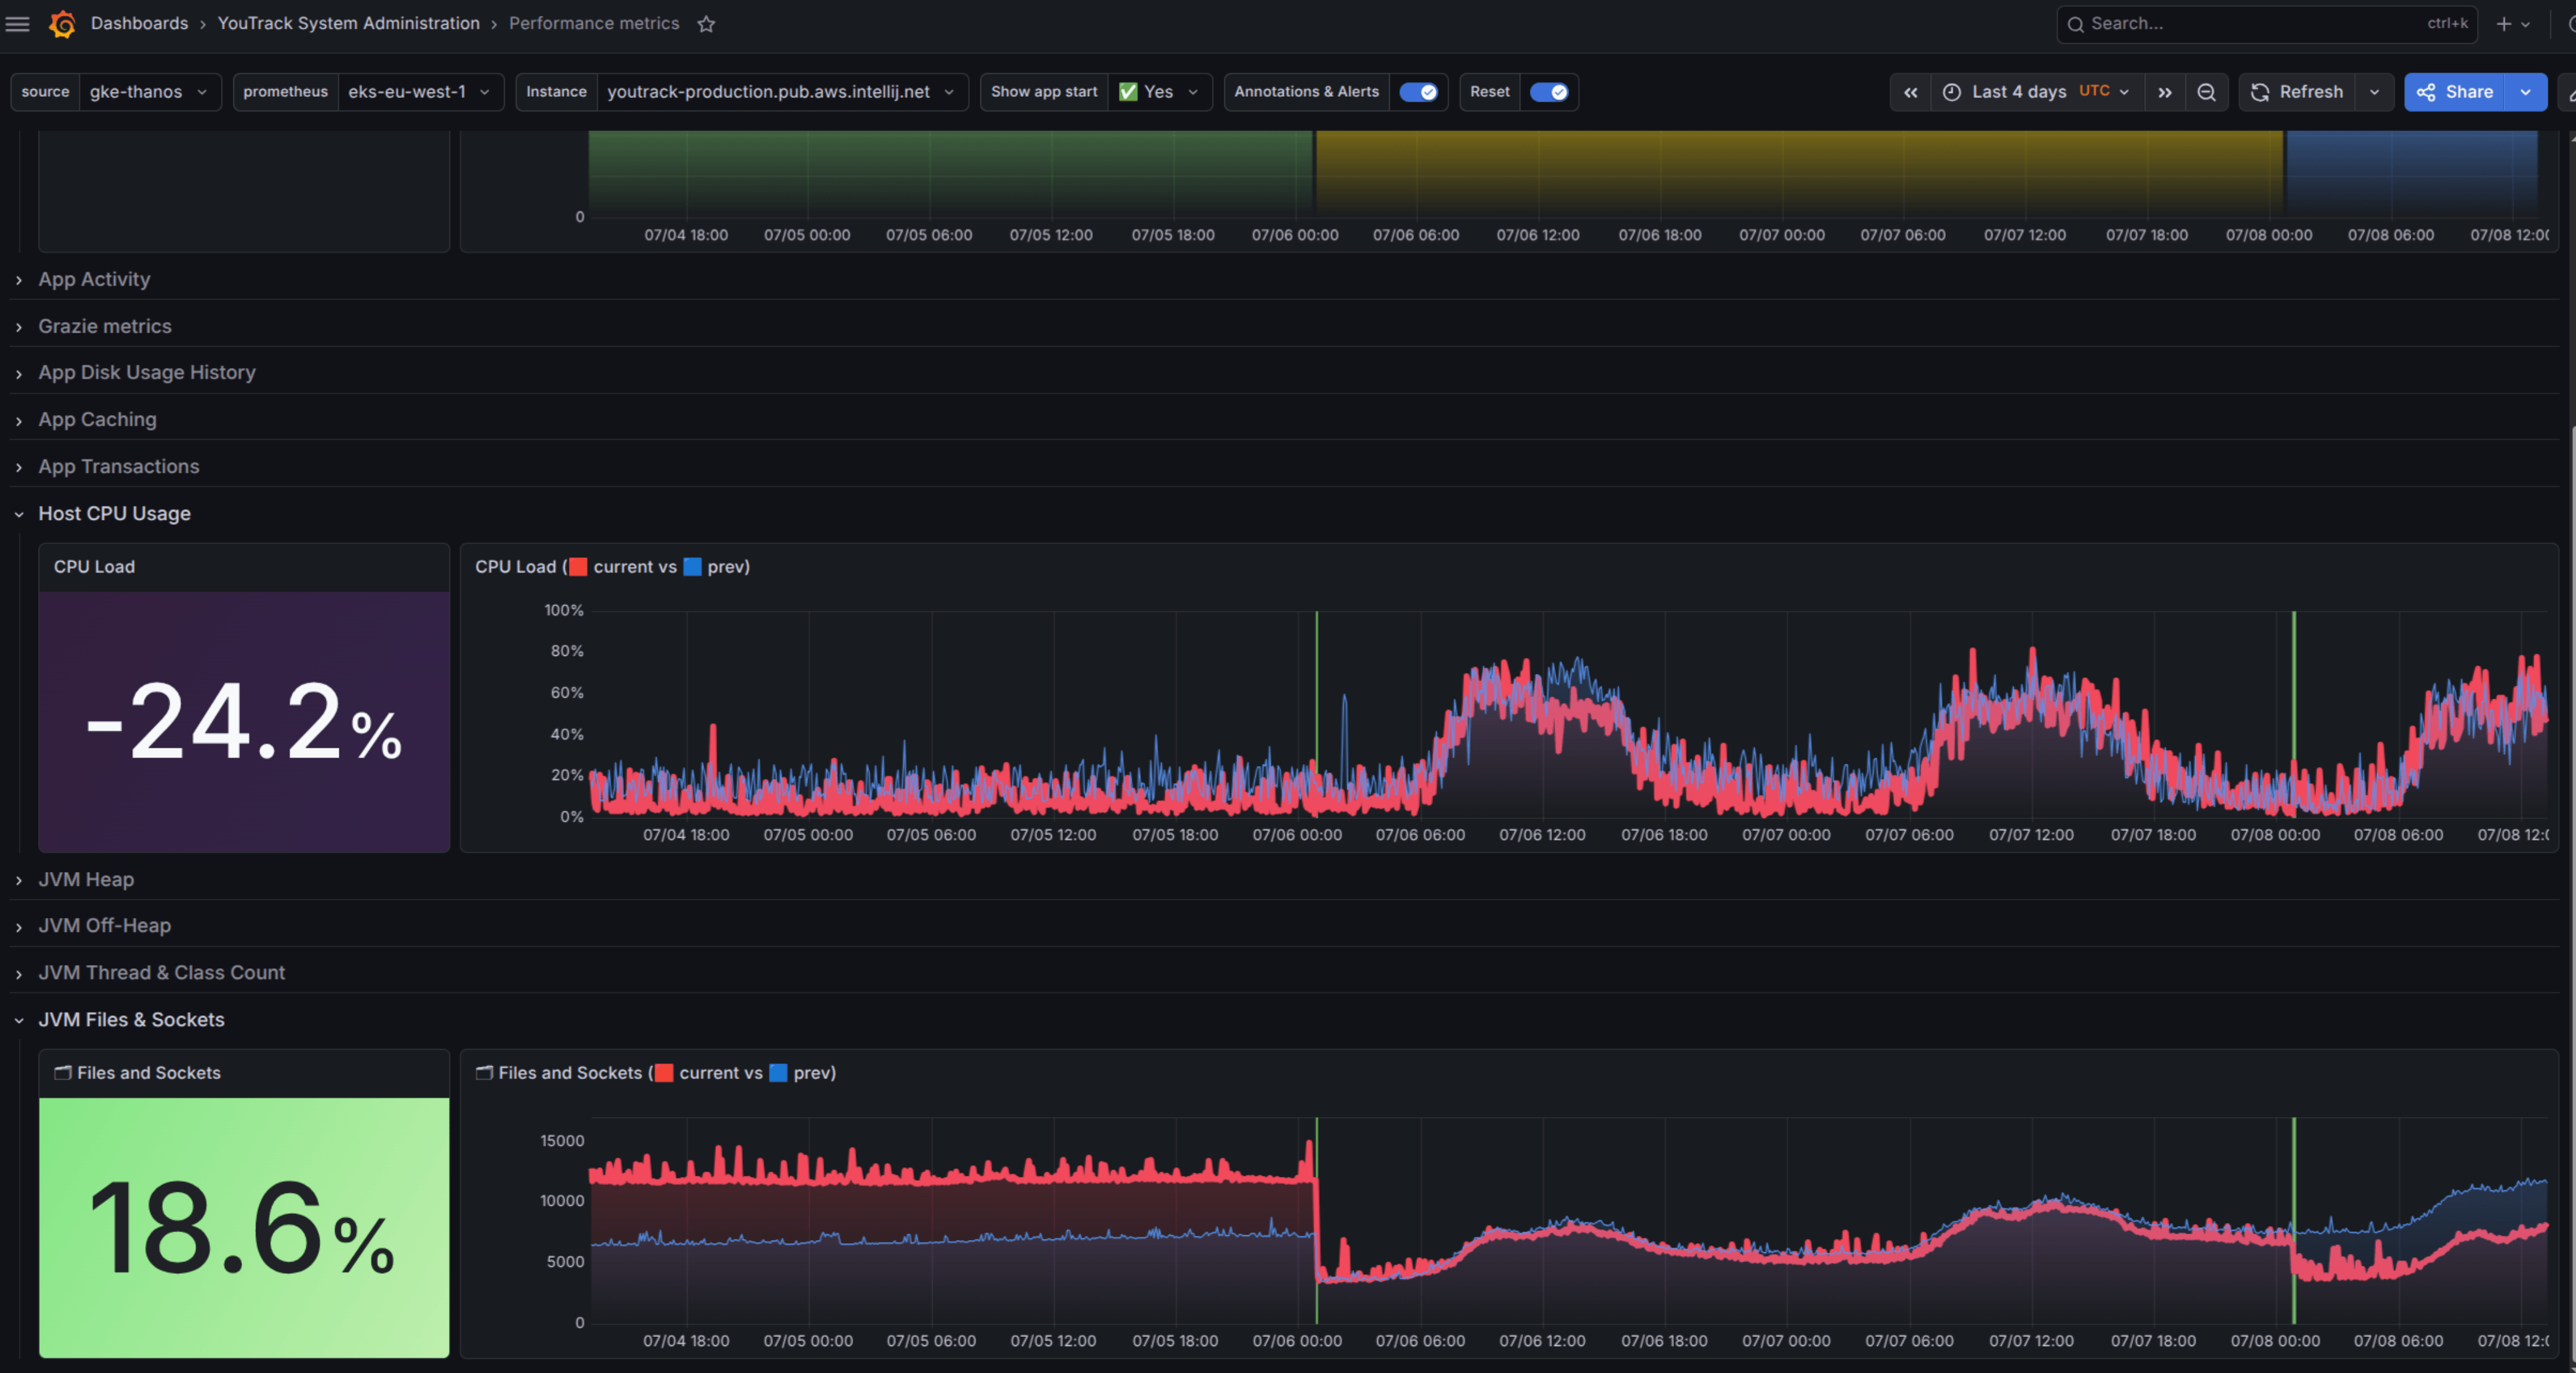
| Files & Sockets | Count of open file descriptors and network sockets. |
4. Host Metrics
| Panel name | Description |
|---|---|
| CPU Usage | Process CPU load relative to the host system. |
Data source config
Collector type:
Collector plugins:
Collector config:
Revisions
Upload an updated version of an exported dashboard.json file from Grafana
| Revision | Description | Created | |
|---|---|---|---|
| Download |