
Selectel Compute Detailed
Monitoring cloud servers within Selectel.
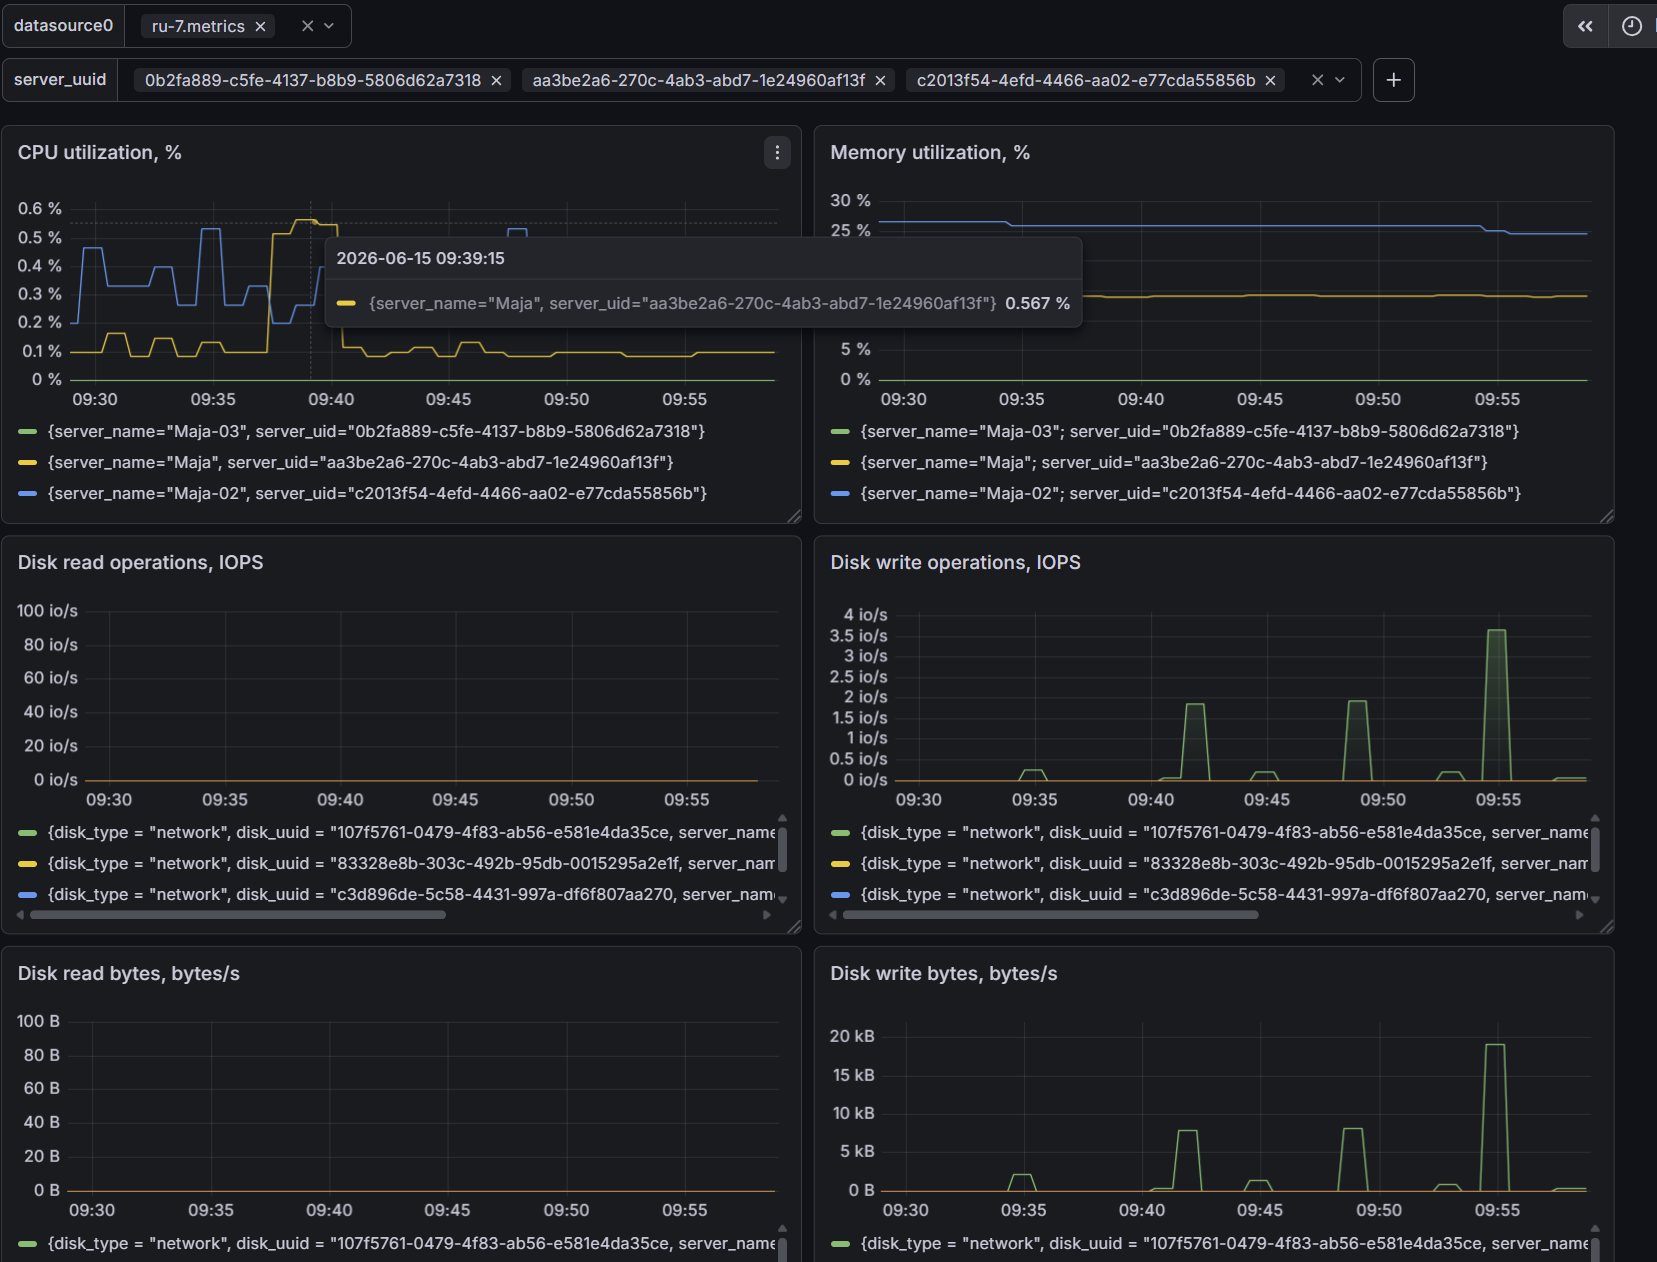
The dashboard is designed for monitoring Selectel cloud servers. It displays metrics collected from the hypervisor side.
Installation Import the dashboard JSON file into Grafana. Configure the data source. Map the variables (server_uuid).
Variables server_uuid - The UUID of the Selectel cloud server.
Data source config
Collector type:
Collector plugins:
Collector config:
Revisions
Upload an updated version of an exported dashboard.json file from Grafana
| Revision | Description | Created | |
|---|---|---|---|
| Download |