
I. Site Overview
Single-pane WordPress site health — traffic, latency, errors, security signals, and what each site is running. Companion to the Logystera WordPress agent.
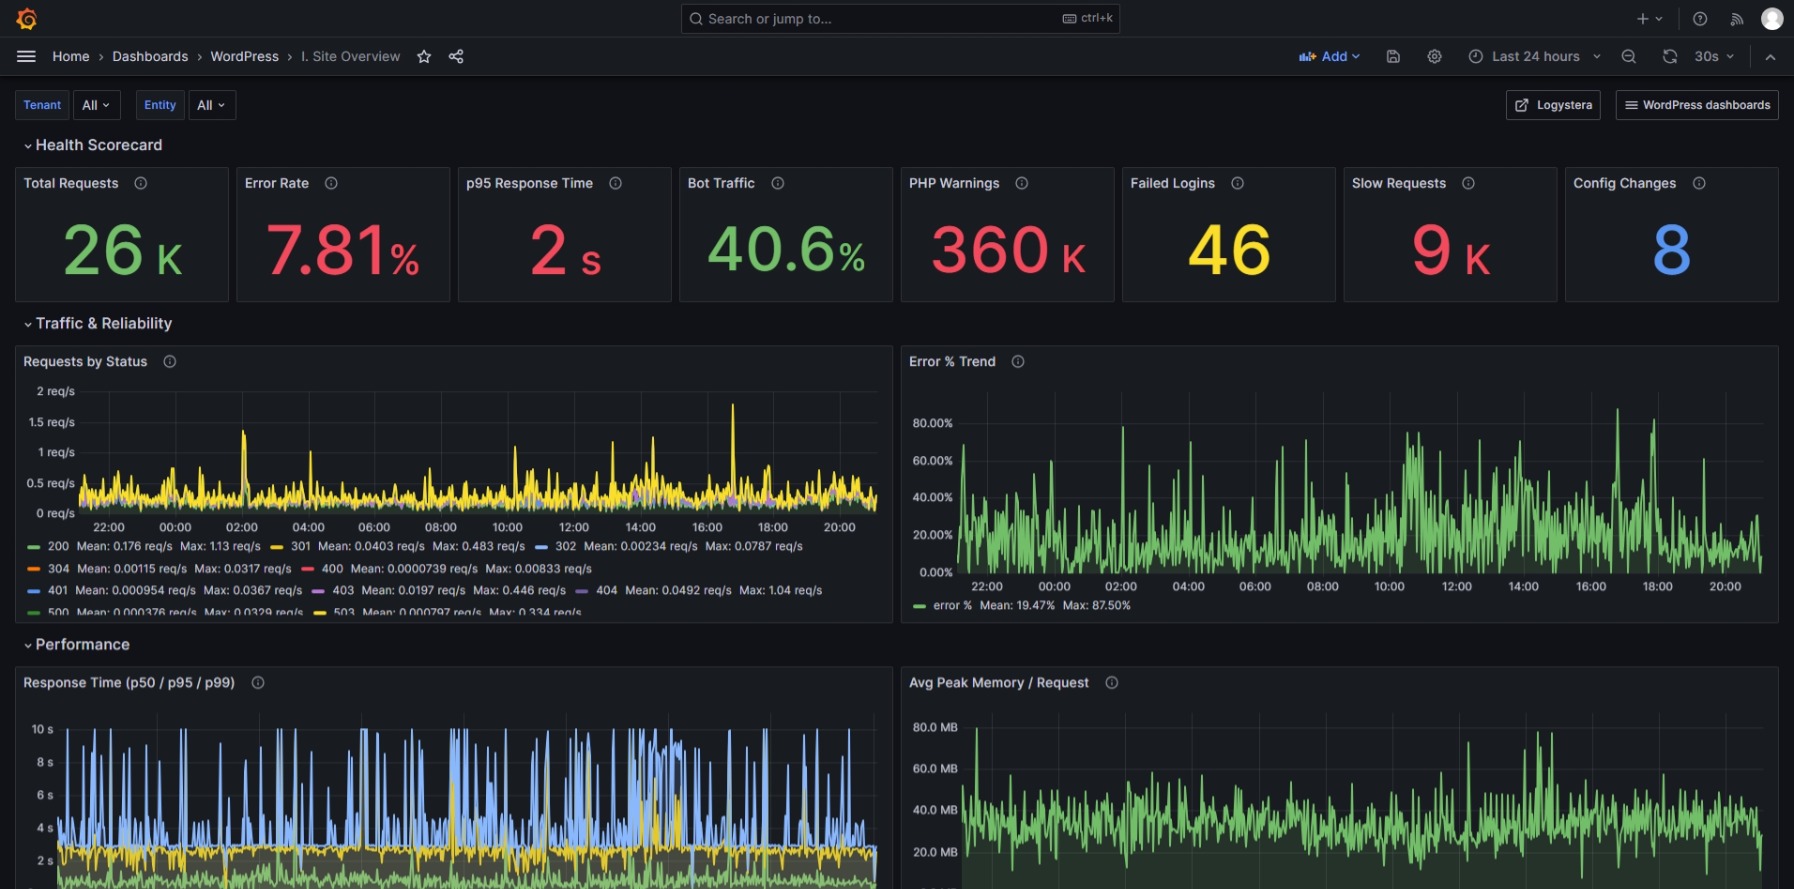
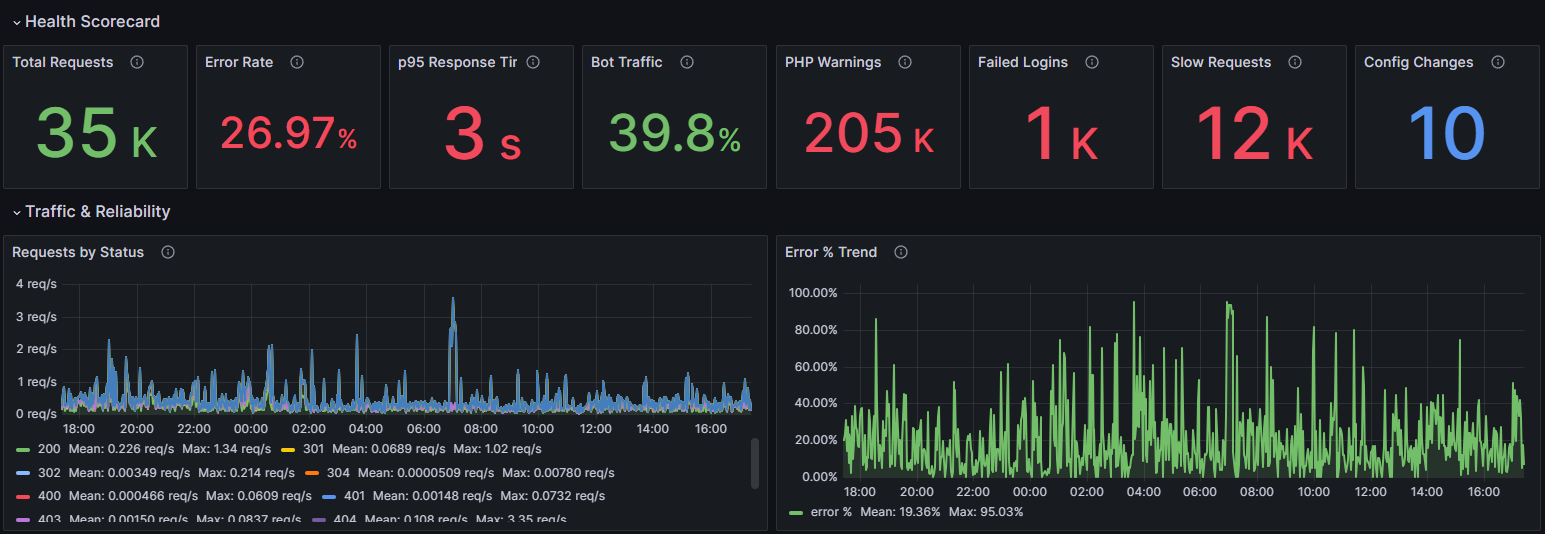
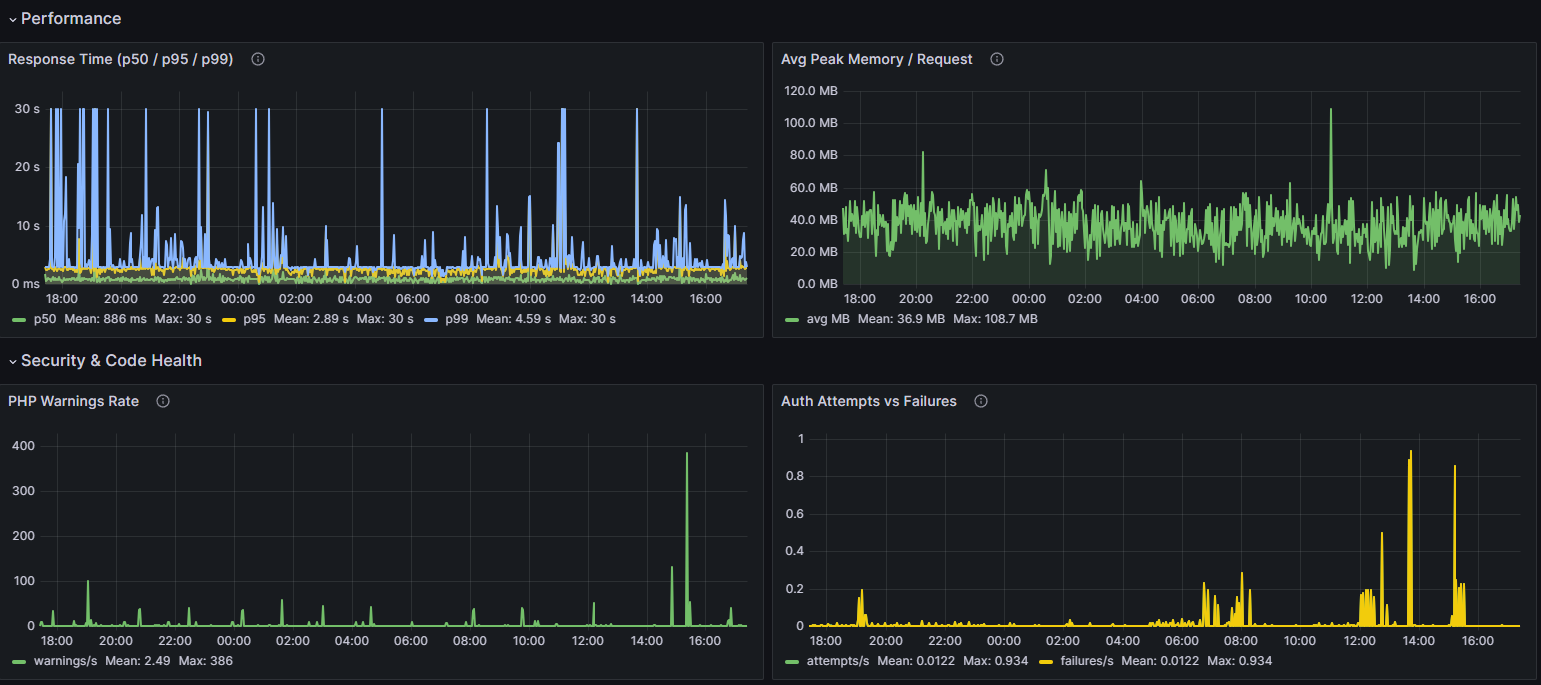
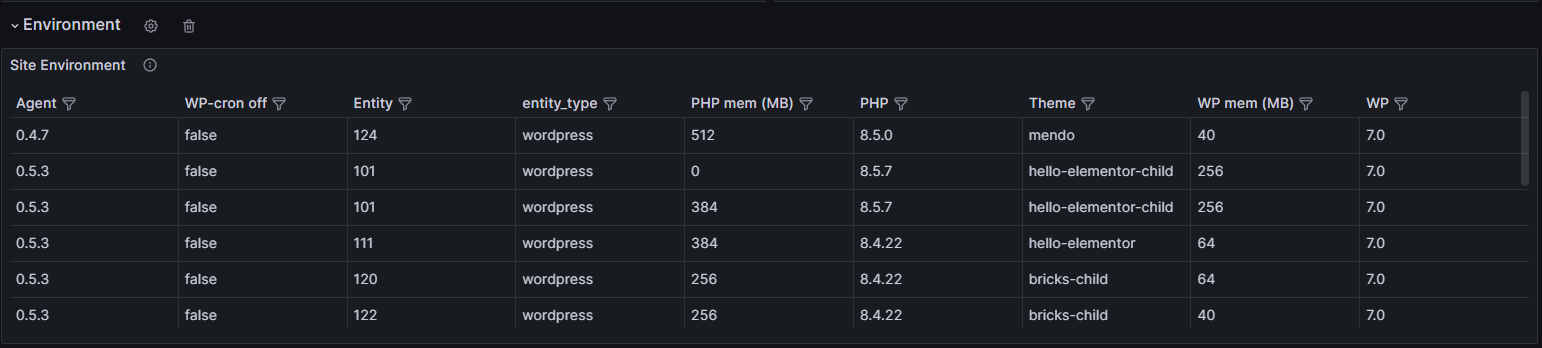
WordPress — Site Overview (Logystera)
Part of the Logystera WordPress dashboard suite — behavioral monitoring for the systems your team operates.
The entry point for monitoring a WordPress site: one screen that answers "is this site healthy right now?", then links out to the focused dashboards (Performance & Latency, Admin & Auth, Traffic Intelligence, Change & Drift, Incidents, Plugin Impact, Cron & Hooks).
Health scorecard
At-a-glance: total requests, error rate, p95 latency, bot share, PHP warnings, failed logins, slow requests, and config changes.
Sections
- Traffic & Reliability — requests by HTTP status, error-rate trend
- Performance — response time p50/p95/p99, average peak memory per request
- Security & Code Health — PHP warning rate, auth attempts vs failures
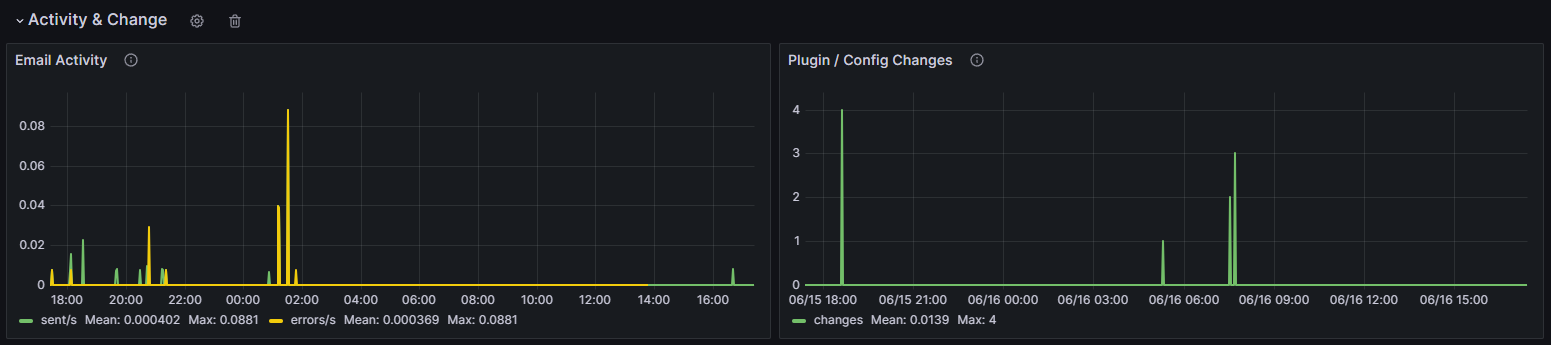
- Activity & Change — email delivery, plugin/config changes
- Site Environment — PHP & WordPress version, active theme, memory limits, agent version, WP-cron status
Variables
Filter by tenant and entity (site), with multi-select / All for fleet-wide rollups.
Requirements
- The Logystera WordPress agent, which emits the
wp_*metrics this dashboard reads. - A Prometheus-compatible datasource (Prometheus, VictoriaMetrics, …) scraping
those metrics — select it as
DS_PROMETHEUSon import.
Built by Logystera · WordPress monitoring that explains why, not just what.
Data source config
Collector config:
Upload an updated version of an exported dashboard.json file from Grafana
| Revision | Description | Created | |
|---|---|---|---|
| Download |